


1 INTRODUCTION
For at least 250 years (from the early 16th to the late 18th century), the majority of people in Brazil were coerced labourers or slaves; for about 400 years (until the early 20th century), the majority were «slaves» or their descendantsFootnote 1. Brazil is the fifth-largest country in the world by area and population (8.5 million km2 and 205.7 million; CIA 2012) and it received nearly half of all slaves brought to the Americas (5.5 of 12.5 million; Trans-Atlantic Slave Trade Database (TASTD) 2010). Its economy, institutions, and identity were profoundly influenced by slavery, yet «…there is practically no statistical information for the first 250 years of its existence» (Marcílio Reference Marcílio1984, p. 37) and it has the trans-Atlantic trade with the least data coverage (Eltis et al. Reference Eltis, Behrendt, Richardson and Klein1999).
I explore the population history of Brazil from its discovery by Europeans in 1500 until the end of the international slave trade in 1850, focusing on how European technology and New-World resources combined to guide the size, scope and racial composition of their settlements. The demographic history of Brazil has been summarised in global studies (e.g. McEvedy and Jones Reference McEvedy and Jones1978; Livi-Bacci Reference Livi-Bacci1992) and regional (e.g. Rosenblat Reference Rosenblat1954; Sánchez-Albornoz Reference Sánchez-Albornoz1974); the underlying sources, however, indicate that such estimates are rather tentative. Country-level analyses by Marcílio (Reference Marcílio1984) and Livi-Bacci (Reference Livi-Bacci2001) confirm that knowledge regarding the size and spatial distribution of Brazil's population during the pre-census era is incomplete.
Forced labour had a prominent role in the historical development of Brazil. Everyday people are familiar with its legacy, yet regional changes in racial composition over time are not well-understood, nor are the economic incentives which caused them. Racial diversity is a positive force, yet it is also associated with low public goods provision and poor institutions (Alesina and La Ferrara Reference Alesina and La Ferrara2005). It is therefore important to understand the origins of racial geography in Brazil; in particular, the system of production that prompted the forced migration of millions of African or indigenous peoples.
This investigation is organised into three broad periods, loosely labelled as the «sugar era» (16th-17th century); the «gold era» (18th century); and the «coffee era» (19th century). For each epoch, I provide consolidated population statistics by state and race, forward projections of the initial Native population, output and workforce estimates, and African slave import figures. These data allow me to reconstruct Brazil's early demographic history through its reliance on coerced labour, showing how slave trade dynamics impelled regional shifts in racial identity.
Similar methods have been used to evaluate national population figures for Brazil (e.g. Simonsen Reference Simonsen1937; Goulart Reference Goulart1975), but never in a comprehensive way. I find that the observations of early administrators and chroniclers are credible, often coinciding with alternative estimates, and describe racial trends across states for ten reference periods (1545, 1570, 1585, 1625, 1675, 1725, 1775, 1800, 1825 and 1850) before the first national census of 1872. Declining Native populations and insatiable labour demand prompted the massive importation of African slaves to Brazil, making it an «African» nation by the mid-18th century.
2 THE SUGAR ERA
The section of South America that would become known as Brazil was discovered by the Portuguese in 1500 during their maritime expansion. At the time, they had already settled several Atlantic islands, established trading forts down the African coast, rounded the Cape of Good Hope, and reached the Indian Ocean (Mauro Reference Mauro2000). For roughly thirty years, the Portuguese traded with aboriginals for brazilwood (a dyewood which gave the region its name), but challenges for the region hastened its direct settlement (Souza Reference Souza2000)Footnote 2.
2.1 European settlement
The area of South America to the east of the Line of Tordesillas (set by Spain and Portugal in 1494) was divided into fifteen lots and allocated to twelve men with court connections (Johnson Reference Johnson1987). By 1540, only seven «captaincies» were effectively settled — São Vicente, Santos, Itamaracá, Pernambuco, Espírito Santo, Porto Seguro, and Ilhéus — with Bahia and Rio de Janeiro re-established during the following decade (Varnhagen Reference Varnhagen1956). The original captaincies are illustrated in Figure 1 based on Varnhagen's geographic descriptionsFootnote 3.
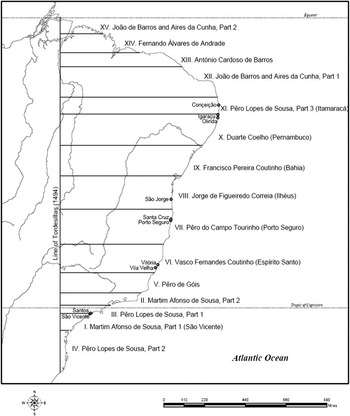
FIGURE 1 CAPTAINCIES AND SETTLEMENTS OF BRAZIL CA. 1545
Notes: The 12 «donatory captains» are listed to the right of their respective grants and the names of the captaincies, when applicable, are in parentheses; there are fifteen lots shown, corresponding to fourteen captaincies, and the primary settlements are indicated with their names to the left.
The impact of colonisation on indigenous societies remains unclear (Cunha Reference Cunha1992). Amerindians were among Portugal's first exports from Brazil, but slavery was limited until the spread of European settlement oriented to agriculture and ranching (Petrone Reference Petrone1995); instead of relying on trade, the agro-pastoral economy became organised upon «the direct appropriation of indigenous labor, above all in the form of slavery» (Monteiro Reference Monteiro1994, p. 33).
São Vicente was the starting point for the colonisation of the interior. The region encompassing the city of São Paulo — the Campos de Piratininga — was a major pre-historical population centre; from there proceeded expeditions into what would become Mato Grosso, Goiás and Minas Gerais (Petrone Reference Petrone1995). The colonial strategy applied during the 16th century involved the relocation of Natives from their original aldeias (villages) to new ones, proximate to European settlements, administered by the Jesuits. In these aldeamentos, the Jesuits converted Natives and allocated their labour according to the needs of settlers (Perrone-Moisés Reference Perrone-Moisés1992).
The indigenous population was considered in terms of two broad ethnic groups: the coastal, relatively homogenous Tupi and the interior, more heterogeneous Tapuia (Monteiro Reference Monteiro1994). The shock of European contact — with its concomitant warfare, disease, enslavement, and displacement — created a cascade of social changes with terrible demographic effects. In turn, Monteiro explains, the first major law limiting Native enslavement was enacted in 1570.
The legal status of Brazil's indigenous peoples was ambiguous and often disregarded in practice (Perrone-Moisés Reference Perrone-Moisés1992; Petrone Reference Petrone1995). In general, one category of legislation applied to Natives in the Jesuit villages (or allies) and another to enemies: the former were technically free but catechised and obliged to work for settlers, the latter could be enslaved (Perrone-Moisés Reference Perrone-Moisés1992). In effect, Natives within the settlements were uniformly subject to some form of coercion — ultimately, a necessary factor for the success of the colonial enterprise (Monteiro Reference Monteiro1994).
2.2 16th-century population
Extant statistics
Population data for the 16th century are sparse. In 1550, records suggest at most 3-4,000 European settlers across all captaincies (Marcílio Reference Marcílio1984), with about 600 Europeans in São Vicente in 1548 and 300 that settled in Bahia in 1549Footnote 4. In São Vicente, there were also 3,000 slaves; other sources cite roughly 400 African slaves in Ilhéus and 500 in São Vicente ca. 1545Footnote 5. Gândavo (1965 [Reference Gândavo1576]) gives numbers of European households in Brazil ca. 1570 which, adopting the convention of six persons per household, suggests that 21,000 Europeans lived there at this timeFootnote 6. The Native population overseen by the Jesuits in Bahia, Espírito Santo and São Vicente was a combined 38,000, with 34,000 in Bahia (Marchant Reference Marchant1942). In total, several thousand Africans were employed on the sugar plantations (Marcílio Reference Marcílio1984).
For the period ca. 1585, there are three overlapping sources of data: Fernão Cardim (1583), Joseph de Anchieta (Reference Anchieta1585), and Gabriel Soares de Sousa (1587). Their estimates suggest that the total European population of Brazil was about 30,000. Excluding three captaincies for which no data are available, the Native population in those European areas was nearly 18,000; in just three captaincies with data, the African population was almost 10,000. The population figures, by captaincy and race, for the periods around 1570 and 1585 are shown in Table 1 (the 1545 data are too few to repeat here), ordered from north to south.
TABLE 1 THE POPULATION OF «BRAZIL» DURING THE LATE 16TH CENTURY

Sources: 1Marchant (1942), based on parish registers in the Cartas Avulsas and the writings of Joseph de Anchieta.
2Gândavo, Tratado da Provincia do Brazil (1576), based on six persons per household.
3Range of Anchieta (Cartas, Informações, Fragmentos Historicos e Sermões, 1585), Cardim (Narrativa Epístolar de uma Viagem e Missão Jesuítica, 1583), and Soares de Sousa (Tratado Descritivo do Brasil, 1587).
The three population categories should not be interpreted literallyFootnote 7. Factors specific to each period are considered separately, but each racial category is generally construed as follows: (1) the «Native» population includes all aboriginals within the Portuguese domain, whether subjected to forced labour or incorporated into the society of Europeans; (2) the «European» population includes those specifically from Europe in addition to the free population of mainly European descent; and (3) the «African» population includes natural Africans as well as people of mixed African-European/Indian lineage classified as Mulattos by contemporaries.
Around 1545, indigenous peoples outnumbered Europeans and Africans (there may have been as many Natives in São Vicente alone as Europeans across all eight captaincies). Table 1 shows that the majority was still indigenous in 1570, even though the São Vicente figure appears low. There were probably several thousand Africans at this time and by 1585, perhaps 15,000. A smallpox epidemic devastated the Native population of Bahia during the 1560s and 1570s (Marchant Reference Marchant1942), potentially making Europeans a (brief) majority in the settlements as of 1585.
Production-based estimates
Limited data from colonial records on Native and African populations can be supplemented by estimates based on the output of sugar. The productivity of the existing technology, combined with information on the number of engenhos (sugar mills or plantations), provides an estimate of the number of workers. I briefly describe the production process and present data on the number of plantations and projected workforce.
Harvestable sugarcane takes fifteen to eighteen months to grow, with a second harvest possible after another nine months; the cane is cut by gangs and the juice is expressed, after which it is boiled, purged, and dried in pots to create sugar (Schwartz Reference Schwartz1987). A large plantation may have employed from 120 to 160 slaves in the field, forty slaves during the milling process, and twenty Europeans (Blume Reference Blume1985). Contemporary sources indicate that the average 16th-century plantation employed about eighty slaves and produced 3,000 arrobas (43 tonnes) of sugar per yearFootnote 8.
Even if sufficient free workers had been available (at the time Portugal's low population did not encourage emigration), slaves would still have been preferred: they were more reliable because of their lack of freedom; more efficient because they could be overworked during key times in the agricultural cycle; and no more costly than free labourers (Bergad Reference Bergad2007). Between 1870 and 1881, Carvalho de Mello (Reference Mello1977) estimates that the three-year average return on prime male field slaves in the coffee sector ranged from 11.5 per cent to 15 per cent, at least as great as that of other capital assets. The average rate of return on investment in slaves was relatively high, and the purchase price of a slave could be recovered in a few years (Slenes Reference Slenes1975; Schwartz Reference Schwartz1985).
The extent to which the number of slaves on the sugar plantations corresponds to the overall African or Native population depends on the relative importance of sugar in the economy. It was the major product during the 16th and 17th centuries, comprising over 70 per cent of output (Goulart Reference Goulart1975). The settlements were chiefly oriented towards sugar production — the number of plantations and extant technologies suggest the size of the enslaved population (but may underestimate it, depending on the prevalence of slaves in other sectors).
Data on the number of sugar plantations in each captaincy for the period ca. 1545 come from contemporary documents cited by Johnson (Reference Johnson1987); and for the periods ca. 1570 and 1585, from Gândavo (1576), Soares de Sousa (1587), Cardim (1583) and Anchieta (Reference Anchieta1585). Based on these and other sources (see footnote 8), I assume that there were eighty slaves per plantation — the average number recorded by contemporaries, which corresponds to a medium-sized plantation. The number of plantations and associated slave labour force are presented in Table 2.
TABLE 2 SUGAR PLANTATIONS AND 16TH CENTURY SLAVE WORKFORCE

Sources: 1Johnson (1987, pp. 31-34).
2Gândavo, Tratado da Província do Brasil (1576).
3Anchieta, Informação da Província do Brasil para nosso Padre (1585).
4Soares de Sousa, Tratado Descritivo do Brasil em (1587).
5Cardim, Narrativa Epístolar de uma Viagem e Missão Jesuítica (1583).
Notes: *Ilhéus did produce sugar at this time; the number of plantations is unknown, but was likely from two to four (Varnhagen Reference Varnhagen1956).
Sugar production became concentrated in the captaincies of Pernambuco and Bahia, where 8,960 slaves may have laboured in 1585. To the south, in Porto Seguro and Espírito Santo, there was ongoing warfare with the Aimoré and some villages, with their plantations, were destroyed (Varnhagen Reference Varnhagen1956). Slave imports provide another way of checking the reliability of the African population figures cited by contemporaries.
According to Goulart (Reference Goulart1975): African slaves were first imported to Brazil between 1516 and 1526 by Pero Capico or Martim Afonso, who were among the first to establish sugar plantations. There were petitions for slaves during the 1540s and 1550s, yet few references to Africans actually in BrazilFootnote 9. In 1559, each plantation owner was allowed to import up to 120 «Congo» slaves — registers of only four such shipments are in the TASTD. The letter of Domingos d'Abreu de Brito to Felipe II reports that 52,053 slave «pieces» left Angola for Brazil from 1575 to 1591; of these, only a fraction were probably destined for the Portuguese coloniesFootnote 10.
There were 138 sugar plantations ca. 1585, so over 16,000 African slaves could have been imported, a figure Goulart (Reference Goulart1975) reaches based on ∼80,000 slaves shipped from Angola, with one-fifth destined for Brazil. The pace of imports would not have declined during the 1590s because sugar production was expanding (Schwartz Reference Schwartz1985). The volume of the African slave trade to Brazil was likely under 1,000 before 1545; 2,000 between 1545 and 1570; and at least 16,000 from 1570 to 1590, with another 10,000 during the following decade. In all, about 30,000 African slaves were brought to Brazil during the 16th century — a figure consistent with 32,000 from TASTD, but below the 50,000 adopted by Curtin (Reference Curtin1969) and Eltis (Reference Eltis2001).
Projections
The production and slave-import figures suggest the number of slaves in the colonies; however, it is unclear how many aboriginals were living in the settlements at this time. The pre-contact population of what is today Brazil may have been from one (Rosenblat Reference Rosenblat1954) to over five million (Denevan 1976; in Newson Reference Newson2006). Steward (Reference Steward1946) — who combines data on population densities of existing un-acculturated groups and applies these to similar once-occupied areas — arrives at a figure of 1.7 million, revised to 2.5 million by Hemming (Reference Hemming1978). For the South American low-lands, Cunha (Reference Cunha1992) cites these and other authors (including Sapper 1924; Kroeber 1939; Dobyns 1966) in proposing a range of from 1 to 8.5 million inhabitants.
I base my projections upon Steward's map of indigenous population densities (per 100 km2). Although his figures are conservative, they are close to Hemming's (except for areas settled later in the colonial period) and include spatial information. I digitise Steward's map and transform it to obtain the density per square-kilometer. I consider the Portuguese domain as described by Hemming (Reference Hemming1978), who shows the frontier as it existed in 1600, 1700 and 1760, assuming that the frontier expanded linearlyFootnote 11. I overlay and intersect three maps — the initial population, areas settled by Europeans over time, and state borders — and export the Native headcountsFootnote 12.
The initial Native population and that population decades or centuries later depends on many factors, including its natural rate of growth, any transitory shocks and inward or outward migration. Ethnographic and archaeological evidence present somewhat conflictive accounts of indigenous prehistory (Roosevelt Reference Roosevelt1992); unfortunately, only fragmentary evidence is available on the upheavals caused in indigenous societies following the arrival of Europeans.
In his study of the Americas, Rosenblat (Reference Rosenblat1954) concludes that by 1570 Brazil's Native population was only 80 per cent of its size in 1492; 70 per cent by 1650; 36 per cent by 1825; 20 per cent by 1940; and 20 per cent by 1950. This corresponds to an average annual population growth rate of −0.37 per cent. Rather than speculate on the extent of population shocks or migration, I adopt this rate of decline and project the Native population of settled areas in each state-year using the pre-contact population data above, producing figures that are surprisingly close to those recorded by contemporaries.
Discussion and consolidated figures
How do coerced-workforce estimates from sugar production, African slave imports and the initial Native population compare with the accounts of early observers? In 1545, between Bahia and Ilhéus there were from four to six plantations, likely operating with 320 to 480 slaves — the one contemporary figure of 400 African slaves for Ilhéus falls in the middle of this range. In São Vicente, there were six engenhos and potentially 480 slaves — the estimated African population of 500 is also feasible. The total number of slaves required to work the seventeen plantations ca. 1545 was 1,520 compared with the 1,000 supposedly imported by that time. The plantation labour force was mainly African. For the Native population, the contemporary indication of 2,500-3,000 in São Vicente compares to my rounded projection of 2,100.
There are no statistics for the African population of 1570, but Marcílio (Reference Marcílio1984) holds that there were a few thousand Africans in the captaincies. As there were sixty-two plantations, there must have been around 5,000 slaves; the evidence on slave imports suggests that no more than 2,000 Africans lived in the settlements. A range of 2-5,000 African slaves in Brazil ca. 1570 is most likely. Anchieta's records of the Native population were 34,000 in Bahia, 1,000 in São Vicente, and 1,500-3,000 in Espírito Santo, compared with my projections of 7,800, 3,000 and 800.
Based on Cardim, Anchieta and Soares de Sousa, anywhere from 2 to 10,000 Africans (5,665 average) were in Pernambuco and 3-4,000 in Bahia (3,665 average) by 1585; an alternate source cites 500 African slaves in Ilhéus. Given the extent of sugar production in these captaincies, roughly 5,280 slaves were needed in Pernambuco, 3,680 in Bahia, and 480 in Ilhéus. The Native population accounted for by the Jesuits compares to my projections, respectively: in Pernambuco — 2,000 vs. 7,800; in Bahia — 6/8,000 vs. 8,900; in Espírito Santo — 4,500 vs. 900; in Rio de Janeiro — 3,000 vs. 1,200; and, in São Vicente — 1,000 vs. 3,400.
The plantation-based estimates are consistent with chroniclers’ observations and constitute our best knowledge of the distribution of African slaves across captaincies when demographic data are lacking. The Native projections capture spatial and temporal trends in population size which, although they vary widely, on-average coincide with the Jesuits’ records. In Table 3, I consolidate the above data, taking the observed figures when available and adding in the workforce estimates of the African, and projections of the Native, population.
TABLE 3 CONSOLIDATED POPULATION OF «BRAZIL» BY RACE AND CAPTAINCY (CA. 1545, 1570 AND 1585)

Sources: 1Figures from 16th-century documents, averaged when multiple sources available.
2Estimated African population based on the number of sugar plantations.
3Projected Native headcount from initial population, areas settled and annual growth rate of −0.37%.
4Marcílio (Reference Marcílio1984).
Table 3 presents a more-complete account of Brazil's earliest populations. This is particularly so for 1545, when there may have been 18,700 Natives living in the settlements whereas only a few thousand are cited in contemporary documents. In 1545 and 1570, the settlements’ Native population greatly outnumbered the European; however, the European may have eclipsed the Native, albeit temporarily, in 1585. The African slave population increased at average annual rates of 4 per cent and 6 per cent, more than doubling in-between periods.
2.3 17th-century population
Extant statistics
During the 17th century, the Portuguese battled the Dutch and French: they united their possessions in Itamaracá and Paraíba and settled the northern captaincies of Maranhão and Pará but lost control of Pernambuco for over two decades (Marcílio Reference Marcílio1984). The Native governance system broke down as colonists intensified their slave raiding in the interior (Monteiro Reference Monteiro1994); once in the tens of thousands, the Jesuit villages suffered a sangria demográfica (Petrone Reference Petrone1995, p. 243). Due to the unavailability of data, I centre my analysis on two periods — 1625 and 1675 — for which modest coverage is available, using the same methods as for the 16th century.
Contemporary sources describe the European population for most captaincies around 1625. The primary reference is Freyre (Reference Freyre1675), whose observations span the period from 1624 to 1638; observations for Ilhéus and Porto Seguro are from Moreno (Reference Moreno1612); and, figures for Pará and São Paulo are from Schwartz (Reference Schwartz1987) and Hemming (Reference Hemming1987). Together, these data suggest that there were over 98,000 Europeans across eleven captaincies in 1625. Schwartz claims that there were also 40,000 Natives across the plantations in São Paulo (São Vicente); others describe as many being evangelised in the north. No figures are available for the African population.
For 1675, de Mongelos describes the European and Native population of São Vicente (in Metcalf Reference Metcalf1992). Perreira de Berredo (1718) and Viera (1660) describe those of Pará and Maranhão (see Boxer Reference Boxer1962; Hemming Reference Hemming1978; Schwartz Reference Schwartz1987); as do Heriarte (1662) and Souto-Maior (1658), in Varnhagen (Reference Varnhagen1956), and the Jesuit documents compiled by Leite (Reference Leite1938). The combined statistics for the 17th century from these sources are presented in Table 4.
TABLE 4 THE POPULATION OF «BRAZIL» DURING THE 17TH CENTURY

Sources: 1European population is from Freyre (1675), História da Guerra Brasílica, based on six persons per household; figures for Pará and São Vicente are from Schwartz (Reference Schwartz1987) and Hemming (Reference Hemming1987); those for Ilhéus and Porto Seguro are from Moreno (1612), Livro que Dá Rezão do Estado do Brasil.
2Data for São Vicente are from de Mongelos (in Metcalf, Reference Metcalf1992); for Pára, Maranhão, and Bahia from Anais Historicos (Perreira de Berredo), Regulamento das Aldeias (Viera) and Suma Histórica (Leite).
The European population rose noticeably by 1625, and thousands of Natives were incorporated into settlements in Pará-Maranhão and São Vicente; however, demographic data are very limited for both periods because of the ongoing war. I again use the numbers of sugar plantations and corresponding workforces to both evaluate and complement this information.
Production-based estimates
Although the average number of slaves employed on each engenho, or plantation, does not appear to have changed from the previous century, the technology did: the three-roller vertical mill caused an expansion in the output of sugar (Schwartz Reference Schwartz1985). Based on available figures for the early 17th century, average sugar production per plantation increased to about 4,000 arrobas (57 tonnes) a year, a one-third rise in worker productivityFootnote 13.
There are two sources of information on the number of plantations operating in Brazil ca. 1625: Cadena (1629) and Freyre (Reference Freyre1675). Cadena gives a total of 245 engenhos and Freyre, 346; however, Cadena omits Rio de Janeiro (which had 60+ plantations) making both sets of figures comparable. There are no other reports until 1711: Antonil's Cultura e Opulência do Brasil indicates 528 plantations across Pernambuco, Bahia and Rio de Janeiro alone. It is possible that there were around 450 in Brazil ca. 1675, but it is difficult to discern. Table 5 presents the average numbers of plantations of Cadena and Freyre and resultant slave workforces.
TABLE 5 SUGAR PLANTATIONS AND SLAVE WORKFORCE CA. 1625

Sources: The number of plantations is the average of Cadena (1629), Descripción de la Provincia del Brasil, and Freyre (1675), História da Guerra Brasílica.
Notes: *The workforce is based on an average of 80 slaves per plantation.
Projections
The volume of slaves brought from Africa to Brazil increased manifold during the 17th century, but documentation has survived for few voyagesFootnote 14. Although the TASTD provides its own annual estimates of African slave imports based on inferred data coverage, I take an uninformed approach and create new time-series estimates of annual imports using only recorded voyages and their purported cargoes. This ignores useful contextual information on the completeness of bookkeeping over time but involves fewer assumptions.
I apply an exponential smoothing mechanism to the annual slave import totals across the voyages logged in TASTD, which provides figures for one-half of the years from 1574 to 1856. The sum of the resulting annual slave import estimates is below the volume believed to have arrived in Brazil (2.14 vs. 3.5-5.5 million); however, the recorded volume was probably only half the total trade (Goulart Reference Goulart1975), a scenario consistent with the consensus of four million. To benchmark the African population, I assume that half of slave voyages were documented.
With data on the annual flow of slaves into the settlements, I calculate a reference African headcount for each period based on hypothesised natural rates of population growth. Slave mortality was not constant over the course of the traffic; neither was the share of the Afro-Brazilian population that was enslaved. Free peoples had a longer life expectancy because of high mortality among newly arrived slaves and the abuses of forced labour; they also experienced higher rates of natural growth because the population's age-sex structure was more balanced.
Slaves’ lives were «unnaturally short», writes Conrad (Reference Conrad1986). Contemporary estimates of the working life of a slave in the mines range from seven to twelve years (Russell-Wood Reference Russell-Wood1987), and the mortality rate on a sugarcane plantation was estimated by planters at 5-10 per cent annually (Schwartz Reference Schwartz1987). Conrad cites a British report from 1843 that states that, in the best case, mortality in the first year of arrival was at least 8 per cent, and 6 per cent the following year.
Carvalho de Mello (Reference Mello1977) describes the estimates of contemporaries as unreliable, however, and uses the 1872 national census data for free and slave, African and Mulatto, to estimate upper and lower bounds for the life expectancy of slaves. Specifically, he employs the population age distribution (stable population theory) and adjusts for the influence of imports to arrive at an estimated life expectancy at birth of eighteen to twenty-three years for a male slave. This roughly corresponds to a crude death rate of between 4 per cent and 6 per cent a year.
A major impediment to the ability of the slave population to maintain itself was the high male-to-female ratio and correspondingly low number of births. Merrick and Graham (Reference Merrick and Graham1979) report that in Minas Gerais in 1786, the male-to-female ratio among «Africans» (negros) was 2.25 to 1 but among Mulattos (pardos), many of whom were free, it was just 0.94 to 1. In the decades since their work was published, a host of new evidence has emerged which clarifies regional trends in the age-and-sex distribution of Brazil's free and slave populations.
Luna (Reference Luna1980) describes the slave demographics of some localities in Minas Gerais for separate periods between 1718 and 1804: in Vila de Pitangui, the average male-to-female ratio between 1718 and 1723 was 5.4 to 1; in Serro do Frio in 1738, it was 5.1 to 1; in Freguesia de Congonhas do Sabará in 1771, it was 2.7 to 1; and in Distrito de S. Caetano and Vila Rica, the average was just 1.4 to 1 in 1804. Each region was not uniform, but such differences do not arise from spatial heterogeneity alone: note how the share of native-born slaves ranged from 16.7 per cent in Pitangui between 1718 and 1723 to 59.4 per cent across S. Caetano and Vila Rica in 1804.
Other studies include Libby and Paiva (Reference Libby and Paiva2000), which employs ecclesiastical records of the Freguesia de São Jose to trace the characteristics of slave, free and manumitted groups in 1795 Minas Gerais. Native-born slaves were found to have a wide-based and symmetrical population pyramid, indicating a balanced sex ratio and natural reproduction. With unpublished censuses for Minas Gerais and São Paulo ca. 1830, Klein and Luna (Reference Klein and Luna2004) also reveal that the mining zone of Minas had a relatively high child-to-woman ratio. In his study of Constituição (Piracicaba), Motta (Reference Motta2006) calculates that the male-to-female ratio of the slave population was 1.8 to 1 in 1854, 1.3 to 1 in 1874 and 1.4 to 1 in 1886, compared with statistics for the overall free population of 0.9 to 1, 1.0 to 1 and 0.9 to 1, respectively.
Manumission rates increased over time, and the free African or Mulatto population expanded relative to the slave, even as slave imports accelerated. Schwartz (Reference Schwartz1974) examines 1,015 «letters of freedom» registered in Salvador, Bahia, between 1684 and 1745: across this sample, the ratio of female-to-male manumitted slaves was 2 to 1, and Mulattos were far over-represented relative to their share of the slave population. In their study, Libby and Paiva (Reference Libby and Paiva2000) also observe that manumission was most common among female adult slaves.
Although slave populations exhibited higher mortality and lower fertility, their natural growth was not always negative: in late 18th-century Minas Gerais, for instance, many slaves were native-born, resulting in a relatively equal sex distribution and positive natural growth (Klein and Luna Reference Klein and Luna2004); such was also the case in Paraná earlier that century (Gutiérrez Reference Gutiérrez1987). Nonetheless, this was more typical of the free population; during the 16th and 17th centuries, most people of African descent were slaves and suffered high mortality in the mines and plantations (Klein and Luna 2010). Even by 1872, slaves made up 26 per cent of all Africans/Mulattos, and their life expectancy was nearly ten years below average (Merrick and Graham Reference Merrick and Graham1979).
Martins Filho and Martins (Reference Martins Filho and Martins1983) attribute the rapid increase of the slave population in Minas Gerais from 1808 to 1872 to slave imports, not natural growth. The analysis considers rates of natural increase for the slave population of −2 per cent or less — a magnitude they support with reference to Goulart, who estimates rates of −3 per cent and −4 per cent for the periods 1717-1723 and 1723-1735, and Eschwege, who calculates −2.2 per cent and −3.9 per cent for Mulatto and African slaves in 1820.
The sex-and-age distribution of the interior slave population became more equal over time, opening the possibility for positive natural rates of increase by the 19th century; however, this high fertility may not have been able to fully offset the elevated mortality of a mostly male slave population (Klein and Luna Reference Klein and Luna2004). During the 16th century, when almost all Africans in Brazil were slaves, a conservative rate of natural increase would be −5 per cent; in the 17th century, conditions may have marginally improved to about −4 per cent; in the 18th century, the rate of decline was probably closer to 2 per cent; and, in the 19th century, the combined free/slave African or Mulatto rate of growth was near-zero (Merrick and Graham Reference Merrick and Graham1979).
I use these growth rates, starting values from the text, and annual imports to calculate a benchmark African population for each region across the ten periods of studyFootnote 15. This approach recognises the rising numbers of manumitted and native-born slaves, mostly women, whose fertility gradually permitted the population of African descent to stabilise within the context of persistently high mortality. For the 17th century, I obtain the following figures — Bahia: 6,200 «Africans» as of 1625 and 25,400 in 1675; and Pernambuco: 9,100 in 1625 and 43,700 in 1675.
Discussion and consolidated figures
During the 17th century the Portuguese pushed the frontier westward, settling large portions of South America, including the north coast and lower Amazon. In the São Paulo area, slave-hunting activity peaked and non-captive Natives disappeared from the region (Hemming Reference Hemming1987). My projections for 1625 show that the Native population numbers may be exaggerated (40,000 in Maranhão and São Vicente vs. estimates of 5,600 and 11,400); however, they cannot be dismissed because slaves were often captured at a distance and brought into the settlements. For 1675, these two sets of figures are closer: compare the observed 25,000 Natives in Pará with 32,600 projected; as many in Maranhão against 13,900; and, 20,050 in São Vicente with 22,500.
Similarly, the estimated African population is relatively close to available first-hand observations: for 1625, the 5,000 Africans cited in Pernambuco compare with 10,840 based on sugar production or 9,100 using slave imports; for 1675, the 25,000 observed in Bahia compare with a projection of 25,400 using slave trade data; notably, for Bahia in 1625, the slave-trade- and production-based estimates exactly coincide. I present a fuller portrait of Brazil's population in Table 6 by combining the «observed» and estimated population statistics.
TABLE 6 CONSOLIDATED POPULATION OF «BRAZIL» BY RACE (CA. 1625, 1675)

Sources: 1Figures obtained from 17th-century documents, averaged when multiple sources available.
2Estimated African population based on the number of sugar plantations recorded by contemporaries.
3Unless otherwise indicated, projected Native headcount based on initial population, areas settled, and annual growth rate of −0.37%.
4Projected African headcount based on estimated slave imports from Trans-Atlantic Slave Trade Database and negative 4% annual population growth rate.
In the 17th century, the racial composition of Luso-Brazil was not hugely different than it was 100 years earlier — Natives generally outnumbered Europeans, who surpassed Africans — yet it was more even. With the exception of the north and south (where Natives prevailed) and the traditional northeast sugar zone (where Africans were a majority), the indigenous population of the settlements was flat compared with the rapid increase of European and African populations.
3 THE GOLD ERA
Gold was discovered during the late 17th century by the bandeirantes during their expeditions and a «gold-rush of epic proportions» began with the discovery of Ouro Prêto in 1701 (Hemming Reference Hemming1978). Gold production would dominate the new interior captaincies of Minas Gerais, Mato Grosso and Goiás during the next 50 years (Russell-Wood Reference Russell-Wood1987). The gold boom led to the enslavement or flight of local Natives, the stepping up of African slave imports and the immigration of thousands of Europeans in search of fortune.
3.1 Extant statistics
I describe the racial composition of the captaincies for two periods, centred on 1725 and 1775. Population statistics for Pará and Maranhão are from Jesuit documents in Leite (Reference Leite1938) and a letter from the Governor of Maranhão-Pará to the Secretary of State to the King (ca. 1755). Figures for Minas Gerais and Mato Grosso are based on Antonil (Reference Antonil1711) and slave matriculations in Codice Costa Matoso (Boxer Reference Boxer1962, pp. 181-187). For Rio de Janeiro and São Paulo, I refer to a letter of the Archbishop of Bahia (1702).
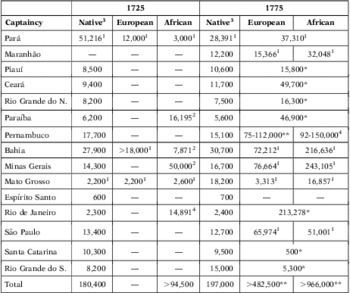
All data for 1775 are from regional census and parish records as compiled by Alden (Reference Alden1963). The combined figures for both periods are presented in Table 7. There is a lack of information for the period ca. 1725, yet it appears that the Native population of the north had not diminished from its 1675 level and a large African contingent centred in Minas Gerais. Towards the end of the century, there was a concerted effort to gauge the overall population yet, Alden explains, it was at the discretion of the provincial governors whether or not to collect racial information.
TABLE 7 THE POPULATION OF «BRAZIL» DURING THE 18TH CENTURY

Sources: 1Jesuit documents in Suma Histórica (Leite, Reference Leite1938-1950), Letter of Governor Mendonça Furtado to Pombal, Cultura e Opulencia do Brasil (Antonil 1711), Codice Costa Matoso, and Letter of Archbishop of Bahia to Crown.
2Alden (Reference Alden1963), «The Population of Brazil in the Late 18th Century: A Preliminary Study».
Notes: *São Paulo was now recognized as a separate province spanning former areas in São Vicente.
**The census category «Mulatto» is included in the «African» population to allow for comparison with earlier figures.
3.2 Production-based estimates
In the interior captaincies, gold lured settlers and created a demand for slaves. Most gold was produced from placer mining (rocking river sediment in a pan) with low capital investment; eventually hydraulic pumps were adopted to work the hillsides or riverbeds and sluice boxes came into use (Russell-Wood Reference Russell-Wood1987). As the century progressed, yields diminished notably: productivity ranged from as much as 100s of drams (1 dr = 1/8 oz) of gold a year to as few as twenty by 1780 (Coelho; in Boxer Reference Boxer1962).
As with sugar, gold production had large demographic effects. I calculate average gold output by decade for Minas Gerais based on Noya Pinto (1979), as reprinted in Alden (Reference Alden1984). Supposing that available population figures are correct: there were about 30,000 African slaves in Minas Gerais in the 1710s (Russell-Wood Reference Russell-Wood1987); an average 98,730 and 93,328 registered slaves in the 1730s and 1740s (Codice Costa Matoso; in Boxer Reference Boxer1962); and an African/Mulatto population of 243,000 in the 1770s, and 369,000 in the 1790s (Alden Reference Alden1963). It follows that average annual gold production per person was ∼111 dr in the 1710s, 47 and 54 dr for the 1730s and 1740s, 12 dr during the 1770s, and 5 dr in the 1790sFootnote 16.
These per-capita estimates are congruent with those of Boxer, Coelho, and Russell-Wood (27-81 dr p.p. in 1720s/1730s; ∼20 dr in 1780s), and Goulart (36-41 dr p.p. from 1735 to 1760). Since the downward trend in production per capita was steady, a fair estimate of the African slave population of Minas Gerais in intermediate years is possible. In the 1720s, for instance, 3.7 million drams of gold were produced (14,500 kg); imputed output per capita — based on adjacent decades’ productivity and contemporary figures — was near 80 dr; the African slave population may therefore have been around 47,000.
For the coastal captaincies, the value of sugar produced continued to exceed that of gold; however, there were some industrial changes which must be accounted for. Schwartz (Reference Schwartz1987) writes that the average size and productivity of sugar plantations declined from the late 17th into the 18th century. His figures indicate that average output per engenho was only 2,265 arrobas (one arroba = 14.4 kg) for the 18th century, compared with nearly 4,000 previously. Stein (Reference Stein1985) argues that smaller plantations were less productive because of soil degradation, meaning fewer slaves producing less sugar: perhaps only 40 arrobas per worker compared with 50 the previous century. Building on these assumptions, I estimate the slave workforce based on the level of productivity and either the number of plantations or total output.
In 1725, 2.5 million arrobas of sugar were produced in Brazil (Burlamaqui Reference Burlamaqui1862) with a slave labour force of 62,500 based on 40 arrobas per worker. At the time, there were 139 engenhos in Bahia (Schwartz Reference Schwartz1985), corresponding to almost 8,000 slavesFootnote 17. Alden (Reference Alden1984) cites 286 plantations in Pernambuco-Paraíba; by my calculation, there would have been over 16,000 slaves. In 1775, only 1.4 million arrobas of sugar were produced across Brazil (Burlamaqui), with 35,000 slaves possibly employed. Alden reports at least 170 engenhos in Bahia, 390 in Paraíba-Pernambuco, and 104 in Rio de Janeiro — 9,600, 22,000 and 5,900 ensuing slaves.
3.3 Discussion and consolidated figures
The inward expansion of the Brazilian domain had important implications for Native and African populations: as gold production rose, Natives were enslaved or displaced and the volume of the African trade grew. During the 18th century, there are registered slave shipments for over half of all years — a total of 1,755 voyages. According to TASTD estimates, 2.2 million African slaves were imported; my benchmark, assuming half of voyages were recorded, is 1.1 million.
How do contemporaries’ figures and regional census data for 1725 compare with my output, slave trade, and initial-density-based estimates of African and Native populations? For Pará-Maranhão, slave import records indicate an African population of 5,685 compared with 2-3,000 «observed»; the Native projection is 61,500 against 51,216 observed. For Minas Gerais, an estimated 50,000 African slaves were in the gold sector contrasted with supposedly 30,000 ten years earlier. Finally, the projected Native population of 7,600 in Mato Grosso is weighed against 2,600 observed.
For 1775, I estimate 76,000 Natives for Pará but fewer than 30,000 are recorded by contemporaries; slave voyage registers suggest up to 50,000 people of African descent in Pará-Maranhão compared with 34,000 observed. Gold output in Minas Gerais implies 150-250,000 «Africans» against the 243,105 Africans/Mulattos of the census; the combined projection of 476,600 in Bahia, Minas Gerais and Mato Grosso compares with a recorded 280,300. Finally, my estimate of 18,200 Natives in Mato Grosso compares to only 797, and 30,300 Africans in São Paulo compares to 51,001, in the census.
I add my estimates to the historical statistics, for years when these are lacking, and obtain the collected figures presented in Table 8. While contemporary documents describe Native or African headcounts in only two-to-three provinces, one may conclude there were at least 180,000 Natives and over 100-150,000 people of African descent across Brazil in 1725. With the exception of Minas Gerais, the Native population continued to exceed the African. By 1775, however, the African or Mulatto population rose to nearly 1 million (still notably fewer than the cumulative number of slaves imported thus far) and, for the first time, Natives were a clear minority.
TABLE 8 CONSOLIDATED POPULATION OF «BRAZIL» BY RACE (CA. 1725, 1775)
Sources: 1Figures obtained from 18th-century documents or corroborated secondary sources.
2Estimated «African» population based on the number of sugar plantations or gold output.
3Unless noted otherwise, Native projections based on initial population, areas settled, and annual growth rate of −0.37%.
4Projected «African» headcount from slave imports in Trans-Atlantic Slave Trade Database and −2% annual natural rate of increase.
Notes: *Difference between the total population (in Alden Reference Alden1963) and projected Native population.
**Absent other information for individual provinces, total presumes a 2:1 African-to-European split.
4 THE COFFEE ERA
At the beginning of the 19th century, the colonial era was ending and the economy became increasingly diversified into other staples — notably coffee, but also tobacco, cacao, cotton and rice (Alden Reference Alden1984). French troops invaded Portugal in 1807 and the royal court took refuge in Rio de Janeiro; in 1822, after the King had returned to Europe, his son Pedro I declared himself Emperor of an independent Brazil (Merrick and Graham Reference Merrick and Graham1979).
The international slave trade was forcibly halted by the British in 1850 (Goulart Reference Goulart1975), but the internal trade was thriving and would not be abolished until 1888 (Bethell Reference Bethell1970). There is no recorded Italian or Spanish immigration, only Portuguese, in the first half of the century (Instituto Brasileiro de Geografia e Estadística (IBGE). The population of Brazil, by state and race, will be examined for three additional periods — 1800, 1825 and 1850 — during the pre-statistical era.
4.1 Extant statistics
The main contemporary data sources are: a letter from Lord Strangford to Marquis of Wellesley dated May 20, 1810 (in Alden Reference Alden1984); Paraíba, Mapa de População, 1798 (Marcílio Reference Marcílio1984); and Souza e Silva, População Geral do Império, documents in the Arquivo Nacional de Rio de Janeiro and IHGB/CU, and Octávio Ianni, Metamorfoses (in Klein and Luna 2010)Footnote 18. The compiled census figures from these sources are presented in Table 9.
TABLE 9 THE POPULATION OF «BRAZIL» DURING THE EARLY-TO-MID 19TH CENTURY

Sources: 1Alden (Reference Alden1984), «Late Colonial Brazil, 1750-1808»; ratio of free-to-slave Africans in Pará may have been 1.3 to 1, as in other areas — Alden points to 18,400 African slaves in Pará, so there might be 23,920 free «Africans» or 42,320 of African descent; Hemming (Reference Hemming1978) implies that the ratio of Africans-to-Europeans in Pará was 2:1, or 21,160 Europeans; Marcílio (Reference Marcílio1984) cites the AHU (Paraíba, Mapa de População, sheaf 20, doc. 38) 1798 census figures; for Paraíba (IHGB/CU, Arq. 1-1-13, fols. 148v-149), and Paraná, Santa Catarina, Rio Grande do Norte and Espírito Santo (Souza e Silva 1870), observations in Klein and Luna (2010).
2Souza e Silva, População Geral do Império (1870); ANJR, cod. 808, I (fols. 35, 96) and III (fols. 38, 39, 93); in Klein and Luna.
3Souza de Silva (1870), Ianni (Metamorfoses, 1962), and the National Archives of Rio de Janeiro (ANJR, cod. 808, III, fol. 86); also in Klein and Luna.
Between 1775 and 1800, the Native population declined while the populations of European and African descent increased (to roughly 5 per cent «Native», 30 per cent «European» and 65 per cent «African or Mulatto»). Overall, the population grew by over 40 per cent and 60 per cent in the quarter-centuries preceding 1825 and 1850. For these periods, the racial distribution is unclear so the column totals in Table 9 are only lower bounds. Available data suggest, however, that Africans and Mulattos continued to form a majority. Less new land was settled, so fewer Natives were incorporated into Brazilian society, and their population growth centred in the southeast.
4.2 Production-based estimates
If the 16th and 17th centuries were those of sugar, and the 18th that of gold, then the 19th belonged to coffee. The first plantations were established during the mid-18th century in São Paulo and production spread to Rio de Janeiro, Minas Gerais and Espírito Santo (Filho Reference Filho1952). Coffee production burgeoned in the 1790s, becoming the country's most valuable export by the 1830s (Bethell and Carvalho Reference Bethell and Carvalho1989).
Cultivating coffee was very labour-intensive. Slaves were used to plant and tend trees (thousands per person), harvest and transport the cherries, and dry, remove, and sort the beans (Stein Reference Stein1985). A typical coffee plantation (fazenda) had an area from 500 to 1,000 ha but employed fewer than 100 slavesFootnote 19. As productivity per tree varied, so did productivity per slave: output ranged anywhere from 300 to 3,000 kg of coffee per worker, depending on the quality of the soil, age of trees and efficiency of productionFootnote 20.
Based on the average annual output reported by Alden (Reference Alden1984) and Soares (Reference Soares1860), I estimate the number of slaves producing coffee in each state, assuming produce-per-slave of 1,500 kg (∼100 arrobas), the midpoint of recorded yields. By this measure, fewer than 1,000 slaves were directly producing coffee at the turn of the century, but by 1825, an estimated 10,700 slaves were on the fazendas of Rio de Janeiro alone; by 1850, about 88,500 slaves were producing coffee across Brazil, with 72,000 in Rio de Janeiro and 1,200 in BahiaFootnote 21.
As coffee production was increasing, the sugar sector experienced its own expansion from the 1790s to 1820s (Schwartz Reference Schwartz1985; Bethell and Carvalho Reference Bethell and Carvalho1989). At the beginning of the century, there were 260 engenhos in Bahia, 140 in Sergipe and 616 in Rio de Janeiro (Alden Reference Alden1984; Schwartz Reference Schwartz1985). Based on the level of productivity described earlier, this would correspond to 22,650 slaves in Bahia/Sergipe and 34,881 in Rio de Janeiro as of 1800.
Small sugar plantations proliferated, yet there is no evidence that production per slave changed. With output figures from Soares (Reference Soares1860), assuming 40 arrobas per slave, I infer that there were about 13,000 slaves producing sugar in Pernambuco in 1800; in 1825, 29,000 in Rio de Janeiro, 32,000 in Bahia, and 23,000 in Pernambuco; and in 1850, 218,000 in Brazil, with 73,000 in Bahia and 96,000 in PernambucoFootnote 22. Dozens of products were produced by slaves, thus these numbers only reflect a lower bound for the slave population.
4.3 Discussion
Although approaching the modern era, Brazil had not realised its present political and territorial form — the frontier continued to shift into the interior and Natives gradually came into contact. The Native population appears stable but continued its downward trend. The African population, however, experienced an unprecedented augment: According to TASTD, almost 50 per cent of all slaves were brought to Brazil during the first half of the 19th centuryFootnote 23.
At this point, it is difficult to compare the regional census figures with those based on production, slave imports, or the pre-Columbian population: racial distinctions are increasingly arbitrary; sugar, gold and coffee no longer constitute the bulk of economic activity; and forward projections are imprecise. Nonetheless, these alternative estimates are consistent with the census data and provide supplementary information on both the racial makeup of the population and the workforce's servile status across key economic sectors.
Around 1800, for instance, only 8 per cent of the combined African/Mulatto population in Bahia was producing sugar; in Pernambuco, 5 per cent; and, in Rio de Janeiro, 24 per centFootnote 24. In 1825, just 22 per cent of slaves in Bahia were making sugar; in Pernambuco, 30 per cent; in Rio de Janeiro, across coffee and sugar, 18 per cent; and, in Brazil, no more than 40 per cent of the slave labour force was involved in either sugar or coffeeFootnote 25. By 1850, 49 per cent of Pernambuco's African/Mulatto population was in sugar, whereas in Rio de Janeiro there was just 5 per cent in the sugar (and 18 per cent in the coffee) sectorFootnote 26.
The total Native population recorded in the census across states with data was 100,858, 28,947 and 52,126 for 1800, 1825 and 1850 (my corresponding projections for just those states are 174,900, 63,400 and 78,400). If I substitute missing values by my estimates, the total Native population of the territory of Brazil was 177,900, 221,400 and 231,200 in these periods.
I also compare my regional slave-import estimates of the African and Mulatto population with the census figuresFootnote 27. The census data are the most reliable source of information on Brazil's population during the 19th century; alternative population estimates are suggestive of, but cannot supply precise details on, each state's racial makeup. While the number of slaves is extensive, their share of the total population declined to roughly one-quarter by 1850. Sugar, gold and coffee continued to be important, slave-intensive sectors of the economy; however, slaves were also employed in other occupations, ranging from merchants to whalers (Klein and Luna 2010).
5 CONCLUSION
A more-formal demographic analysis is not feasible because the data are coarse in nature, having been assembled from a variety of sources along somewhat arbitrary racial arrays. They are, nonetheless, suggestive of major demographic shifts and, when complemented with other information (ethnographies, slave import records, commodity output, etc.), can accurately define the historical contours of race in Brazil.
5.1 Racial transitions
The consolidated population figures presented here provide demographic data for eight captaincies (states) during the 16th century, ten during the 17th century, fifteen in the 18th century and twenty for the 19th century, although racial breakdowns are not always available. In Table 10, I trace the overall size of each racial group through the colonial and early imperial erasFootnote 28.
TABLE 10 THE POPULATION OF «BRAZIL» BY RACE, 1545-1850
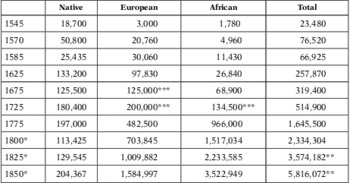
Notes: *Absent state-level data, racial makeup of proximate year used.
**Includes Ceará: 1825 population — 201,170, and 1850 — 503,759.
***Author's estimate based on available data.
The population of African descent exceeded the indigenous in European-settled areas between 1725 and 1775, and probably before 1750. Table 10 also indicates that the total population grew at an average annual rate of 1.7 per cent from 1545 to 1725, and 2.0 per cent from 1725 to 1850 — relatively high growth comparable to that of the United States (Merrick and Graham Reference Merrick and Graham1979). The transition from Native to African labour occurred first in the northeast, followed by the central-west, southeast and north, in parallel with the rise of sugar, gold and coffee as major exports.
5.2 Discussion
The early history of Brazil is one of three peoples of distinct ancestry: Indigenous, European and African. After settlement began in the 1530s, the land's original inhabitants were enslaved and their labour helped sustain the colonies; rising demand and falling Native numbers prompted the importation of thousands — ultimately millions — of African slaves. There is limited demographic data for the pre-census era, unfortunately, particularly for these two groups.
I compile existing data on the racial makeup of Portuguese-occupied areas in South America for ten periods, from shortly after settlement until the end of the international slave trade, and supplement them with new Native and African headcount estimates based on: (1) commodity output (sugar, gold and coffee) and productivity; (2) aboriginal population densities in colonised areas; and (3) trans-Atlantic slave voyages and imputed imports. My consolidated figures elucidate demographic trends, including the transition from a majority of Native descent into one of predominantly African ancestry by the mid-18th century.
The demographic and economic histories of Brazil are intimately related because of its reliance on forced labour: shifts in racial composition traced the geography of staple production, a connection I explore in related work. Race is important, not because of any innate differences between people, but because society continues to be affected by the legacy of slavery.


