


1. INTRODUCTION
This work aims to present evidence on food consumption and food prices in a Hispanic American city (Montevideo) and its surroundings in the late colonial period. It is the first attempt to gather evidence about how the inhabitants of Montevideo fed themselves and how much they paid for food, from the beginning of the Bourbon Reforms in Latin America until the beginning of the Wars of Independence in 1810.
Historical research on the cost of living in Latin America is less developed than in other regions of the world (Arroyo-Abad Reference Arroyo-Abad2016). Therefore, many scholars have recently made an effort to obtain stronger evidence on patterns of nutrition and the cost of food in Latin America during colonial times, to discuss the purchasing power of wages in Latin America vis à vis Europe and Anglo-Saxon America from 1500 to 1800.Footnote 1 This line of inquiry has highlighted the importance of establishing firmly documented knowledge of the eating habits, access to food and food prices for diverse social groups in colonial Latin America since the cost of food is at the core of the labourer's household budget.
Besides the living standards debate, consumer prices are a useful tool for other fields of economic history. Many studies from the 20th century made seminal contributions on the history of prices examining the upswings and downswings of prices in many colonial Latin American regions, which were related to macro-economic cycles and political conjunctures.Footnote 2 There were conflicting views on consumer prices in Buenos Aires in the 18th century. Romano argued that prices remained stable or tended to fall, while Johnson saw a period of high inflation after the creation of the viceroyalty of the Río de la Plata in 1776. The controversy was partly due to the extension of the periods analysed and methodological differences (Romano and Johnson Reference Romano and Johnson1992).
After a pause of about 20 years, a new wave of studies of consumer prices in the Río de la Plata region in the 18th and 19th centuries sought to improve the quantity and quality of the evidence by proposing new indexes of prices and by adding cities and areas that had not been studied earlier.Footnote 3 This work is part of such a collective effort and seeks to add evidence for the case of Montevideo.
Montevideo was the southernmost port of entry for ships coming from Cádiz to Hispanic America. Located on the 34th parallel south, it was established 200 km east of Buenos Aires at the northern shore of the Río de la Plata as a military point to protect the Castilian domain from their expanding Portuguese neighbours. The city was granted control over a territory of about 1.5 million hectares which, before contact with Europeans, was barely inhabited by nomadic groups of low demographic density. The main economic activities were overseas trade, military protection of the border territory, animal husbandry and farming. For many reasons, marine traffic expanded considerably from 1760; therefore, during the second half of the 18th century, the local economy was in full expansion. Since labour was scarce, natural resources were abundant and institutions did not prevent access to cattle and land, migrants from more populated regions of the Spanish Empire in South America were attracted to Montevideo throughout the period. From 1760 to 1810, the population of the total area (urban and rural counties) of Montevideo increased from about 3,000 to 30,000 inhabitants (Pollero Reference Pollero2015).
The farming belt of Montevideo offered a vast production of vegetables and animal foodstuffs. Wheat farming was common in the Montevideo countryside, as well as an extended list of legumes (many types of beans and chickpeas), vegetables and fruit trees. Animal husbandry benefited from the very favourable conditions of a grassland ecosystem well irrigated by watercourses. There was a chronic oversupply of cattle, so meat was abundant and cheap (Moraes Reference Moraes2018). There are no complete estimates of the volume of overseas trade for Montevideo's port throughout the period, but cattle ranching and farming experienced a remarkable growth; the agricultural output of Montevideo grew at an annual rate of 6 per cent between 1767 and 1800 (Moraes Reference Moraes2014).
This economy brought about a peculiar society. Men outnumbered women both in the city and in the countryside, probably as a result of the continuous arrival of single men from nearby regions looking for new opportunities (Pollero Reference Pollero2013). Besides, soldiers and sailors sent to Montevideo by the Crown for defensive purposes frequently married and settled there (Apolant Reference Apolant1975; Bentancur Reference Bentancur and Sala1993). Children below 15 years old regularly represented about 30-40 per cent of the total population in the period 1760-1812 (Pollero Reference Pollero2013, p. 276). A recent study depicted a stylised image of the social differentiation in Montevideo in 1772-1773, proposing three social strata: the elite, the middle stratum and the lower. Taking into account occupations, access to property and the «status» of the family heads, most of the households fit in the middle stratum (Marmisolle et al. Reference Marmissolle, Moraes, Riella and Vicario2019). Similar results are found in another study of Montevideo society in 1819-1823 (Cuadro Reference Cuadro Cawen and Frega2018). Both pictures are consistent with the idea of pre-industrial Río de la Plata as a «land of abundance», a phrase originally applied to colonial Buenos Aires (Fradkin and Garavaglia Reference Fradkin and Garavaglia2004).
A price history of colonial Montevideo has not yet been written, and historians have yet to undertake a detailed analysis of local patterns of consumption, local markets for food and the retailing channels of the region. Recent work on the history of food in Uruguay has focused mostly on the 19th century and the emergence of a national cuisine as part of the process of modern state building. Concerning the colonial period, this literature stressed the influence of the Guaraní missions in local food patterns, and it claims the leading role of beef and mate in the colonial diet of the popular classes (Laborde Reference Laborde2017).Footnote 4 However, it has contradicted the general statement regarding meat as the only food, describing it as a factual exaggeration and a cultural device developed for national identity purposes that took shape in the 19th century (Laborde Reference Laborde2017).
This paper gathers information on the main foodstuffs that formed the diet of the people of Montevideo. It proposes two price indexes for food suitable for the plebeian and non-elite social groups; it studies the evolution of food prices from 1760 to the beginning of the 19th century and puts this into a regional comparative perspective.
Section 2 introduces the sources and methods. Sections 3 and 4 analyse the food staples in Montevideo according to diverse sources. Section 5 presents two indexes of consumer prices for the city of Montevideo and compares the evolution of prices with neighbouring cities in the period. Section 6 summarises the main conclusions.
2. SOURCES AND METHODS
Firstly, we will discuss some information about the main staples that made up the diet of the diverse social groups of Montevideo. As a second step, we will present information on the prices of staples and put forward two hypotheses on the food consumption of workers and artisans of Montevideo in the late colonial period. We will then calculate two Laspeyres price indexes of food based on the former hypothesis. Finally, the article compares the food price fluctuations of Montevideo with the consumer prices in Buenos Aires and Santa Fe. We will apply an econometric test to the price series of the three cities to contrast the hypotheses of cointegration.
Montevideo does not have one of the best-rated sources for the history of consumer prices and consumption bundles in pre-statistic periods, such as accounting books of monasteries. After the Society of Jesus was expelled from Hispanic America in 1768, the only religious order that remained in the city was the order of San Francisco, whose archives are not public yet.
Furthermore, the case of colonial Montevideo lacks previous studies about the nutritional patterns and cooking habits of the inhabitants of any social group, not just the poorest. Therefore, this work had to start by gathering an array of sparse and heterogeneous sources to obtain information about what Montevideans from diverse social groups ate, how they obtained their food and how much they paid for it.
The following sources are useful for finding out about the nutritional habits and the cost of food among different social groups of Montevideo:
(1) The accounts of a big military campaign that advanced along the coastline of the Río de la Plata from 1755 to 1761.Footnote 5 The militias of Buenos Aires, Montevideo, Santa Fe, Corrientes and Paraguay were involved in the expedition, plus a thousand soldiers brought from Spain for that purpose. The endeavour cost about 1.4 million silver pesos, and the bill for food was 20 per cent of the total. A detailed list of the consumed foodstuffs was presented to the Royal Treasury by Martín Altolaguirre, the officer in charge.Footnote 6
(2) The Royal Navy rules about the feeding of sailors on board and on land that were in force at that time, as presented in Sandrín (Reference Sandrín2014).
(3) The contracts that the Royal Navy signed in Montevideo from 1770 to 1810 with their suppliers to feed the sailors in port analysed in detail by Sandrín (Reference Sandrín2014).
The above sources, numbered 1, 2 and 3, give information on the food consumption of armed men on land and at sea. They probably amount to close to 10 per cent of the total population in years of peace, but a higher figure during (the frequent) war episodes.Footnote 7 Leaving aside a small fraction of high officials, they pertain to the middle and lower strata of the society (Marmissolle et al. Reference Marmissolle, Moraes, Riella and Vicario2019).
(4) The accounting books of the office of the Royal Treasury in Montevideo from 1775 to 1799.Footnote 8 The books recorded local tax collection and government spending. They provide information on how much local officials paid for slaughtered cattle to feed prisoners in jail and Indians recruited to serve in military works in Montevideo. They belonged to the low-ranking and less-privileged social groups of the local society, as well as low and non-skilled free workers without property, and slaves. In 1772-1773, the lower stratum of Montevideo's society made up 46 per cent of households (Marmisolle et al. Reference Marmissolle, Moraes, Riella and Vicario2019).
(5) The list of prices set by the city council (Cabildo) from 1760 to 1815 following legal provisions.Footnote 9 By nature, this source does not report on the consumption of food by any specific social group, but by the society as a whole. It seems to describe an accepted local food pattern, depicted in a list of basics that the city council understood as necessary for an ordinary family. Before 1760, bread was the only tariffed good, but from 1760 onwards, a growing list began to take shape. In 1770, the list included ten products, and at the end of the period, there were thirty-four. Half of the priced items were foodstuffs, and the rest were alcoholic beverages, yerba mate and tobacco, soap and candles. There are no textiles of any kind or manufactured goods since access to these items was not the city council's duty. The list was published periodically: once a year from 1760 to 1770, twice a year from 1770 to 1780 and three times a year (January, May and September) from 1780 onwards. It is not possible to establish with certainty how close the listed prices were to the market prices, but the records show clearly that the council officials used to raise or lower prices according to the cycle of wheat production and the flow of overseas trade. They also used to look at the prices of Buenos Aires, where some essential products came from (e.g., salt and wine). Therefore, while this source is uncertain for price levels, it is possible that it appropriately recorded the price fluctuations in foodstuffs. As we will see below, the results confirm this standpoint.
(6) A lawsuit filed by a widow of Montevideo against other heirs of her dead husband in 1771, claiming for the expenses that she should receive for herself as well as for her daughter.Footnote 10 Manuela Ruiz headed a household formed by herself, her daughter and a slave. She had to present a «demonstration in which it is palpably recognized what a woman moderately needs per day for food» since the death of her husband in 1767-1771, bearing in mind «my family [size] and the fair price of things in this place». According to the widow, her husband was one of the «first and more distinguished inhabitants of this city», and he left a considerable estate when he died. Besides, the late Mr. Pérez was a distinguished member of the city council, which places him as a member of the local elite. Thus, the file provides first-hand information on the different items of consumption of a «respectable» family of two free women and a female slave. In 1772-1773, the Montevidean elite represented around 2 per cent of the total population, a very small proportion (Marmisolle et al. Reference Marmissolle, Moraes, Riella and Vicario2019).
(7) The accounting records of the Charity Hospital during the period 1787-1805. The Charity Hospital was founded in 1787 by a secular Catholic brotherhood to provide free care and accommodation to free or slave patients termed as «poor of solemnity» (pobres de solemnidad), an expression to describe the legal rights emanating from the fact of being poor.Footnote 11 It was unusual for a «wealthy» patient to require hospitalisation, but if he did, the hospital charged a fee (Bianchi Reference Bianchi2001). The ledgers of the hospital between 1787 and 1805 were scrutinised to register the foodstuffs that made up the diet of the patients. It is a useful source which provides, primarily, information about the diet of sick people and, secondly, adds information about the feeding pattern of the poorest in society, whether free people or slaves.
Additionally, two literary pieces were used to enrich the former sources. The first is called «Diary of travel from Montevideo to Paysandú» (Diario de Viaje de Montevideo a Paysandú), a travelogue written in the heyday of the revolutionary years (1815) by the priest Dámaso Antonio Larrañaga, a well-known politician belonging to the «patriot» side of Montevideo. He was travelling to meet a high revolutionary chief located 400 km from Montevideo. Surrounded by a group of armed men and horses, Larrañaga and his entourage stayed in humble rural inns or the rural houses of their political friends of the most diverse social classes. References to meals during the trip are abundant and particularly detailed (Larrañaga Reference Larrañaga1968). The second is the collection of memories published originally in 1887 by the Montevideo-born writer Isidoro de María (1815-1905). Although the author made some archive research, de María's chronicles on colonial Montevideo are based mostly on oral testimonies (de María Reference De María1957). His writings are invoked here to gain some details on the urban retailing markets for the main staples as well as some practices concerning selling food and shopping.
3. EATING: COMPONENTS OF THE CONSUMPTION BASKET
Foodstuffs mentioned in sources 1–7 can be ordered into the following categories: (a) bread, (b) foodstuffs of animal origin, (c) foodstuffs of vegetable origin, (d) sweets and sweeteners, and (e) basics for cooking.
(a) Bread
All the sources record bread, from the Ruiz family account to the Army contractors and the hospital for the poor. The contractors to the Royal Army were obliged to deliver 24 oz (0.69 kg) of bread per seaman daily, a high figure. The tariff of the city council priced three types: a cheap and regular bread called pan cocido and two types of better quality and higher price.Footnote 12 A qualified observer in 1787 stated: «Wherever you go within the jurisdiction, you find bread because there are mills distributed all along» (Pérez Castellano Reference Pérez Castellano1968b). As in many pre-industrial economies, the consumption of this homemade staple was important. In addition to homemade bread, it was also purchased from women bakers, frequently widows, or single women. However, after 1770, a small group of prominent businessmen entered the market. They were suppliers of the royal troops and, due to the size of their contracts, they quickly managed to control the demand for wheat and the flour supply. The city council sought to grant the women bakers a portion of the market, but in 1774, it authorised the big contractors to sell bread at retail prices, which indicates increasing levels of commodification at that time.Footnote 13 According to de María, in 1808, bread consumption reached 450 silver pesos a day. Considering the price of bread and the population of the city in 1808, this gives an apparent consumption that ranged from 150 g (high-quality bread) to 250 g (low-quality bread) per person (de María Reference De María1957, pp. 109-110).
(b) Foodstuffs of animal origin
Foodstuffs of animal origin are present in all the sources. They mention fish, poultry, mutton, sausage and bacon, besides the omnipresent beef. Isidoro de María dedicated a whole chapter of his book to a street called «Fishermen Street» in colonial Montevideo that ran from the harbour to the main square of the old city, where the people used to go to buy fish (de María Reference De María1957, pp. 104-106). Indeed, demographic sources had shown that «fisherman» was a common occupation in a city surrounded by the Rio de la Plata (Vicario Reference Vicario2010). Poultry was served in the hospital and established as the food for sick sailors in the Navy regulations, where they also prescribed mutton as an individual dish when sailors were not healthy. However, poultry was also served as a luxury dish. Some of the best dinners offered to the author of the «Diary of Travel» outside the city of Montevideo in 1815 included poultry: they have got «Good and carefully roasted and stewed chickens», in a dinner that included «boiled broth, bread, wine and coffee with silverware». On another occasion, they ate «well-seasoned ducks and chickens» at a table with «tablecloths, iron spoons, dishes and jugs of earthenware» (Larrañaga Reference Larrañaga1968, p. 8). Finally, in 1815, Larrañaga's team spent the night at the property of a prosperous landowner, and the dinner they received was so good that the author remarked: «even the laborers have eaten poultry» (Larrañaga Reference Larrañaga1968, p. 18). Sausage and bacon were both on the table of the men at the Border Campaign and that of the Ruiz family. Bacon briefly entered the list of the city council in 1779 but was left out in 1782 and was never included again. Dairy product references appear after 1800. In the hospital, some patients who were perhaps infants had milk, and the author of the «Diary», in the middle of a rural area, asked his people to look for milk (to have with tea) for several kilometres around (Larrañaga Reference Larrañaga1968, p. 21).
However, the king of the foodstuffs of animal origin was beef. Beef had a primary role in the diet in Montevideo, as well as in other regions of the Río de la Plata, because of the abundance of cattle. Therefore, although the city council subcontracted the supply of meat to one or more contractors who were obliged to comply with the volumes and prices established by the council, consumption of home-reared beef seems to have been so generalised that in many cases disappointed contractors left the business denouncing an insufficient rate of profit. Moreover, there was a kind of informal urban market for meat, frequently denounced in the minutes of the city council as unfairly competing with the legally authorised suppliers. The market began to change shortly after 1780 when the urban population grew significantly, the demand for meat to provide the Royal Navy jumped and several investors opened the first salted meat mills for overseas trade (Moraes Reference Moraes2018). So, a new formal market for meat took shape in the city of Montevideo after 1780. As in Buenos Aires, the beef used to be sold in carts by quarters (Grünwaldt Reference Grünwaldt1970, p. 33), and as in that city, the slaughtered cattle were probably cut with an axe as the only preparation before being sold (Silveira Reference Silveira2003). The itinerant sale of meat began to face official competition when, in 1808, the city council managed to formalise an official marketplace for beef in the so-called recova, a modest building located behind the city hall with that purpose (de María Reference De María1957). By then, the agricultural frontier of Montevideo had expanded, and livestock had increased, so there were no signs that the supply of beef faced any difficulties in meeting the demand. A proud Montevidean wrote in 1787: «I have no notice that in any place of the vast Spanish domains, more fat, better and cheaper meat is eaten».Footnote 14 As late as 1834, a European traveller to Montevideo wrote: «The astonishing abundance of livestock in the nearby districts make the price of meat so modest that [beef] it is not sold by weight, but merely on inspection, and for 1 real you can buy 12 to 15 lb» (Grünwaldt Reference Grünwaldt1970, p. 33). Because of this peculiar situation, beef was the leading staple food at all Montevideo tables, but much more so at the table of the poor. The author of the «Diary of Travel» tells how every time they stopped to rest, the labourers and the men that formed his armed escort had a different meal from that served to the «respectable» individuals of the group. In all cases, the meals for the subordinates were generous portions of grilled beef, frequently «roasted on big open fires» (Larrañaga Reference Larrañaga1968, p. 15).
(c) Foodstuffs of vegetable origin
Chickpeas are, together with bread, the only staples mentioned in all the sources, and the content of minestras (a portion of dried, cooked pulses or rice supplied to the troops and the prisoners) is explained in detail in the Navy rules and contracts. In the city council's list of prices, rice entered in 1774 and chickpeas in 1779. A great variety of peas and beans were cultivated in the agricultural belt of the city. Indeed, bread, beef and pulses seem to be the main staples at many tables.
However, vegetables are mentioned only in the accounts of the Border Campaign and in the Ruiz family file, while fruit is not mentioned at all in sources number 1–7. However, most of the farms of the local agricultural belt cultivated vegetables in great variety, and fruit-bearing trees accounted for about 50 per cent of the total investment in an average farm. Vegetables and fruit were transported daily to the inner city and marketed in the main square (de María Reference De María1957, p. 70). Besides the market, consumption of home-grown fruit and vegetables was remarkable even in urban households, since vegetables were also grown in the city, as suggested by a special tithe on urban orchards.
(d) Sweets and sweeteners
Sugar consumption increased and became widespread in European cities through the 18th century, a phenomenon considered to be central to a global transformation in consumption patterns (McKendrick Reference McKendrick1997; McCants Reference Mccants2007; Mintz Reference Mintz, Counihan and Van Esterik2012).
This increase in sugar intake was also reported for Hispanic American cities not involved in sugar production such as Buenos Aires (Johnson Reference Johnson, Johnson and Tandeter1992), and in the light of this evidence, Montevideo was included in this general trend. Indeed, the price of brown and white sugar was set by the city council from 1760; sugar was included in the account of the military campaign that started in 1754 and the widow's daily bill in 1774. At the beginning of the 19th century, even the hospital for the poor had sugar on its list of supplies. Future research should study the relationship between local sugar consumption during this period and the Atlantic trade networks that linked the ports of Montevideo, Rio de Janeiro and Havana. Besides sugar, the tariff of the city council included raisins, fig raisins and honey from 1760.
(e) Basics for cooking
Salt, vinegar, oil and chilli were the most frequently named basics for cooking in sources number 1–7. The city council priced oil, salt and chilli from 1760 onwards, the Navy rules obliged the provision of salt and chilli to seamen in port or on board ship, the military campaign records had chilli, vinegar, salt and oil in its account and the Ruiz family also included them in their list of provisions. Oil and salt came from outside Montevideo, the former probably from Spain since there were no oil mills in Montevideo, and according to the city council list, the latter came from salt works near Buenos Aires. As in Buenos Aires, in the poorest households, animal fat was surely preferred to oil for cooking since it must have been more affordable because of the abundance of cattle.
(f) Drinking and smoking
Alcoholic beverages and tobacco were widespread in all Hispanic American cities at the time, but we have no studies on the consumption of these goods in Montevideo.
In the neighbouring city of Buenos Aires, the consumption of alcoholic beverages was common (Johnson Reference Johnson, Johnson and Tandeter1992). In Montevideo, wine is mentioned as a necessary item in the Royal Navy rules, in the city council list and even in the hospital accounts, but there is not enough information on the habits of alcohol consumption across different social groups.
The Montevideo council priced three kinds of wine of varying quality and origin; all of them came from outside the local economy because grapes were not grown in the region (Bonfanti Reference Bonfanti and Beretta2010). In addition, four types of liquors were included in the list of prices, coming from South American regions that already specialised in alcohols such as Mendoza (Argentina) and Brazil as well as from Spain.
Very little is known about the consumption of tobacco in Montevideo during the 18th century. The Crown established the monopoly of tobacco in America from 1760 onwards, and this policy gave rise to the generalised and massive smuggling of this product throughout Hispanic-America (del Carpio-Penagos Reference del Carpio-Penagos2014). The city council of Montevideo set the price of three kinds of smoking tobacco until the opening of the royal monopoly in 1778. The plant was not cultivated locally but came from Paraguay and the Guaraní missions. After 1778, tobacco—usually coming from Brazil—was the most frequently captured item by the royal officials of Montevideo who confronted the smugglers (Dávila Reference Dávila2015).
The consumption of yerba mate (Ilex paraguariensis), a shrub domesticated in the Guaraní missions during the Jesuit period, has been widely documented in the southern regions of South America since the 17th century (Garavaglia Reference Garavaglia1983). The habit of drinking mate was widespread in all social groups of the Río de la Plata in the late colonial period, although it had indisputable roots among the popular classes of the population. Together with alcohol and tobacco, it constituted a set of daily pleasures common to the plebeian sectors of colonial society, both rural and urban (Johnson Reference Johnson2013). Both for Buenos Aires and Montevideo, the custom of including tobacco and yerba as part of the wage of workers was widespread in the construction sector and rural establishments (Johnson Reference Johnson, Johnson and Tandeter1992; Moraes and Thul Reference Moraes and Thul2018).
4. PAYING: PRICES AND CONSUMPTION BASKETS
Bread, beef, pulses, sugar, salt, chilli, wine and yerba mate were the most frequently mentioned foodstuffs in the sources; therefore, they are taken as staples in the consumption baskets proposed for Montevideo. Tobacco is set aside because the sources are very scant on consumed volume and prices.
Prices of bread, beef, pulses, sugar, salt, chilli, wine and yerba mate were collected from the sources.
As a general procedure, we took the prices initially expressed in reales from the quarterly list of prices set by the city council, then created a yearly average and converted them to modern units of measure.Footnote 15 The prices for slaughtered cattle are taken from the Royal Treasury accounts for the years from 1775 to 1799, and from a secondary source for 1800, 1803 and 1808 (Sala et al. Reference Sala, Rodríguez and De La Torre1967, pp. 49-50). For the remaining years, they were estimated based on the relationship between the price of live cattle and the cost of slaughtered animals (see Tables A1 and A2 in the Appendix).
The price series has interpolations in percentages ranging from 4 to 24 per cent of the total observations. The interpolated data are scattered throughout the period and in no case exceed five consecutive years. The city council's list does not include legumes until 1774. Therefore, for the estimation of the Laspeyres indexes, we took the price of pulses between 1760 and 1774 as the price for 1774.
Figure 1 shows the prices of bread, beef and pulses in Montevideo from 1760 to 1810. Prices are in reales, equivalent to one-eighth of the silver peso, which was the monetary unit of the Spanish empire in Hispanic America. Reales were the fraction of the peso most commonly used in public and private accounts in the 18th century in the Río de la Plata viceroyalty. The silver content of one real in 1760 was 3.11 g, but from that time until 1810, the real experienced two debasements (1772 and 1787) that brought it to 3.03 g of silver, a modest loss of 2.7 per cent in 50 years.Footnote 16

FIGURE 1 Prices of the main staples in Montevideo (in reales per unit).
In Figure 1, the price of pulses is in reales per kilo from 1774 onwards, when they became subject to the city council tariffFootnote 17. The price did not rise over the period but fluctuated around an average of 3.3 reales per kilo. Prices of beef (right axis) are also given in reales per kiloFootnote 18. These prices experienced sharp fluctuations from 1760 to 1790, but from then to 1810, the volatility diminished. Livestock shortages occurred when war broke out or after a prolonged drought. While cattle ranchers were able to replenish the stock lost due to an external shock with the wild cattle that abounded inside and outside the Montevideo territory, price increases were episodic. As in Buenos Aires, the rise in exports of hides during the last three decades of the 18th century did not affect the price of live cattle and therefore did not affect the price of meat either. The primary source of hides for exports was the vast herds of wild bulls and cows that abounded in the lands of Montevideo and beyond. Finally, an expanding frontier helped to make livestock abundant in the long run. Therefore, throughout the period, beef, which was always very cheap, became even less expensive, going down from 0.09 to 0.04 reales per kilo. Considering that in the 1760s the daily wage of a construction labourer in Montevideo was about two reales, the purchasing power of his wage in terms of meat was about 30 kilos, not including the butcher's mark-upFootnote 19. However, whatever the percentage of the butcher was, the purchasing power of the wage seems quite high in terms of meat. Bread prices (left axis) are in kilos. In the short run, bread prices (as well as locally produced foodstuffs in general) were affected by severe droughts in 1764, 1772-1774, 1788-1791, 1803-1804, and floods in 1778, 1797, 1805 and 1807 (Deschamps et al. Reference Deschamps, Otero and Tonni2003, Reference Deschamps, Otero and Tonni2014). In the long run, bread prices increased over the period at an annual rate of 1.3 per cent, but the growth was not steady; in the interval 1790-1810, prices rose much faster, reaching a rate of 5 per cent per year. Since bread experienced a rise and meat a fall in prices during the period, and particularly after 1790, it is entirely understandable why in 1815, the men who escorted Larrañaga had received roast beef as a meal for subaltern workers.
Table 1 deploys two different hypotheses about food consumption and prices for Montevideo from 1760 to 1810. Baskets 1 and 2 are both hypotheses about the consumption of food in low-ranked social groups. The volumes in both baskets are set following the available evidence for Montevideo and Buenos Aires at the time, but some assumptions had to be made to close some information gaps.
TABLE 1 Composition and volume of daily calorific intake of two food baskets
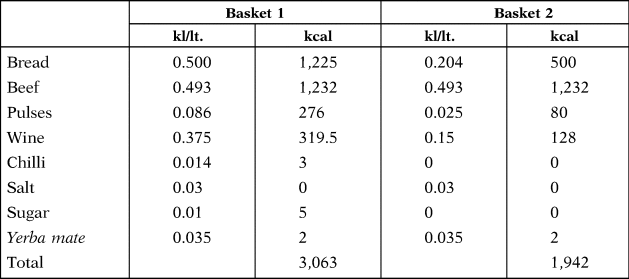
Sources: Calories content taken from Allen (Reference Allen2001) for meat and bread; pulses, sugar and wine taken from Ministerio de Trabajo y Seguridad Social, Uruguay (2002).
Basket 1 has about 3,000 calories, an acceptable average for a well-fed, mostly male and adult population in the 18th century. Despite being barely higher than the current recommendation, it seems feasible in a historical context in which a robust body was considered an indicator of good health.Footnote 20 This is a valid hypothesis for people such as skilled workers, soldiers, artisans and shop-keepers. Indeed, basket 1 has no luxuries; it only includes the basic staples (bread, beef, pulses, salt, wine and yerba mate) accompanied by a spice (chilli) and sugar.
In contrast, basket 2 was adapted to Montevideo, from the minimum consumption basket for labourers of pre-industrial Europe formulated in Allen (Reference Allen2001), and for pre-industrial American workers in Allen et al. (Reference Allen, Murphy and Schneider2012), providing a daily survival intake of about 1,941 calories. A previous study advanced a local basket for a survival intake based on Allen's proposal (Moraes and Thul Reference Moraes and Thul2018). Basket 2 differs from this previous study in the content and volumes of food; salt and yerba mate were not in the old basket, and what is most important, the share of bread was more significant in the old one than it is in the new.Footnote 21
Quantities of bread in baskets 1 and 2 showed two contrasting patterns of bread consumption. Basket 1 has 0.5 kg of bread, slightly less than the high amounts established in the contracts signed by the Royal Treasury with the providers of the Royal Navy located in Montevideo (Sandrín Reference Sandrín2014, p. 96). Instead, the consumption of bread in basket 2 is about 0.2 kg per day, a figure that is coherent with the information provided in de María for the city of Montevideo in 1808.
Beef figures are the same in both baskets. They have been estimated based on the contracts signed by the Royal Treasury, with the providers of the Royal Army in Montevideo (Sandrín Reference Sandrín2014, p. 96). They were obliged to deliver the so-called «rations» of beef to the sailors regularly, but the sources do not state how frequently and in what volume. Many local and regional sources claim that slaughtered cattle yielded 60 «rations» of beef and considering that one slaughtered animal would yield approximately 207 kilos of beef, a «ration» would weigh 3.45 kg, including fat and bones.Footnote 22 We will assume that the meat «ration» was delivered weekly, and therefore, that the sailors ate almost 0.5 kg of meat daily, which yields an annual meat consumption of 182 kg (including fat and bones).Footnote 23 It is a feasible volume for a city located in the Río de la Plata prairies; apparent annual meat consumption in Buenos Aires in the late 18th century was 190 kilos, and in Córdoba (Argentina) was still 180 kilos in 1820 (Martínez-Barraza Reference Martínez-Barraza2018). Moreover, the closest estimation of meat consumption in Montevideo is for 1870 and indicates an annual figure of 154 kilos per capita (Barran and Nahum Reference Barran and Nahum1979, p. 186).
The figures from the Royal Navy's regulations were proportionately downsized in both baskets to set the consumption of pulses, taking into account that in Montevideo, the cheapest protein provider was beef.
The volumes of wine, salt and chilli are from the Royal Navy's regulations. Wine quantity in basket 1 is the same as in the source, but is downsized in basket 2, to keep the intended difference between the baskets. Instead, chilli (in basket 1) and salt volumes (in both baskets) are the same as the Navy.
Sugar consumption (basket 1) is based on more remote references since there is no available local evidence to provide a better-founded estimate. Thus, the daily consumption of sugar comes from an assumption of a yearly consumption per head of 5 kilos, based on the available evidence of sugar consumption for labourers in England in the late 18th century.Footnote 24 Finally, the amount of yerba mate in both baskets is for a single daily intake of mate. Again, this is the first hypothesis about food consumption in Montevideo during colonial times, and both the staples and the amounts presented here will require subsequent corrections and improvements.
Table 2 shows the contribution of each staple to the total cost of baskets 1 and 2, calculated with their averaged prices. Despite the changes in the relative prices throughout the period, the shares appropriately reflect some crucial facts; bread and pulses were always more expensive than beef. Thus, bread represents the largest share in both baskets, and it is worth noting that it is close to the figure of 40 per cent reported for Buenos Aires in the years 1776-1811 (Johnson Reference Johnson, Johnson and Tandeter1992, Reference Johnson2013).Footnote 25 Wine and pulses are second in importance, followed by yerba mate and sugar.
TABLE 2 Shares of total food expenditure in baskets 1 and 2

Source: Quantities from Table 1 and prices from Table A2 (Appendix). Daily cost of each basket estimated in prices from the average 1760-1810. Since prices were not stable through the period, the average hides the changes in relative prices.
In contrast, the leading provider of proteins (beef) has modest shares in both baskets because of its low price. Beef share in the survival basket is the same as in Johnson's consumption basket for Buenos Aires, but in basket 1, which has a more extensive list of products, it is even smaller.
Figure 2 shows two food price indexes calculated respectively with baskets 1 and 2.

FIGURE 2 Food price indexes 1 and 2, 100 = average 1760-1810.
Indexes 1 and 2 show similar movements, suggesting that fluctuations in food prices would have affected those who had access to satisfactory levels of nutrition, as well as those who were only just surviving.
As Table 3 shows, both indexes depict two contrasting stages in the period from 1760 to 1810. Between 1760 and 1789, food prices in Montevideo featured a declining pattern, in accordance with Romano's (Reference Romano1963) stance on falling prices in South America through the 18th century. Between 1790 and 1810, however, they featured a rising pattern, in accordance with Johnson's (Reference Johnson, Johnson and Tandeter1992) stance regarding consumption prices in Buenos Aires. Besides, during the inflationary years, prices in Montevideo were also more volatile than during the years featuring decreasing prices.
TABLE 3 Phases in the history of food prices in Montevideo, 1760-1810

Sources: Indexes 1 and 2 from Table A3 (Appendix). Annual rates of growth and standard deviation estimated on the trend of each index.
Within these two opposite and significant movements, the evidence shows smaller but marked fluctuations. In the falling phase, despite a negative annual rate of 1.3 per cent, there was a marked period of rising prices from 1775 to 1781, which would have been deeply felt by the Montevideans. Despite an annual rate of growth of almost 3 per cent during the rising stage, there were some brief and brisk falls of prices in the 1800s.
Finally, Figure 3 plots the Montevideo indexes together with the consumer price indexes of the other two Hispanic American cities of the area: Buenos Aires and Santa Fe. The base of the Montevideo and Santa Fe indexes is set in 1776 to make them comparable with Johnson's index for Buenos Aires (Johnson Reference Johnson, Johnson and Tandeter1992, Reference Johnson2013). Although the indexes have a different content, there is a striking similarity in their fluctuations. In Montevideo and Santa Fe, prices underwent a slowdown from 1760 to the middle of the 1770s and, along with Buenos Aires, experienced a sharp inflationary stage from 1776 to the beginning of the 1780s.

FIGURE 3 Food prices and consumer prices in Buenos Aires, Montevideo and Santa Fe (in log.) 100 = 1776.
After a new decline until 1790, the three cities experienced a new stronger and volatile inflation peaking between 1801 and 1807. In the long run, these fluctuations can be summed up in two long phases similar to those detected for Montevideo: one of the incremental falls in prices and another of rising prices (see Table 4).
TABLE 4 Phases in the history of prices in Buenos Aires, Santa Fe and Montevideo, 1760-1810

1 From 1776 to 1790.
Sources: Same as Figure 3. Rates of growth estimated on the Hodrick–Prescott trend of the Laspeyres indexes for Santa Fe, Buenos Aires and Montevideo with 100 = 1776.
Johansen's tests (Reference Johansen1991) proved the existence of cointegration among price series for Buenos Aires, Santa Fe and Montevideo from 1776 to 1810. Two contrasts (trace and maximum Eigenvalue) rejected the hypotheses of a non-cointegrating equation, at a 5 per cent confidence level (see Table A4 in the Appendix). Thus, this evidence shows that there was a joint, two-staged movement of prices in the cities of the Río de la Plata's coastline in the late colonial period.
The causes for the two phases of falling and rising prices in the Río de la Plata cities are a topic that deserves further research. In the meantime, it is worth mentioning some monetary and non-monetary facts related to the long-run fluctuation of prices. Concerning monetary facts, according to Newland (Reference Newland2002), the silver coinage in this part of the Spanish Empire grew from 1760 to 1780 at an annual rate of 1.2 per cent and from 1781 to 1800 at an annual rate of 0.4 per centFootnote 26. In other words, both falling and rising phases took place in the context of monetary expansion, and besides, the falling stage unfolded when the silver coinage grew faster. Maybe this paradox is related to the fact that mining, besides being the supplier of silver, was a significant growth engine with strong and extensive linkages to agriculture and trade across the so-called Peruvian spaceFootnote 27. Thus, it is feasible that the price slowdown in 1760-1790 would be related to gains in output and productivity coming from agriculture and trade that accompanied the mining growth.
Although macroeconomic estimates are few, scholars agree that after 1740, the so-called Peruvian space experienced a process of economic growth driven by the growth of mining. The available estimates show high rates of GDP growth from 1740 to the end of the century (Coatsworth and Newland Reference Coatsworth and Newland2000; Newland Reference Newland2002; Arroyo-Abad and Van Zanden Reference Arroyo-Abad and Van Zanden2016). Many scholars have pointed out that this wave of growth particularly favoured the coastal cities of the Río de la Plata because of their factor endowments as well as their Atlantic proximity and connections (Halperin Donghi Reference Halperin Donghi1972; Garavaglia Reference Garavaglia1987; Moutoukias Reference Moutoukias1995). The Bourbon reforms that in 1778 opened the ports of the Rio de la Plata intensified this process. In real terms, the tithe income of the Buenos Aires bishopric grew faster than tithes from the northern regions of the viceroyalty from 1760 to 1800. From 1778 to 1800, the population doubled in the coastal regions, while it grew 50 per cent in the centre and north of the Río de la Plata's viceroyalty (Gelman and Moraes Reference Gelman, Moraes, Gelman, Llopis and Marichal2014, p. 67). Hand in hand with the growing population, the agricultural frontier expanded as more land and cattle were put into production. After the trade opening ordered by the Crown in 1778, Buenos Aires and Montevideo were both soon engaged in the emerging and dynamic Atlantic networks of trade that worked as an additional source of dynamism for both urban and rural economies. From 1765 to 1791, hide exports from Buenos Aires and Montevideo grew at annual rates ranging from 7 to 10 per cent (Gelman and Moraes Reference Gelman, Moraes, Gelman, Llopis and Marichal2014, p. 57).
However, some evidence suggests that this general trend stopped somewhere in the 1790s. Hide exports slumped in 1792-1802 at an annual rate of −2 per cent (Gelman and Moraes Reference Gelman, Moraes, Gelman, Llopis and Marichal2014, p. 56) and conflicts over the control of cattle, pastures and water in the border areas of the coastal region intensified (Djenderedjian Reference Djenderedjian2008; Moraes Reference Moraes, Caetano and Ribeiro2015). In this context, the wars that confronted Spain, Great Britain and France from 1796 to 1808 halted long-distance Atlantic trade and threatened the prosperity of the Rio de la Plata's cities which had formerly benefited. The rising stage of prices that started in the 1790s seems to have been triggered by the halt in trade and was then aggravated in 1806-1807 by a British military attack on Montevideo and Buenos Aires.
5. CONCLUSIONS
This work is part of a collective effort developed by economic historians to document information on the eating habits, access to food and food prices for diverse social groups in colonial Latin America (Dobado-González and Montero Reference Dobado-González and Montero2010; Challú and Gómez-Galvarriato Reference Challú and Gómez-Galvarriato2015; Dobado-Gonzalez Reference Dobado-Gonzalez2015; Gelman and Santilli Reference Gelman and Santilli2015, Reference Gelman and Santilli2016; Djenderedjian and Martirén Reference Djenderedjian and Martirén2013, Reference Djenderedjian and Martirén2015a; Martirén and Djenderedjian Reference Djenderedjian, Frid and Martirén2017; Llorca-Jaña and Navarrete-Montalvo Reference Llorca-Jaña and Navarrete-Montalvo2015; Calderón-Fernández et al. Reference Calderón-Fernández, García-Montero and Llopis-Agelán2017). It adds to this line of inquiry the case of Montevideo in the years of the Bourbon Reforms.
Different diets existed in Montevideo based on the main staples: bread, beef, pulses and wine. In different proportions, according to the social and cultural differences, fish, poultry, sausage and bacon complemented or supplanted beef, and an array of vegetables and fruits accompanied the pulses. In the middle or top social groups, sugar consumption was probably as frequent as in many neighbouring areas. Wine and smoking tobacco were both widely consumed in workers' households.
The inhabitants of Montevideo had access to food both within and outside the market. The city council controlled the supply of some essential products and regulated the prices of a wide range of food and beverages of European, American and local origin from 1760 onwards. The royal tobacco monopoly controlled the retailing of tobacco from 1778. However, the degree of food commodification differed significantly between foods and throughout the period. Cattle were abundant, and self-consumption of beef was widespread. Finally, there were illegal markets about which we have, as yet, insufficient information. Smuggling of tobacco and liquor from the nearby Portuguese lands was part of well-established long-distance networks that traded animals, textiles and slaves.
Two indexes show the changes in food prices in Montevideo from 1760 to 1810. The indexes cover a period of colonial Hispanic America characterised by the growth of mining, agriculture and population. Index 1 assumes a daily intake of about 3,000 calories, whose cost is 1.5 reales at 1760-1810 average prices. It is a hypothesis about the food consumption of artisans and manual and non-manual skilled workers, such as carpenters, bricklayers and shop-keepers. In the 1790s, their daily wages ranged from 6 reales (a bricklayer) to 14 reales (a master carpenter) (Moraes and Thul Reference Moraes and Thul2018). According to the social stratification of colonial Montevideo, these workers could be considered as occupying a low or middle position in the local society, depending on their race and legal (free or not) condition.
Index 2 assumes a daily calorific survival intake (1,942 calories) costing about 0.6 reales at 1760-1810 average prices. Rather than representing the actual situation for a particular social group, it is a methodological tool that defines the poverty line. It is worth noting that, given the peculiar abundance of beef and the incomplete commoditisation of food that characterised Montevideo, undernutrition was surely not frequent even among the poor. The mortality crises in Montevideo during 1760-1810 were milder than those in Europe at that time (Pollero Reference Pollero2013). However, index 2 will help to improve the already available estimate of «welfare ratios» for Montevideo workers and comparisons with other cities.
Despite their different content and price, both indices 1 and 2 show the same swings. In the long run, food prices in Montevideo underwent a phase of decline from 1760 to 1790 and a period of inflation from 1790 to 1810. Therefore, the Montevideo history of prices had a phase characterised by deflation and high stability approximately from 1760 to 1790, followed by a phase of high inflation and high volatility that started later than in Buenos Aires (in the 1790s) and possibly continued during the Wars of Independence.
Consumer prices in Buenos Aires and Santa Fe and food prices in Montevideo underwent the same stages in 1760-1810. Additionally, the cointegration test proved that the price series of the three cities had a common trend. This fact does not prove that there were integrated regional markets, but it clearly suggests that this was the case. It is an interesting hypothesis that should be taken up in future studies, concerning the scope and the functioning of the regional markets before the breaking up of the colonial order.
This paper offers hypotheses for future research into the causes of the price fluctuations. In the short run, climatic and political circumstances were the driving forces of prices, but in the long run, changes in prices accompanied the rise and fall of a cycle of economic growth in the «Peruvian space». Thus, to gain a better understanding of the causes of price fluctuations, it will be useful to re-open the study of the nature and dynamics of the economic growth that affected the Peruvian region in the 18th century.
SOURCES AND OFFICIAL PUBLICATIONS
Archivo General de Indias, Spain: Contaduría and Buenos Aires collections.
Archivo General de la Nación, Uruguay: «Acuerdos del extinguido Cabildo de Montevideo».
Archivo General de la Nación, Uruguay, Archivo Judicial: Civil 1° collection.
Archivo General de la Nación, Uruguay, Ex Archivo General Administrativo: Libro 690.
Supplementary material
The supplementary material for this article can be found at https://doi.org/10.1017/S0212610920000117.
ACKNOWLEDGEMENTS
A former version of this work was presented in the session Prices, Income, Consumption Baskets, and Heights: Living Standards in the Iberian Peninsula and Latin American (16th-20th Centuries) at the XVIII World Economic History Conference held in Boston in 2018. It profited from the valuable comments of, among other colleagues, Rafael Dobado-González, Aurora Gómez-Galvarriato and Daniel Santilli. Valuable advice from the editor of this Journal and the referees also helped to improve this version considerably. The author acknowledges financial support from the National Agency of Research and Innovation and Universidad de la República (Uruguay).


