


«Condemn me, it does not matter: history will absolve me»
Fidel Castro (16 October 1953), closing words of speech delivered at his trial following the Moncada Barracks attack.
1. INTRODUCTION
The Cuban revolution is a defining event in 20th century Latin American history. For six decades, the revolution has fascinated intellectuals and academics producing an immense literature which continues to inspire debateFootnote 1. For the most part, social scientists have neglected the economic consequences of revolutionary ruleFootnote 2. The omission is surprising because to evaluate the successes and failures of Cuban communism, we need to have some notion of how the revolution changed Cuban living standards. One reason why economic questions are absent from the general literature on Cuba is data. Consider the following, we do not have a satisfactory GDP or consumption series for the revolutionary economy. Along similar lines, there is no purchasing power parity (PPP) adjusted GDP comparison for revolutionary Cuba so we have only a rough idea of how Cuban income compares to other economies. In sum, we are ignorant of the most basic contours of the revolutionary economy.
The gaps in our knowledge hamper economic research on Cuba. Two examples should suffice. Jales et al. (Reference Jales, Kang, Stein and Ribeiro2018) provide counterfactuals for the revolutionary economy. As a second example, Bologna Pavlik and Geloso (Reference Bologna Pavlik and Geloso2018) study Cuban healthcare using a similar approach. Both studies suffer from flaws in the existing GDP series.
This article fills in some of the blanks in the economic record. More precisely, I make «controlled conjectures» about Cuban living standards as measured by GDP, and consumption. I also investigate broader measures of capabilities including education and healthcare using the Human Development Index (HDI) of the United Nations. My goal is to place Cuban living standards, defined broadly, in proper comparative perspective. The results are tentative and subject to possibly large margins of error. Yet, I find enough information to render an unequivocal verdict on the Cuban experiment.
The core of the article takes data collected by Pérez-López (Reference Pérez-López1987), the Central Intelligence Agency (henceforth the CIA) de-classified after the Cold War, and many other sources and uses it to construct GDP and consumption indices from 1957 to 1985. I do so by applying to Cuba various approaches developed by Western scholars to measure Soviet GDP. After 1985, I rely on the Cuban national accounts which are partly constructed along western lines. I say partly because Cuban indices differ in important respects from standard measures which require that I adjust the Cuban series to better approximate United Nations procedures.
To provide a GDP series for the six decades of revolutionary rule, I combine my GDP estimates for 1957-1985 with the adjusted Cuban national accounts after 1985. The resulting GDP series trace the evolution of the Cuban economy from initial revolutionary fervour, the rapprochement with the Soviet Union, the «special period» and its long aftermath to the alliance with Venezuela.
The results show disappointing growth. Income per capita fell in the early 1960s and it did not return to pre-revolutionary levels until 1976. From the early 1970s, the economy improves with massive Soviet aid and improved policy. By 1985, GDP per capita was 24 per cent above 1957. The late 1980s turned out to be a high-water mark for Cuba as the collapse of the Soviet Union and the cessation of Soviet aid produced a calamity—a 50 per cent fall in income during the «special period» of the early 1990s. In the aftermath of the special period, it has taken Cuba 30 years to regain the 1980s income peaks. Income per capita for recent years is about 15 per cent higher than the late 1980s—greatly helped by Venezuelan aid.
To sum up, Cuban GDP per capita increased by 40 per cent from 1957 to 2017 yielding an annual growth rate of 0.60 per cent. After 1970, the labour force participation rate increased due to slower population growth and the entrance of women to the labour force for earlier years. As a result, output per worker grows by less than income per capita. For recent years, it is slightly above its 1957 levels. In sum, Cuba has one of the slowest growth rates in the world economy over the six decades of revolutionary rule which means that Cuba has moved sharply down the world income distribution.
One way to grasp the extent of Cuba's relative decline is to compare Cuban living standards to the United States, Europe and Latin America before the revolution to its standing now. I show that Cuba of the late 1950s was, in relative terms, a fairly prosperous middle-income society with consumption on a par with Finland and Ireland and above Spain. Along with Puerto Rico and the Southern Cone, Cuba had the highest income of any Spanish speaking society. For recent years, Cuba is counted with Guatemala among the poor of the Western Hemisphere.
My estimates of Cuban GDP and PPP-adjusted living standards are tentative. More and better data will improve our knowledge. They are unlikely to change the finding that the revolution failed to improve Cuban living standards relative to any plausible counterfactual. Yet to render justice to the Cuban experiment, we must credit the revolution for its achievements in healthcare and education. The final section of the article sets the gains in health, and education against the stagnation in living standards where, following the lead of Prados de la Escosura (Reference Prados de la Escosura2015a, Reference Prados de la Escosura2015b, Reference Prados de la Escosura2019), I apply a broader measure of well-being based on the HDI of the United Nations. Cuba does better in this setting but not by much.
The HDI covers education and health along with income. As currently constituted, the HDI does not allow us to pass judgment on revolutionary Cuba since it does not consider the destruction of civil society and the suppression of basic liberties at the hands of the revolution. Taking such matters into account is a daunting task as economists do not have an accepted framework with which to balance income, health and education against personal freedoms. Even if we did, the Cuban record for health and education is contested and its achievements in these areas depend on the coercive power of the Cuban state. I sidestep these difficulties by applying an approach borrowed from the Cuban economist Carlos Diaz Alejandro (Reference Diaz-Alejandro1973) based, in turn, upon insights associated with John Rawls. The results of this test are conclusive suggesting history will not absolve the revolution, or its guiding light—Fidel Castro.
2. TRACKING GDP AND CONSUMPTION
This section provides new GDP and consumption indices for 1957-1985. In addition, I modify Cuba's western-style national accounts, available at 1985, to bring them more in line with United Nations measures. The final step combines the 1957-1985 GDP series with the modified national accounts to cover the entire period of revolutionary rule. As will be clear, the resulting GDP series is tentative with potentially large errors. They are, however, sufficient for their purpose which is to determine broad trends in income and consumption after the revolution.
For the first three decades of the revolution, the Cuban authorities compiled their national accounts using the Soviet Bloc MPS (Material Product System). The estimates frustrated outside scholars as they were bedevilled by changes in methodology, lapses in publication, opaque documentation and uncertainties about deflationFootnote 3.
2.1 GDP: 1957-1985
Measuring GDP for revolutionary Cuba faces two obstacles. Most fundamentally, Cuban prices are set by planners and are unlikely to reflect resource costs or consumer valuationFootnote 4. A second issue is whether to trust data supplied by Cuba. The scholarly consensus is that the Cuban authorities do not falsify basic data in any systematic fashion. Rather, as Mesa-Lago (Reference Mesa-Lago1969) and Pérez-López (Reference Pérez-López1991) show, data are not published when it might embarrass the authorities. An example of this occurs during the «special period» of the early 1990s when Cuba ceased publication of many series. On the other hand, there is also a consensus that Cuban indices—industrial production, GDP, the CPI, etc.—must be viewed sceptically as they often exaggerate economic performanceFootnote 5. Of course, this tendency is not confined to planned economics but, as shown by Martinez (Reference Martinez2019), appears to hold for autocratic regimes generally.
To get around the first problem, I construct GDP with pre-revolutionary 1957 prices. The resulting measure is conceptually valid as 1957 prices measure resource costs and consumer valuation in an acceptable fashion. On the other hand, early period prices come with a cost as relative prices change with planning. Even if that were not the case, any set of relative prices become outdated after three decades. For future reference, note that 1957 prices will overstate growth through the «Gerschenkron effect» named after the Russian economic historian where early period prices lead to higher measured growth rates as compared to late period pricesFootnote 6. The bias from 1957 prices will therefore exaggerate Cuban growth, perhaps considerablyFootnote 7. For my purposes, however, this is not a serious handicap as I prefer that if a bias exists it overstates Cuban achievements. On the other hand, there are other biases, particularly for industrial production, which will understate growth, so the overall effects are uncertain.
Following the literature on planned economies, I measure Cuban GDP from the output side. Table 1 provides the 1957 value-added weights derived from various declassified CIA reports released after the Cold War (CIA 1968, 1970, 1972), Oshima (Reference Oshima1961) and Ward and Devereux (Reference Ward and Devereux2012). The sub-weights are discussed in the online Supplementary materials.
TABLE 1 GDP WEIGHTS

Sources: See online supplementary materials.
Agriculture and manufacturing dominated the Cuban economy before the revolution with sugar accounting for one half of agriculture and 40 per cent of manufacturing. To obtain GDP, I construct sectoral output indices and aggregate upwardsFootnote 8. The online Supplementary materials provide details. As discussed there, I apply a methodology developed by Nutter (Reference Nutter1962), Moorsteen and Powell (Reference Moorsteen and Powell1966) and Kaplan (Reference Kaplan1969) for the Soviet Union. Following their work, I construct sectoral gross output indices as a weighted average of quantity relatives using base year (1957) shares in value added (or gross output in the case of agriculture) as weights. GDP therefore rests on quantity data. For example, I measure sugar output by tons of sugar, steel by tons of steel and so on. Output data are widely available for Cuba and they are generally accepted by outside scholarsFootnote 9.
Equation [1] gives GDP in 1957 prices for year t where Q(.) is the GDP quantity index, θj is the share of jth sector in 1957 value added, and p and x are prices and quantities.
 $$Q\lpar {\,p^{1957}\comma \;x^t\comma \;x^{1957}} \rpar = \sum {\theta _j^{1957} } x_j^t /x_j^{1957} $$
From 1957 to 1965, I take data from various declassified CIA reports supplemented by Brundenius (Reference Brundenius1984). Data are scarce for 1959 and 1960 due to the chaos in the Cuban statistical system. Things improve somewhat from 1961 to 1965. For example, Brundenius (Reference Brundenius1984) provides some series but their provenance is unknown and should be viewed cautiously. After 1965, more data are available, and I rely on the painstaking work of Pérez-López (Reference Pérez-López1987) supplemented by Locay and Roberts (Reference Locay and Roberts2012) along with the CIA annuals. Pérez-López collects data from a wide variety of sources starting at 1965 and ending at 1982. Locay and Roberts (Reference Locay and Roberts2012) draw on a narrower collection of sources related more to consumption taken mainly from Anuario Estadístico de Cuba, but their data extend to recent years.
As discussed in the online Supplementary materials, the GDP index faces difficult issues of quality change, the introduction of new products and changes in the ratio of value added to gross output in addition to the index number problems discussed earlierFootnote 10. The overall direction of possible biases in GDP is not clear, but they are potentially large.
2.2 The National Accounts 1985-2017
After the fall of the Eastern Bloc, Cuba switched to United Nations national accounting measures, albeit with distinctly Cuban features. The Cuban United Nations-style series start at 1985. They cover GDP from the expenditure and output sides. I focus on the output side measure to be consistent with the GDP index of the last section.
For most sectors, the output indices from the post-1985 national accounts seem to accord with standard United Nations procedures. Two problems remainFootnote 11. First, the authorities publish series with different base year prices and with different United Nations (1968 and 1993) methodologies. In addition, revisions are frequent and large. To date, I found it difficult to construct a consistent series using official publicationsFootnote 12.
Second, and more importantly, there are methodological problems with the Cuban national accounts. First, Cuba does not value government-provided services such as healthcare and education at cost—rather it uses «social valuation» where Cuba calculates the value of goods and services provided by the public sector at Cuban-determined prices (Pérez-López and Mesa-Lago Reference Pérez-López and Mesa-Lago2010).
The second problem is that, starting in the 2000s, Cuba obtains most of its foreign exchange from the export of services in the shape of doctors and other professionals to Venezuela, though Brazil was important to 2018. Cuba appears to count these exports as domestic production in the national accounts despite the fact the professionals are resident outside Cuba and hence revenue from this source might be better counted as factor income from abroad. As discussed in the online Supplementary materials, this biased GDP growth rates upward.
The solution to the first problem is straightforward—the United Nations provides a consistent series using data supplied by the Cuban authoritiesFootnote 13. How the United Nations estimates are constructed is not obvious, but they are probably the best that one can hope for. To solve the second problem, methodological incompatibility, I assume that output in the affected sectors moves with the aggregate of all other sectors. The online Supplementary materials explain and justify this assumption. As it turns out, the revised GDP series shows slower growth rates as compared to the official series as the official index is 20 per cent higher in 2017 than the modified series.
2.3 Growth and the Revolutionary Economy
Figure 1 provides GDP per capita for the six decades of revolutionary rule by combining the new GDP index from 1957 to 1985 and the modified national account GDP series described aboveFootnote 14. Although my focus in this article is on incomes rather than labour productivity, I also provide GDP per worker.

FIGURE 1 GDP PER CAPITA AND PER WORKER—1957 TO 2017 (1957 = 100).
Sources: Author's calculations. The annual series are in the data appendix.
The estimates show that GDP per capita holds up for 1959 and 1960. By 1963, GDP per capita falls by 15 per cent with collectivisation, the U.S. embargo, the exit of managerial and skilled workers and the chaos of the move to planning. There is a further decline in the late 1960s with the fiasco of the ten-million-ton sugar harvest. As a result, GDP per capita is below 1957 until 1976Footnote 15. Growth improves in the 1970s when the Soviet Union steps up aid and Cuba moves to orthodox Soviet-style planning. The economy expands at solid rates until 1985 where income per capita is 24 per cent above 1957. Growth slows after 1985 with the political upheavals associated with the «rectification» program.
I measure output per worker as GDP divided by the economically active population, the labour force, as employment statistics are questionable especially after the special period. The labour force numbers are rough estimates as it is difficult to put together a consistent series after the 1970s. Note that the share of the Cuban population in the labour force increased from the early 1970s as population growth slowed and the labour force participation of women increased up to around 2010Footnote 16. Figure 1 shows that output per worker is constant for the 1980s. By 2017, output per worker was only 5 per cent above 1957 levels, as labour productivity has hardly increased in over six decadesFootnote 17. Soviet assistance is crucial for the improved performance of the 1980s. As shown in the Supplementary materials, Soviet aid increases from 10 per cent of GDP in the early 1960s to 28 per cent in the early 1980sFootnote 18.
The good years for Cuba end when the demise of the Soviet Union halts Soviet aid and sets Cuban enterprises adrift from their Eastern Bloc suppliers. At the same time, the Cuban government was denied access to world capital markets or to loans from the IMF or World Bank. The combination of shocks produced an economic collapse—the «special period». GDP fell by 50 per cent between 1988 and 1993. The official national accounts show a 40 per cent decline.
The recovery from the «special period» is glacially slow as the Cuban economy picks up steam only with aid from Venezuela which starts in the early 2000s. Cuba reaches its 1985 GDP per capita (barely) in 2012. By 2017, GDP is 15 per cent above 1985. Another way of looking at the Cuban record is to observe that GDP per capita in Figure 1 is below 1957 levels for 33 of the 59 years of revolutionary rule.
The GDP growth rates of this article are below Brundenius (Reference Brundenius1984), Pérez-López (Reference Pérez-López1987), Zimbalist and Brundenius (Reference Zimbalist and Brundenius1991) and the Cuban national accounts. To illustrate the differences, I combine Brundenius (Reference Brundenius1984) for 1957-1965, Pérez-López (Reference Pérez-López1987) from 1965 to 1982 and the unadjusted national accounts to 2017. I term this series Alternative I. The second series, Alternative II, substitutes Zimbalist and Brundenius (Reference Zimbalist and Brundenius1991) for Pérez-López (Reference Pérez-López1987)Footnote 19. It shows yet higher growth rates.
Figure 2 compares the earlier GDP series with my estimates. The first series, Alternative I, shows a ratio of income per capita in 2017 to 1957 of 2.35 compared to my estimate of 1.43. The second series, Alternative II, shows a ratio of 3.05, close to the average growth rate among all economies in the Penn World Tables (PWT) for the period.
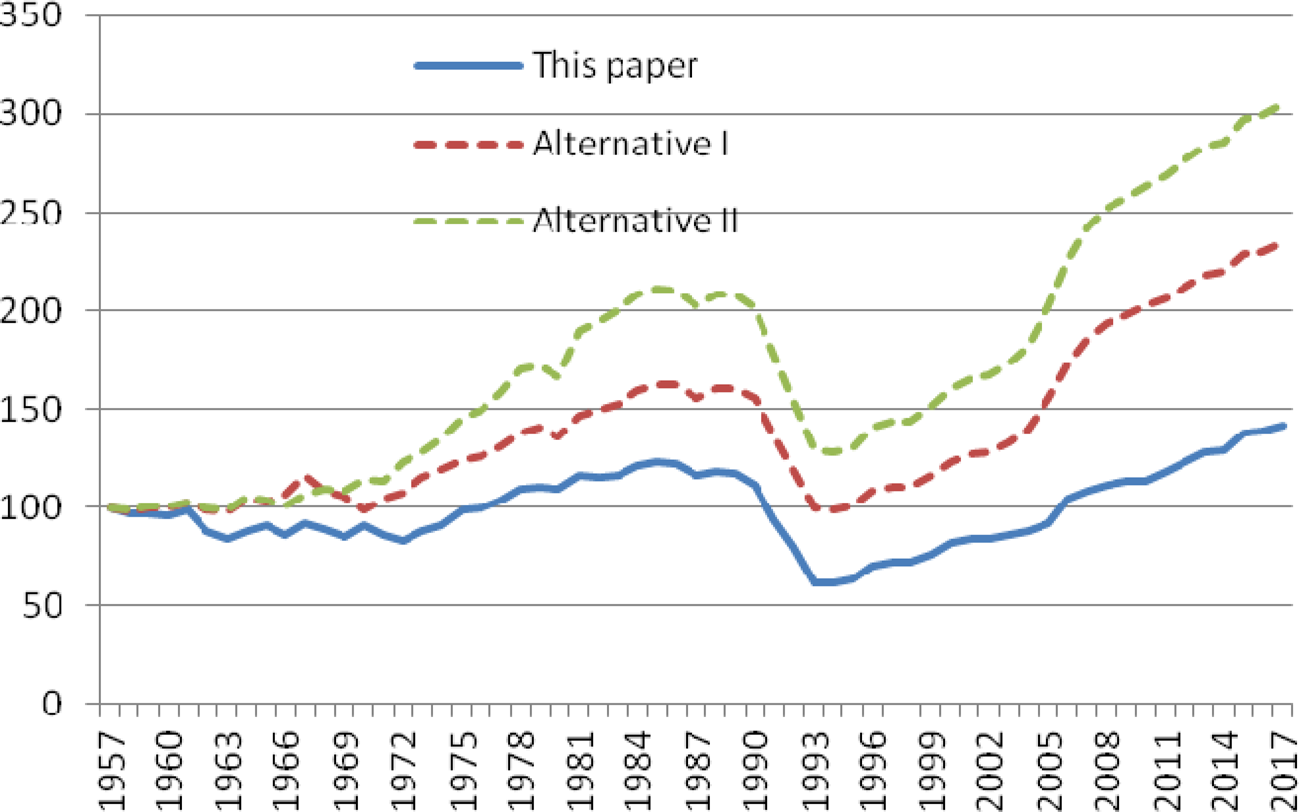
FIGURE 2 GDP PER CAPITA—1957 TO 2017 ALTERNATIVE ESTIMATES (1957 = 100).
Sources: see data appendix for sources. Note for Series I Pérez-López (Reference Pérez-López1987) reaches only to 1982. For 1982 to 1985 I use National Accounts.
Below are growth rates for GDP per capita over sub-periods from the various sources (Table 2):
TABLE 2 COMPARING GROWTH RATES FOR GDP PER CAPITA

Notes: The estimates for Brundenius (Reference Brundenius1984) cover from 1965 to 1981.
The online Supplementary materials (Table A6) reconcile my GDP estimates with earlier series. To summarise, the differences with Pérez-López (Reference Pérez-López1987) arise because he shows higher growth rates for services and agriculture while omitting slow-growing sectors such as housing. In addition, I show that industrial production growth from Brundenius (Reference Brundenius1984) and Zimbalist and Brundenius (Reference Zimbalist and Brundenius1991) is too high. They also rely on flawed official Cuban indices for other sectors which further overstates growthFootnote 20. Finally, and as mentioned earlier, the official national accounts since 1985 exaggerate growth for health, education and government services.
The implausibility of earlier GDP series can be seen in a simple fashion. Suppose that some version of the alternate GDP series is correct. From Figure 2, GDP per capita for 1993, the worst year of the «special period», is equal to 1957 using Alternative series I and is 30 per cent above 1957 using Alternative series II. These results are close to impossible. After all, Cuba experienced terrible hardships during the «special period». Calories were below 2,000 (Sixto Reference Sixto2002) as Cuba came close to mass starvation. The crisis decimated public transportation and public utilities. Cars disappeared from the streets. Sales of clothing and consumer durables ceasedFootnote 21. Thus, it is hard to see how GDP per capita for 1993 could be above the relatively prosperous late Republic. In contrast, my estimates for 1993 show income per capita is 40 per cent below 1957—consistent with what we know about the special period.
To summarise, Cuba has grown at slow rates since the revolution. To put the Cuban record into comparative perspective, I turn to Version 9.0 of the PWT which provides data on GDP per capita for 110 economies from 1960 and 2014Footnote 22. From 1960 to 2014, Cuban GDP per capita increases by 36 per cent using the GDP index of this articleFootnote 23. For Taiwan and Korea, GDP increased by multiples of fifteen. For Spain and Portugal, income increased fourfold. For most developing economies, income increased three to fourfold. For the United States, income per capita trebled. For slow-growing economies such as Argentina and Uruguay, income per capita doubled. In terms of growth rates, Cuba comes in at 100 out of the 111 casesFootnote 24. In short, revolutionary Cuba has an exceptionally poor economic record.
2.4 Consumption
There are three reasons to consider consumption separately from GDP. First, the consumption estimates are largely independent of the GDP measures of the last section. Second, consumption is more closely related to welfare than GDP. Finally, consumption avoids some of the difficult conceptual problems associated with Cuban GDP. Most notably, consumption is not distorted by terms of trade changes and it better reflects the receipt of Soviet aid.
I measure consumption from 1957 to 1985 using 1957 prices. Throughout, I follow the procedures developed by CIA analysts in their work on Soviet consumption (Schroeder and Denton Reference Schroeder and Denton1982). The consumption index consists of quantity relatives weighted by base year shares in consumption. I create the sub-indices using quantities such as food measured in kgs, passenger kms for travel, etc. Data are mostly from the sources used for the GDP index.
I provide two measures of consumption, household consumption which is spending by households and total consumption which adds publically supplied education and healthcare to household consumption.
Figure 3 traces the series for consumption per capita from 1957 to 1985.
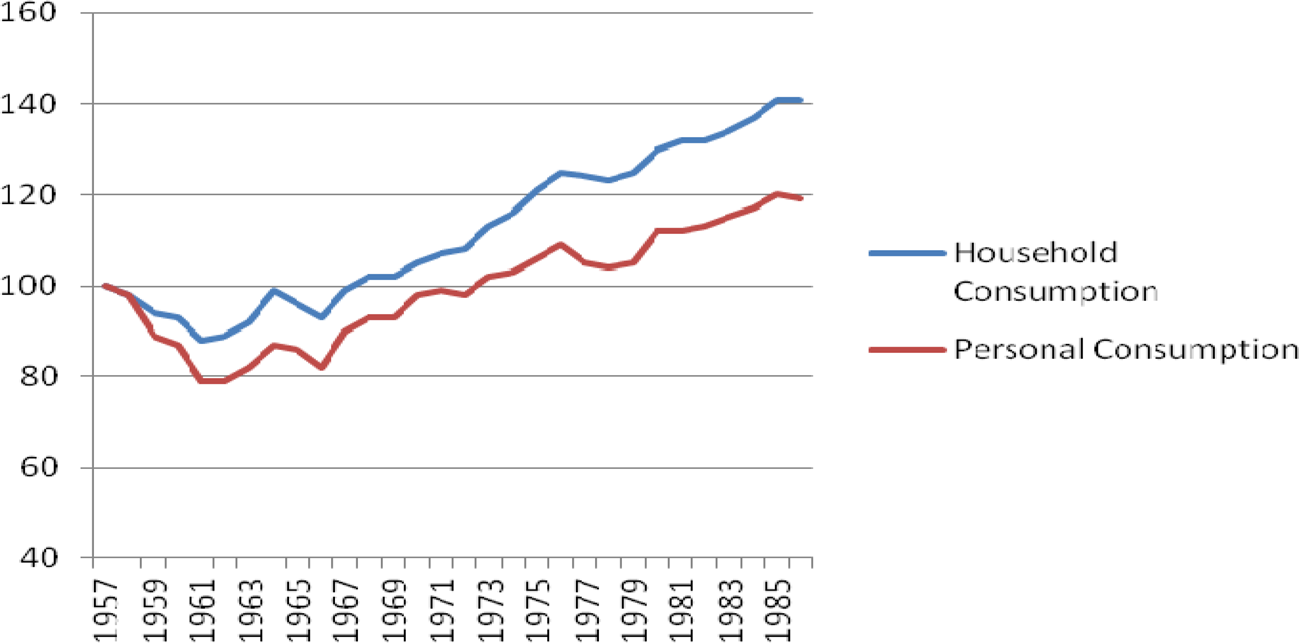
FIGURE 3 CONSUMPTION PER CAPITA—1957 TO 1985.
Sources: Author's calculations. The annual series are in the data appendix.
The results differ from GDP. Household consumption drops by 20 per cent in the early 1960s compared to a 15 per cent drop for GDP as the revolutionary authorities increase investment and government spending at the expense of consumption. It recovers its 1957 levels by 1973 and increases thereafter. Household consumption peaks in 1985 where it is 20 per cent above the late republic. As discussed in the online Supplementary materials, the increase in personal consumption is largely underwritten by Soviet aidFootnote 25.
The improvements in household consumption understate consumer well-being as Cuba increased spending on healthcare and, especially, education after the revolution. Including education and healthcare, total consumption falls by 12 per cent in the early 1960s. Moreover, total consumption is back to its 1957 levels by 1968. By 1985, it is 40 per cent above 1957.
The official series for consumption begins in 1985. I was unable to modify the national accounts to provide a useable series for consumption after 1985. But there is little reason to suppose that the performance of consumption differs much from income.
To sum up, Cuba has seen anaemic GDP growth over the 60 years of the revolution. Slow growth means that revolutionary Cuba has slipped down the world income distribution. The next section makes this point directly.
3. AN EUROPEAN MIRROR
I compare Cuban income and consumption to the outside world for 1955 and 2011. The comparisons sharpen the picture of Cuba's relative decline. They also provide an independent estimate of Cuban growth. Finally, they are a vital ingredient to the broader welfare comparisons, covering education, health and personal liberties, that follow.
As a standard, I compare Cuba to Iberia and Latin America. I also compare Cuba to Western Europe. The European mirror brings into sharper focus the fact that Cuba and the Southern Cone once shared similar living standards with middle-income European economies. Finally, the advanced economies of Europe were once the countries to which Republican Cuba aspired (Speck Reference Speck2005).
3.1 The Comparisons
I compare income and consumption. I chose 1955 as this year has the widest coverage prior to the Cuban revolution while 2011 is the latest round of the International Comparison Program (ICP). The comparisons cover thirty-eight countries. There are three sources for 1955. The high-quality estimates of Gilbert and Kravis (Reference Gilbert and Kravis1954, Reference Gilbert and Kravis1958) cover the major European economies. Latin America is from Braithwaite (Reference Braithwaite1968) and is of somewhat lower quality. Dewhurst et al. (Reference Dewhurst, Coppock and Yates1961) provide rough estimates for other European economies prepared for, but not reported in, Gilbert and Kravis (Reference Gilbert and Kravis1958). In addition, I use Bergson (Reference Bergson and Daly1972) for the Soviet Union. For Cuba, I use the Ward and Devereux (Reference Ward and Devereux2012) estimate for 1955.
For 2011, I use ICP estimates with the exception of Puerto Rico and Cuba. My source for Cuban 2011 PPP-adjusted income per capita is the United Nations Human Development Report (HDRO). The HDI report puts 2011 Cuban GNI per capita at $6,821. This is one-half of Costa Rica ($14,006) and is below Jamaica ($8,350). As discussed in section 4 of the online Supplementary materials, it may overstate Cuban income. Again, if there is a bias, I prefer it to work in the direction of overstating Cuban incomeFootnote 26. For both years, Puerto Rico is from Devereux (Reference Devereux2019)
I compare income using GDP rather than GNI as I do not have GNI for 1955. There are, however, three countries where I use GNI: Cuba, Puerto Rico and Ireland. GNI makes more sense because of large factor income outflows for Ireland and Puerto Rico and inflows for Cuba. I discuss the relationship between GDP and GNI for Cuba in section 6 of the online Supplementary materials. Finally, all comparisons compare income using the relative prices of the comparison yearFootnote 27. The 1955 comparisons are bilateral Fisher Ideal indices while the 2011 ICP comparisons are generalised Fisher Ideal indices.
As we might expect, the United States has a commanding lead for 1955. Western European income/consumption averages 50-60 per cent of U.S. levels. Next are the middle-income economies, Argentina, Cuba, Puerto Rico and Uruguay in Latin America and Ireland, Finland, and Italy in Europe. For these economies, income/consumption is 30-35 per cent of the United States, that is, 60-70 per cent of Western Europe.
At 35 per cent of the United States, Cuban consumption for 1955 equals Ireland. It exceeds Italy, Greece, Spain and Portugal in Europe. It is close to Austria and the Netherlands. Thus, Cuba shares with Puerto Rico and the Southern Cone the highest consumption level for Spanish-speaking societies.
The 1955 Cuban ranking is not controversial. Oshima (Reference Oshima1961), for example, provides an early PPP-adjusted measure of Cuban GDP for 1953 which placed Cuban income levels at those of ItalyFootnote 28. Using a «short cut» methodology, Locay (Reference Locay2009) also reached similar rankings to Table 3. Finally, contempory observers for the 1950s saw the island as a middle-income economyFootnote 29.
TABLE 3 GDP AND CONSUMPTION PER CAPITA—1955 AND 2011 (United States = 100)

Notes and Sources: The table compares real income and consumption using current prices. I use GDP per capita to measure income for all countries except Cuba, Ireland and Puerto Rico in 2011 where I replace GDP with GNI. The 1955 comparisons are Fisher Ideal comparisons of income and consumption while 2011 is a multilateral generalisation of the Fisher Ideal called the Elteto Koves and Szulc (EKS) index. The 1955 benchmarks are from Ward and Devereux (Reference Ward and Devereux2012) with the following exceptions. For Puerto Rico, I use Devereux (Reference Devereux2019). For Austria, Finland, Greece, Ireland, Spain, Sweden, Switzerland and Portugal, I use Dewhurst et al. (Reference Dewhurst, Coppock and Yates1961). For Cuba in 2011, I use the UN Human Development Report estimates. This relates to GNI. I assume that it also holds for relative consumption. I take the 2011 results from http://siteresources.worldbank.org/ICPEXT/Resources/ICP_2011.html, as data necessary to calculate the Fisher Ideal for 2011 are not available. Argentina is not in the 2011 ICP and I take income from the UN HDI where I assume relative income equals consumption. The final column gives the ratio of Cuban GDP per capita in 2011 to 1955 as implied by the GDP comparisons and growth rates from the Penn World Tables where I measure growth using the rgdpe measure which is expenditure-side real GDP at chained PPPs (in US$2011 million). I use rgdpna which is real GDP at constant 2011 national prices (in US$2011 million) for Argentina and El Salvador for reasons explained in the text.
By 2011, Norway leads in income while the United States leads in consumption. The Western European economies have partly caught up to the United States while Spain and Ireland are closer to the European leaders. For Cuba, the striking feature of Table 3 is relative decline. Cuba is no longer a middle-income economy and income per capita equals Guatemala or Paraguay. Thus, Cuba has fallen behind Greece, Spain and Ireland, Portugal and most of Latin America. Indeed, the only remaining Latin economies with lower incomes are Bolivia, Honduras and Nicaragua.
3.2 Implied Growth Rates
The series for Cuban GDP of the last section are tentative with unknown, but potentially large, margins of error. Fortunately, Table 3 provides a crosscheck. Suppose for the moment, that the income comparisons in Table 3 are without error and that all comparisons are transitive. It is easy to show that if we know relative Cuban income in 1955 and 2011 and if we have a GDP series for each partner country, then we can calculate an implied Cuban GDP growth rate which can cross-check the results of previous sections.
To see how this works, take Uruguay. For 1955, the ratio of income per capita for Uruguay to Cuba from Table 3 is 1.25. For 2011, the ratio is 2.5. Using the PWT, the ratio of Uruguayan GDP per capita in 2011 to 1955 is 2.29. A simple calculation shows that the implied ratio of Cuban GDP per capita in 2011 to 1955 is 1.15 as compared to a ratio of 1.34 using the Cuban GDP series of the last sectionFootnote 30.
There are thirty-eight comparisons in Table 3. The PWT provides GDP series for thirty-five of these economies yielding thirty-five implied Cuban growth rates in the final column of Table 3Footnote 31. The results show some differences in implied growth rates as the standard deviation of the comparisons is 0.32. This is expected given the complexities of comparing GDP over time and across spaceFootnote 32. On the other hand, we expect errors in the comparisons to partly offsetFootnote 33. The point is that Cuba does poorly in all comparisons. At the extremes, Nicaragua implies a Cuban income ratio of 0.57 while Austria has an implied income ratio of 1.95. Thus, upper and lower bounds imply glacially slow growth by international standards.
To summarise, I define the implied growth rate of Cuban GDP per capita from 1955 to 2011 (Gc) as the simple average of implied growth rates from all possible calculations (gc,i) in Table 3.
 $$G_c = 1/n\sum {g_{c\comma i}} $$
Across all comparisons, the ratio of implied Cuban GDP per capita for 2011 to 1955 is 1.23Footnote 34. The GDP series of the last section implies a ratio of 1.34 for Cuban income in 2011 to 1955. The close correspondence while pleasing is coincidental. More generally, one should interpret the results as being consistent with claims of slow Cuban growth. Of course, a lower estimate of relative Cuba income for 1955 in Table 3 or a higher estimate for 2011 will change the results but it is unlikely to change them by much since the 1955 comparison is conservative and the 2011 comparison likely overstates income.
Once we accept that income growth since the revolution is, at best, mediocre then the case for the revolution rests on healthcare and education.
4. CAPABILITIES
Well-being does not depend solely on income or consumption. Accordingly, this section enlarges the discussion to include healthcare and education. One measure of health is life expectancy. Cuban life expectancy is impressive (79 years for 2011) given its low income. The island also performs well on measures of educational attainment such as average years of education. The broader comparisons turn out to improve Cuba's standing for 2011, but not by much.
The most widely accepted broad measure of development is the HDI of the United Nations where the HDI measures «capabilities» by considering education and health in addition to income. The HDI is the geometric index, given by equation [3], of income (Y) as measured by Gross National Income (GNI), health as given by life expectancy (H) and education given by average years of education (E) and expected years of education (not included).
 $${\rm HD}{\rm I}_i = \lpar {{\rm Y}.{\rm H}.{\rm E}} \rpar ^{1/3}$$
The UN scales the sub-indices to ensure they are bounded between zero and one using the transformation of the ith element given by [4].
 $$\eqalign{&{\rm Inde}{\rm x}_i = \lpar {{\rm Actual}\,{\rm Valu}{\rm e}_i\ndash {\rm Minimum}\,{\rm Valu}{\rm e}_i} \rpar /\cr&\lpar {{\rm Maximum}\,{\rm valu}{\rm e}_i\ndash {\rm Minimum}\,{\rm Valu}{\rm e}_i} \rpar} $$
I use the HDI as my organising framework. To begin, I provide standard HDI measures for 2 years, 1955 and 2011, for the economies of the last sectionFootnote 35. As mentioned, I lack GNI for 1955 so I use GDP. For 2011, I measure income with GNI for Cuba, Ireland and Puerto Rico for reasons explained earlier. In addition, I use average years of education only as expected years of education are not available for 1955. Finally, I follow the United Nations by measuring income using logs. I will return to this assumption later.
Table 4 provides the HDIs for 1955 and 2011. To ease interpretation, I give rankings from the highest to the lowest. For 1955, the United States leads followed by Western Europe. Cuba is a respectable twentieth of thirty-eight economies. It trails Uruguay and Argentina in Latin America—principally because Cuban life expectancy (62.3) is below Uruguay (67) and Argentina (64.5)Footnote 36.
TABLE 4 CUBA AND HUMAN DEVELOPMENT—1955 AND 2011
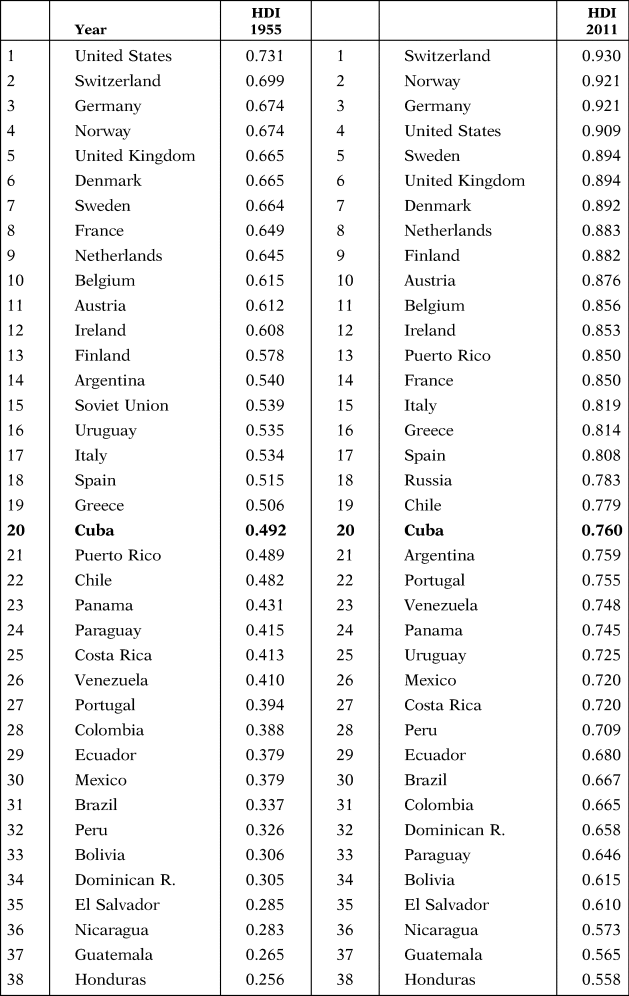
Notes and Sources: The table compares income from Table 3 by using U.S. GDP per capita from the PWT to scale the results. Life expectancy and average years of education for 1955 are from the Clio website at https://clio-infra.eu/. Life expectancy and years of education for 2011 are from the UN HDI dataset at: http://hdr.undp.org/en/content/human-development-index-hdi. For Puerto Rico, I use Devereux (Reference Devereux2019).
The Cuban standings for education and life expectancy for 1955 were lower than its income would suggest. By 2011, the opposite holds. Cuban life expectancy at 79 equals the United States. It is above Latin America except Costa Rica. Cuba (11.3) also leads Latin America in years of education except for Puerto Rico (13). Indeed, Cuba ranks higher than Portugal (7.8) or Spain (8.5). The Cuban outcomes for health and education are therefore characteristic of a wealthy society—impressive for a poor island. For 2011, Cuba ranks third in the index for Latin America below Puerto Rico (13th!) and a little behind Chile. It is above Portugal. These findings are similar to Prados de la Escosura (Reference Prados de la Escosura2015a) who found Puerto Rico and Cuba with the highest human development for Latin AmericaFootnote 37.
Can education and health rescue the revolution? Not necessarily. There are four objections to the Cuban HDI rankings. First, there are questions about Cuban healthcare and education. For healthcare, Gonzalez (Reference Gonzalez2015) makes a persuasive case that biased reporting reduced measured Cuban infant mortality rates hence overstating life expectancy, perhaps by a year or so. Even making this adjustment, Cuba does well relative to Latin America. If life expectancy is overstated by 2 years, an upper bound, then the Cuban ranking for 2011 falls to 21. On the positive side, Cuba provides access for all Cubans to basic healthcare without racial or income disparities and most scholars accept that the gains in healthcare are realFootnote 38.
For education, the Cuban performance at the elementary level at first glance is excellentFootnote 39. Most notably, UNESCO (2008) shows that Cuba had the highest third and sixth grade math and reading scores for Latin America and the Caribbean which has impressed many observers. But recent work by Peterson (Reference Peterson2020) has gone some distance to undermining these results. In addition, the evidence for high school and college education is mixed. Universities lack proper facilities with poor libraries, few textbooks and little connection to the Internet. The quality of instruction is also questionable. On the other hand, Locay and Devereux (Reference Locay and Devereux2018) use U.S. labour market outcomes to provide evidence on Cuban educational quality which suggests that the quality of education is at least equal to the late Republic.
Second, it might be argued that we should compare the revolutionary outcomes to the counterfactual of what would have occurred had the Republic survived. Income per capita would surely be higher in the absence of revolution. Sceptics might also claim that health might not be much different given the well-developed Cuban health system of the 1950s as evidenced by the low levels of infant mortality in Republican Cuba (McGuire and Frankel Reference McGuire and Frankel2005)Footnote 40. For education, I suspect that the arguments for the revolution are stronger—at least at the primary level. It should also be kept in mind that the revolutionary state likely realised the gains in education and health sooner than would alternative governments and that it also allowed better access to disadvantaged groups such as Afro-Cubans and the rural poor.
Third, the HDI results require diminishing returns to income. As the United Nations states:
The idea is to emphasize the diminishing marginal utility of transforming income into human capabilities. This means that the concave logarithmic transformation makes clearer the notion that an increase of GNI per capita by $100 in a country where the average income is only $500 has a much greater impact on the standard of living than the same $100 increase in a country where the average income is $5,000 or $50,000Footnote 41.
There is, to be sure, empirical support for diminishing marginal utility of income, (Layard et al. Reference Layard, Mayraz and Nickell2008). One might, however, use the same argument for education and for health as measured by longevity. One extra year of education, when average years of education are four, is likely to have a larger impact on capabilities compared to where average years of education are fifteenFootnote 42. Yet, the HDI requires diminishing returns to income as without it, income dominates the rankings. Suppose that per capita income is an input that produces capability. It follows that per capita income enters the index at a declining rate since its return in terms of capabilities must diminish as education and health are boundedFootnote 43. In what follows I assume diminishing returns as without it capabilities do not matter.
The final, and in my view the most important, objection to the HDI for Cuba is that it ignores personal freedoms. Over its six decades, revolutionary Cuba has exercised close control over its citizens at the block and household level working through local Committees for the Defense of the Revolution and its large and well-funded security forcesFootnote 44. Revolutionary Cuba remains a society where dissent is criminalised, and where the authorities enforce compliance with the dictates of the state apparatus. Moreover, the Cuban institutions also appear to be outliers in their all-encompassing natureFootnote 45.
A further complicating factor is that the reduction in Cuban inequality for the first decades of the revolution along with the improvements in health and education owes much to the regimes ability to control the behaviour of its citizens through harsh coercive means. One way to see this is with healthcare where the Cuban successes for life expectancy are partly due to the astonishing number of Cuban doctors. Any relaxation in the power of the state will lead to an outflow of doctors to countries where they are better paid. A more controversial question is whether the Cuban authorities reduced infant mortality through forced abortions and the confinement of expectant mothers in maternity homesFootnote 46. If the high Cuban levels of education and health depend on coercion, many of the achievements of the revolution will perish with relaxation in state control.
Suppose personal freedom is as important for human capabilities as income, education and healthcare. The HDI becomes [5] where F measures personal freedoms and where HDI II refers to the extended HDIFootnote 47.
 $${\rm HDI}\,{\rm II} = \lpar {{\rm Y}.{\rm H}.{\rm E}.{\rm F}} \rpar ^{1/4}$$
There is no agreement on how to measure personal freedom and many possible measures exist. I prefer the Heritage Foundation index of economic freedom as it encompasses economic and personal freedoms. The choice is debatable. Yet, the results will not change using alternative indices as Cuba scores low on allFootnote 48. To show this, I also use the Freedom House index of political rights. The Supplementary materials (Table A10) provide the results using a third measure—the Polity index.
Table 5 provides the 2011 results with the extended HDI. The first panel gives the results with the Heritage index as HDI IA while the second panel HDI IB gives the Freedom House results. In each case, Puerto Rico leads Latin America. As we might expect, Cuba does poorly. It comes in at 34 out of 38 using the Heritage index. The only countries below Cuba are Guatemala, Bolivia, Honduras and Nicaragua. Cuba is last using the Freedom House index.
TABLE 5 HUMAN DEVELOPMENT FOR 2011 INCLUDING FREEDOM

Notes: The first panel uses the Heritage index obtained at https://www.heritage.org/index/. The second panel gives the freedom house results using the index for 2014 at https://freedomhouse.org/.
5. THE VERDICT OF HISTORY
Progressive circles hailed the Cuban revolution in the belief it would raise living standards for the Cuban masses. Over the succeeding decades, these hopes have fadedFootnote 49. Unlike the twenty-fifth anniversary of the revolution, nowadays one hears few positive evaluations of the Cuban economy. The reason is straightforward. Before the revolution, Cuba was a prosperous economy by the standards of its time. Six decades later, it is one of the poorest economies in Latin America. In short, the revolution impoverished Cubans at least in a relative and perhaps in an absolute sense. Given the high expectations that greeted its birth, the economic record of the revolution is profoundly disappointingFootnote 50.
The case for the regime therefore rests on health and educationFootnote 51. Cuban life expectancy is impressive given current Cuban income levels. The Island also performs well on some educational outcomes. These achievements are real. But to evaluate the revolution along these dimensions, we must compare the revolutionary outcomes to the counterfactual of what would have occurred had the Republic survived. Any counterfactual which attempts to chart the progress of Cuban income, education and health over the six decades after the revolution is fraughtFootnote 52. Even if we could construct such counterfactuals, there is no agreement how to incorporate personal freedoms into broader measures of development.
Fortunately, there is a way to render a verdict on the Cuban experiment that avoids such intractible problems. Four decades ago, the distinguished Cuban economist Carlos Diaz Alejandro (Reference Diaz-Alejandro1973, p. 91) showed how to evaluate the effects of the Cuban revolution on the welfare of Cubans without a counterfactual. Drawing on the insights of John Rawls, he suggested the following thought experiment: «Consider a mental experiment in which one is to choose where to be reborn as a new baby, but without knowing where that miracle will occur in a rich or poor family in city or country…. Would one choose Guatemala, Brazil or Cuba?».
His choice was Cuba. The problem with his choice lies in his comparison countriesFootnote 53. To see why, suppose the comparison is done today and countries on the list are Cuba on the one hand and Chad and the Central African Republic on the other, then the choice would surely be Cuba. The result tells us less about Cuba than it does about the poverty of the comparison countries. Similarly, suppose the choice is between Cuba and Latin American economies that currently score low on the HDI of Table 4, Honduras, Guatemala or Nicaragua. It is again possible for the choice to be Cuba. A better approach is to restrict comparisons to countries with similar initial conditions before the Cuban revolution. From Tables 3 and 4, the relevant comparisons are Argentina/Chile/Uruguay/Puerto Rico-Cuba or Italy/Spain-Cuba or Ireland/Finland-Cuba. It is hard to see how Cuba could be preferred in any of these comparisons. Thus, history is more likely to condemn than to absolve the Cuban revolution.
SUPPLEMENTARY MATERIAL
The supplementary material for this article can be found at https://doi.org/10.1017/S0212610920000233.
ACKNOWLEDGEMENTS
I am grateful to the editor and to the referees for suggestions which greatly improved this article. I also received helpful comments from Roger Betancourt, Ernesto Hernández-Catá, Vincent Geleso and the participants at the annual meetings of the American Economic Association ASCE session. Finally, I especially thank Jorge Pérez-López, Luis Locay and Bryan Roberts for sharing their data.


