


Introduction
Rapid changes in agricultural environments are placing increased demands on farmers. In order to respond to these demands, farmers need to manage their crop systems by reducing risk, while increasing food production with a balance between crop production and environmental preservation, while still retaining management flexibility. In order to achieve this balance, it is necessary to meet the demands for food and energy without compromising existing agroecosystems (Godfray et al., Reference Godfray, Beddington, Crute, Haddad, Lawrence, Muir, Pretty, Robinson, Thomas and Toulmin2010). Agroforestry systems have the potential to meet these objectives.
Agroforestry systems consist of integrated land use for forestry, crop and/or livestock purposes; these factors provide clear agroecological advantages over conventional systems (Brooker et al., Reference Brooker, Bennett, Cong, Daniell, George, Hallett, Hawes, Iannetta, Jones, Karley, Li, McKenzie, Pakeman, Paterson, Schöb, Shen, Squire, Watson, Zhang, Zhang, Zhang and White2015). Advantages include higher production per unit of land (Zhang et al., Reference Zhang, Van der Werf, Zhang, Li and Spiertz2007; Li et al., Reference Li, Sun, Wei, Christie, Zhang and Li2011), greater water and nutrient efficiency use (Vandermeer, Reference Vandermeer1989, Reference Vandermeer2011), greater carbon sequestration in the soil (Makumba et al., Reference Makumba, Janssen, Oenema, Akinnifesi, Mweta and Kwesiga2006; Cong et al., Reference Cong, Hoffland, Li, Six, Sun, Bao, Zhang and Van der Werf2014), and an increased input of organic matter, which has been shown to improve chemical, physical and the biological properties of soil (Tracy and Zhang, Reference Tracy and Zhang2008; Salton et al., Reference Salton, Mercante, Tomazi, Zanatta, Concenço, Silva and Retorea2013). Agroforestry systems can provide continuous benefits or only benefits for a certain period of time; benefits depend on management practices, locations and species included in the system.
Intercropping is the dominant agricultural strategy in many parts of the world, i.e., sub-Saharan Africa and large parts of Latin America, and intercropping systems provide an estimated 20% of the world's food supply (Altieri, Reference Altieri2009; Chappell et al., Reference Chappell, Wittman, Bacon, Ferguson, Barrios, Barrios, Jaffee, Lima, Méndez, Morales, Soto-Pinto and Vandermeer2013). Despite improvements in monocrop systems and the great potential of intercropping, little research has been carried out to determine the traits of cultivated species that drive the positive effects seen in intercropping systems; therefore, it can be seen that novel research involving intercropping systems in Brazil is especially relevant in the context of global food production.
Brazil is one of the primary sugarcane-producing countries in the world, with estimates of 8.97 million hectares of planted area in 2015/2016, which produced 685 million Mg of sugarcane and resulted in an average yield of 76 Mg ha−1 (Conab, 2016). Sugarcane (Sacharum officinarum L.) monocropping has had a great socio-economic and environmental impact in Brazil; agroforestry systems have been considered as an alternative for sustainable production in threatened ecosystems. In addition to a lack of research into intercropping systems described above, there has specifically been little work to assess yield traits and sugarcane juice quality in these systems.
In the planning of an agroforestry system, the choice of tree arrangement is essential to the success of a production system. Tree arrangements should consider tree use, future tree growth and the resource requirements of the trees and crops to be incorporated in an intercropped system (Binkley et al., Reference Binkley, Stape and Ryan2004; Kruschewsky et al., Reference Kruschewsky, Macedo, Venturin and Oliveira2007; Rozados-Lorenzo et al., Reference Rozados-Lorenzo, Gonzalez-Hernandez and Silva-Pando2007; Prasad et al., Reference Prasad, Korwar, Rao, Mandal, Rao, Rao, Ramakrishna, Venkateswarlu, Rao, Kulkarni and Rao2010). In reduced tree arrangements, tree spacing with greater relative proximity between trees (i.e., higher number of trees per unit area), the tree interferes in the crops cultivated in the understory due to greater interception of solar radiation by the tree canopy as well as due to increased competition for water and nutrients. Competition is one of the major factors that has a negative impact on the yield of intercropping systems (Caballero et al., Reference Caballero, Goicoechea and Hernaiz1995; Li et al., Reference Li, Sun, Wei, Christie, Zhang and Li2011). Larger tree arrangements (those more widely spaced) encourage a healthy association with the crops (Dubè et al., Reference Dubè, Couto, Silva, Leite, Garcia and Araújo2002; Prasad et al., Reference Prasad, Korwar, Rao, Mandal, Rao, Rao, Ramakrishna, Venkateswarlu, Rao, Kulkarni and Rao2010). It is therefore that the production of the tree components and crops should be considered as a whole in order to define the most ideal tree arrangement and to provide greater yields and improve the quality of crops cultivated in the understory, as well as greater growth rates of the forest species.
To determine the sustainability of an agroforestry system, an understanding of environmental factors and plant interactions is essential (Berlyn and Cho, Reference Berlyn, Cho, Ashton and Montagnini2000; Ong et al., Reference Ong, Black, Wallace, Khan, Lott, Jackson, Howard and Smith2000). Tree–crop interactions can be regulated effectively and interspecies competition can be minimized by employing efficient tree arrangements (Ghezehei et al., Reference Ghezehei, Annandale and Everson2016) and by selecting compatible species (Bayala and Wallace, Reference Bayala, Wallace, Ong, Black and Wilson2015; Ong and Kho, Reference Ong, Kho, Ong, Black and Wilson2015).
In agroforestry systems, it is important to consider the characteristics and benefits of the two intercropped species. Tung trees (Aleurites fordii) are a good potential candidate for use in agroforestry systems because of the species’ unique growth characteristics, which can lead to the improved cultivation of crops grown in its understory. The unique chemical properties of tung seed oil make it one of the best known industrial ‘drying oils’. Phytochemical research into A. fordii have led to the identification of various compounds including coumarins, diterpenoid esters, oils, sterols and tannins as chemical constituents (Chen et al., Reference Chen, Chen, Chang and Chang2010). In addition, tung oil is currently used in paints, high-quality printing, plasticizers, in certain types of medicines and chemical reagents (Park et al., Reference Park, Kim and Wang2008; Pei et al., Reference Pei, Kim, Kang, Lee, Kim, Song and Oh2012) and biodiesel production (Dyer et al., Reference Dyer, Chapital, Kuan, Shepherd, Tang and Pepperman2004; Chen et al., Reference Chen, Chen, Chang and Chang2010).
Different tree arrangements in agroforestry systems can influence sugarcane traits, such as yield and juice quality due to the competition of existing resources (Muller et al., Reference Muller, Paciullo, Martins, Rocha and Castro2014) such as solar radiation (Elli et al., Reference Elli, Caron, Paula, Eloy, Schwerz and Schmidt2016a, Reference Elli, Caron, Eloy, Behling, Souza and Schwerzb). In the case of sugarcane (C4 metabolism), the response due to reduced radiation within the canopy can be maximized; in this context, the evaluation of yield components is an important step in understanding the response of plants under intercropped conditions. It is also necessary to analyze how many years of cultivation are possible in agroforestry and monocrop systems; in this case, the response of the productive capacity of sugarcane.
In addressing this lack of information, the following hypotheses were created: (1) sugarcane cultivated in intercropping systems presents a sugarcane yield and juice quality equal or greater to that of sugarcane produced in monocropping systems; and (2) the number of sugarcane harvests in intercropping or monocropping systems should not exceed five harvests. The aim of this study was to evaluate yield components and the juice quality of five sugarcane crop years cultivated in the understory of A. fordii, in two intercropping systems and one monocropping system.
Materials and Methods
Study area
The field experiment was conducted from November 2011 to June 2016 in the city of Frederico Westphalen—Rio Grande do Sul, Brazil, at the coordinates 27°23′48″S, 53°25′45″W and an altitude of 490 m (Fig. 1). According to the Köppen climate classification, the climate is Cfa, i.e., humid subtropical with mean annual temperatures of 19.1°C and varying maximum and minimum temperatures of 38 and 0°C, respectively (Alvares et al., Reference Alvares, Stape, Sentelhas, Moraes, Leonardo and Sparovek2013). The soil of the experimental area was classified as typical Entisol Orthents. Fertilization was carried out according to a soil analysis and following recommendations for sugarcane crops (CQFS, 2004). The application of nitrogen (N) was carried out 90 days after planting and after each cut (cane-ratoon) in amounts ranging from 100 to 140 kg ha−1 of N for each cane cycle.
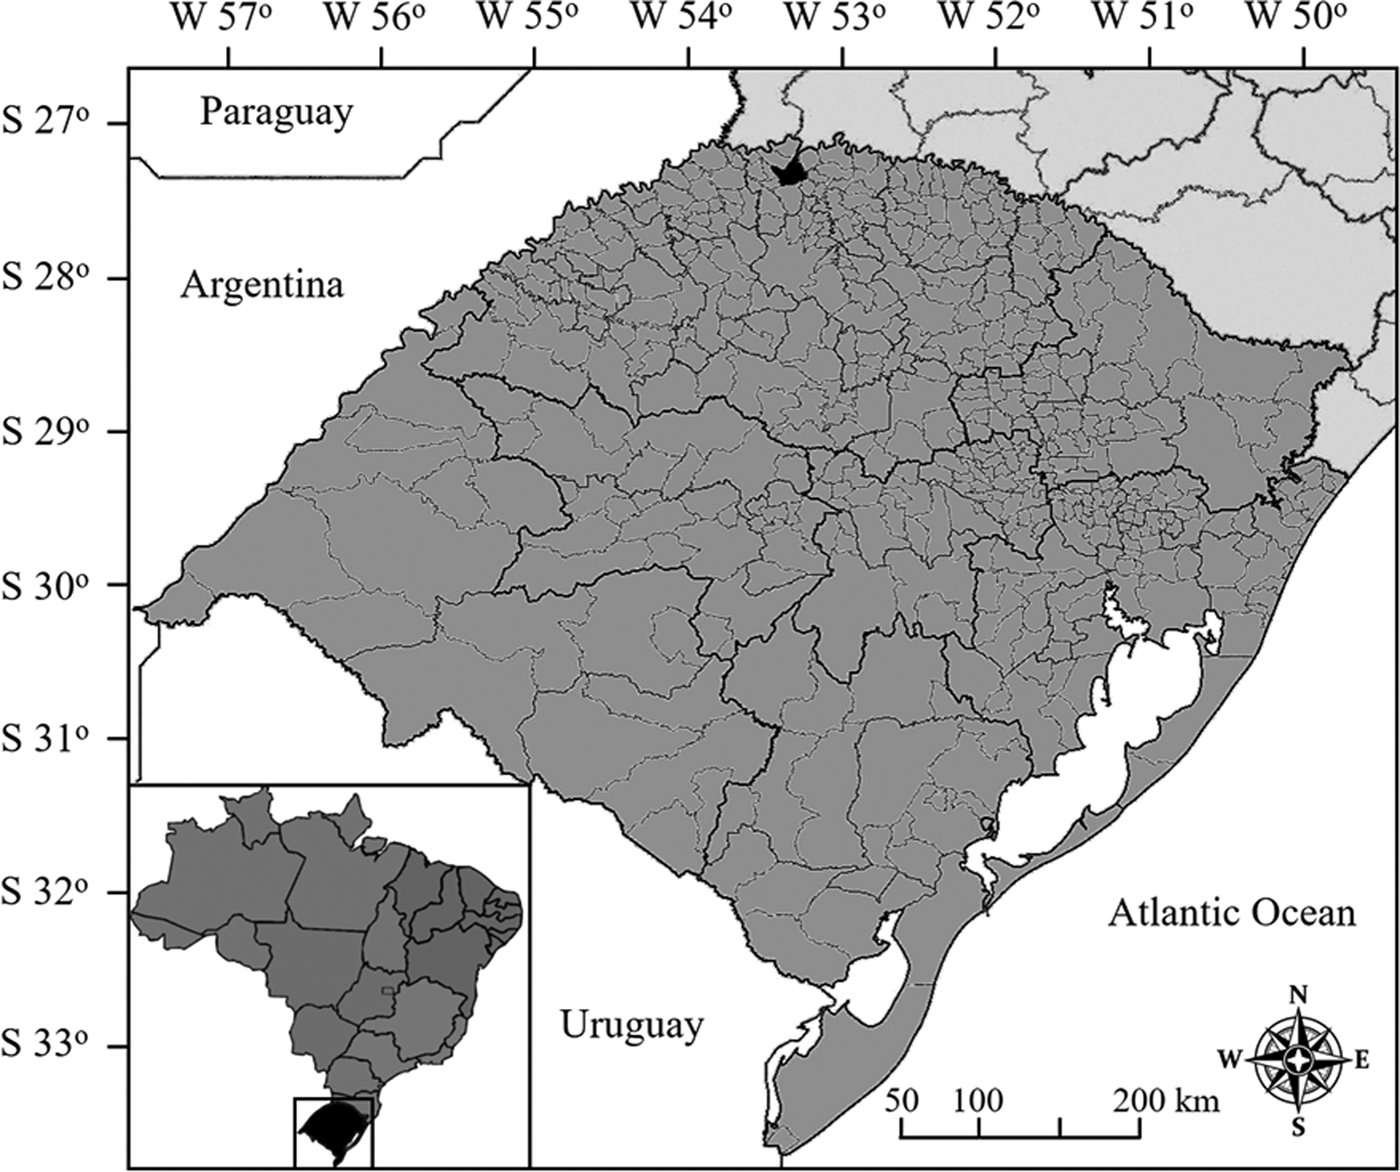
Fig. 1. Geographical location of the experiment. The state of Rio Grande do Sul is highlighted in black on the bottom map, while the city of Frederico Westphalen is highlighted in black on the main map.
Experimental design
The experimental design was a randomized complete block, characterized by a factorial arrangement of 3 × 5 defined by three cropping systems: intercrop I (12 × 12 m2), intercrop II (6 × 6 m2) and a monocrop system with sugarcane; five evaluation years (2012–2016) and three replications. In each marked rows (plots 2 m in length), two representative stalks were collected, which were taken to the laboratory for evaluation. For each evaluation year, a total of 84 stalks were collected and evaluated. The sample unit consisted of 16 stalks in the intercrop I system, eight stalks in the intercrop II system, and four stalks in the monocrop system. Each evaluated stalk was considered to be a repetition. The number of plants evaluated in each system was defined in order to identify the effect of the treatments; consideration was given to the inherent variability of each system following the assumptions described by Leite et al. (Reference Leite, Peternelli, Barbosa, Cecon and Cruz2009).
The sugarcane utilized for this study was developed by the Agronomic Institute of Campinas (IAC), cultivar IAC 87-3396 is characterized by a high yield, high sucrose content and excellent adaptation to soils with lower fertility. In the monocrop system, the sugarcane crop was distributed in six rows with 12 m length. In the intercrop I system, trees were distributed in rows spaced at 12 m; the sugarcane was distributed in eight rows and arranged corresponding with intervals between tree rows, with a total of 16 rows throughout the system. In the intercrop II system, trees were grown in rows spaced at 6 m; the sugarcane was distributed in four rows arranged in correspondence to intervals between tree rows. A total of 15 trees were allocated for each experimental unit. Trees were planted in the experimental field in September and sugarcane in November of 2011. The seedlings and cuttings were manually planted after ploughing and harrowing the area.
In both systems, the sugarcane had a spacing of 1.20 m and an initial density of 16 buds per meter with both tree and sugarcane oriented in rows toward the East and West. After the sugarcane was planted, plots were delineated by 2 m long sections marked with stakes and were distributed in three rows per treatment at different points in the understory of each experimental unit. Plot areas were chosen with the objective of representing the microclimate conditions of each cropping system. The arrangement of tree, sugarcane and plot of evaluation are shown in Fig. 2.

Fig. 2. A sketch of the agroforestry system experimental units: intercrop I: 12 × 12 m2, intercrop II: 6 × 6 m2 and the monocrop system. Black circles represent trees, continuous lines indicate where the sugarcane was planted, and the rectangles in gray represent the year evaluation plots of sugarcane.
Yield components and juice quality evaluations
The experiment was performed in five sugarcane cycles, one cane-plant (first cultivation year) and four cane-ratoon cycles (each cycle corresponding to an individual sugarcane regrowth) with a total of 5 yr of evaluation (2012–2016). The first cut was performed on 07/26/2012, the second on 07/25/2013, the third on 06/16/2014, the fourth on 07/02/2015 and the last (fifth cut) was performed on 06/23/2016. In collecting plants for evaluation, the harvest point was determined by the measurement and monitoring of sucrose levels and stalk humidity during the harvest season (Cardozo and Sentelhas, Reference Cardozo and Sentelhas2013).
On the day of plant collection, stalk numbers (SNs) were counted in the field for each previously demarcated plot. Values were extrapolated per hectare (ha) for the existing population in each experimental unit. The number of stalks used to determine the stalk weight (SW) per ha for each evaluation year varied according to the sugarcane regrowth capacity. We utilized the following SNs for each evaluation year: 20,833, 46,833, 62,083, 49,583 and 40,416 stalk ha−1 for the years 2012, 2013, 2014, 2015 and 2016, respectively.
The yield components were analyzed in the laboratory. The SW (Mg ha−1) was obtained by weighing each stalk on a digital scale; stalk length (SL, m) was measured from the first visible dewlap leaf to the stalk base, while stalk diameter (SD, mm) was determined by using the average of three measurements of stem diameter (SD) taken at the bottom, the middle and the top of the stalks. The number of nodes (NN) was obtained by a total count of nodes in each evaluation stalk.
For the evaluations of sugarcane juice quality, juice volume (JV, m3 ha−1) was obtained by milling the stalk, and measured with the aid of a graduated cylinder with a capacity of 1 L. The JV samples were taken to determine the Brix degree by means of an automatic digital refractometer Acetec RDA 8600. Sucrose concentrations (SC, g L−1) were determined using the equation proposed by Torres et al. (Reference Torres Neto, Silva, Silva, Swarnakar and Silva2006): SC = Brix degree × 10.13 + 1.445. Where, SC, sucrose concentration (g L−1).
The total sucrose quantity (S, Mg ha−1) was determined from the values of SC and JV, by the following equation: S = SC × JV/1000. Where, S, total sucrose quantity (Mg ha−1); SC, sucrose concentration (g L−1); and JV, juice volume (m3 ha−1).
Tree species used to compose the agroforestry systems and evaluated growth variables
The tree species Tung (A. fordii), of the Euphorbiaceae family, an exotic deciduous species, was used to compose the agroforestry system. It was chosen due to its adaptability to environmental conditions and the high oil yield of its fruits. The productive evaluations (oil yield) was not performed due to the period of cultivation; the minimum period necessary for fruit production is 5 yr with the peak production at 10 yr (Zhan et al., Reference Zhan, Wang, Shockey, Chen, Zhou, Yao and Ren2012).
After the transplanting of the seedlings to the field, quarterly evaluations were carried out from March 17, 2012, which corresponds to 176 days after the transplanting of the seedlings (DAT). The evaluations were carried out until June 21, 2016, resulting in total of 1736 DAT throughout 18 evaluation period. Evaluations were carried out on the days that marked the half of each season studied, but not necessarily on the same day or date between the different evaluation years. Evaluation dates were defined by their relative relation to the beginning of each season of the year: autumn 03/20, winter 06/21, spring 09/22 and summer 12/21.
The determination of height values (H), stem diameter (SD), diameter at breast height (DBH) and crown diameter (CD) of A. fordii tree were evaluated during each season of the year. Tree height was measured from the ground level to the top leaf axils using a measuring tape until they reached 2.0 m, thereafter a Vertex III Hypsometer was used. The SD at ground level was measured using a tape measure at 5 cm above ground level, and the DBH was evaluated through the use of a measure tape at a height of 130 cm. For CD, evaluations were performed using a metric tape throughout vertical and horizontal measurements.
The values of meteorological variables during the experiment were obtained from a Climatological Station of the National Institute of Meteorology (INMET) linked to the Agroclimatology Laboratory (UFSM) located about 200 m from the study site at coordinates 27°39′S and 53°43′W. The following meteorological variables were obtained: incident solar radiation (SR, MJ m−2), rainfall (Rain, mm), minimum air temperature (T. Min, °C), maximum air temperature (T. Max, °C) and average air temperature (T. Ave, °C). Soil water availability was determined by a climatological water balance (Thornthwaite and Mather, Reference Thornthwaite and Mather1955) on a month long time scale using a soil water holding capacity of 100 mm (Elli et al., Reference Elli, Caron, Paula, Eloy, Schwerz and Schmidt2016a, Reference Elli, Caron, Eloy, Behling, Souza and Schwerzb).
Solar radiation interception
The determination of intercepted solar radiation was carried out for the fifth cane-ratoon cycle. The amount of solar radiation intercepted by sugarcane was measured using a portable sensor pyranometer (LICOR PY32164) coupled to a Datalogger (LICOR 1400). The intercepted solar radiation values were measured monthly beginning in October 2015 (82 days after cutting) and finalized in June 2016 (332 days after cutting). SR was measured above and under the plant canopy (in the demarcated plots Fig. 2) with a portable pyranometer that recorded measurements in the period from 10 to 12 h. The values of intercepted global radiation were obtained according to the following equation:
 $${\rm \%} \;{\rm Intercepted = [100}{\rm -} ({\rm Rn} \times {\rm 100/Rt}){\rm ]}$$
where: Rn, incident radiation under the canopy; Rt, incident radiation above the canopy.
Statistical analysis
The data were statistically analyzed with the software ‘Statistical Analysis System’ (SAS, 2003). Data were initially examined for homogeneity of variance among years, and then subjected to analysis of variance in order to determine treatment effects and possible interactions between cropping systems and years. The Dunnett's test (P > 0.05) was used to compare the intercrop I and II systems with the control (monocrop) system and Tukey's test (P > 0.05) to compare the difference between the intercrop I and II systems.
Results
According to variance analysis, we observed an interaction between evaluation years and cropping systems for the yield components: NN, SN, SW, SD and SL. We did not observe an interaction between evaluation years and cropping systems for the variables: JV, SC and total sucrose content; because of this, the main effects were analyzed.
The air temperature during the years of sugarcane evaluation ranged from −2.6 to 37.0°C, with an average temperature of 18.8°C. The flux of global solar radiation was 17.35 MJ m−2 day−1 on average, with a variation of 0.49–38.46 MJ m−2 day−1. In general, solar radiation had the highest values in the first and last months of the year (summer season) and diminished values during June and July (winter season). The water balance for each sugarcane cycle showed periods with water deficits and others with a water surplus (Fig. 3). The cane-plant cycle showed periods with accentuated water deficits (December to March), while for the cane-ratoon cycles significant water deficits were not observed.

Fig. 3. Average monthly values for minimum, maximum and average air temperature, accumulated incident solar radiation and water balance (surplus, water surplus; and deficit, water deficit) during each sugarcane cycle in Frederico Westphalen, RS, Brazil.
Tree growth in the two agroforestry systems
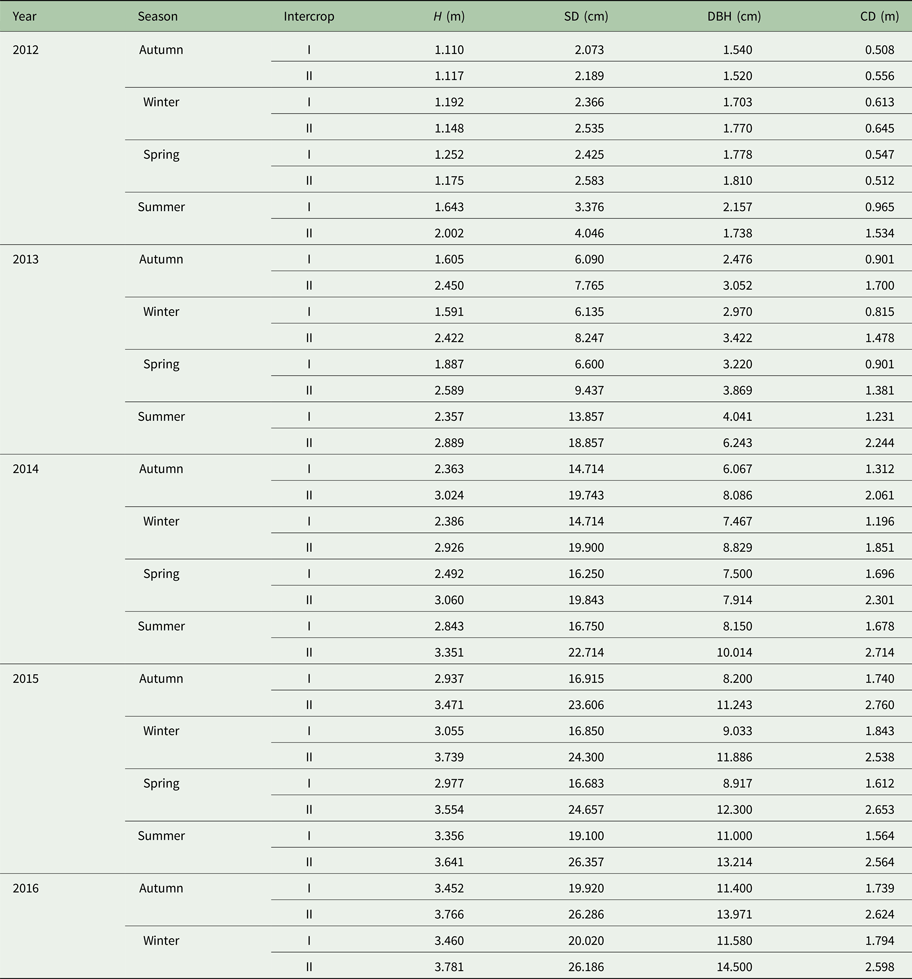
Aleurites fordii trees cultivated in the intercrop II system showed greater tree growth when compared with the intercrop I system (Table 1). All growth variables analyzed showed greater values for the intercrop II system. In general, considering all seasons and growth variables studied, we observed values 18% higher than those obtained for the intercrop I system. In relation to the seasons of the year, the summer season was responsible for the greater increase in the tree growth variables, while for the winter and spring season, a lower increment in the tree growth variables values were observed. When analyzing only the CD in the last year (2016), the intercrop II system was 33.7 and 32.3% greater than the intercrop I system for the seasons of autumn and winter, respectively.
Table 1. Height (H), stem diameter (SD), diameter at breast height (DBH) and crown diameter (CD) of Aleurites fordii in two intercropping systems during the seasons of the year throughout the experimental period.
Solar radiation interception in agroforestry and monocrop systems
In evaluating the solar radiation intercepted by sugarcane in the cropping systems during the fifth cane-ratoon cycle (Fig. 4), we found variations in the amount of solar radiation intercepted by sugarcane plants during the cycle and in the different cropping systems. The greatest amount of solar radiation intercepted during the fifth cane-ratoon cycle was observed at 265 days after cutting where the monocrop, intercrop I and intercrop II systems intercepted 89.3, 78.1 and 73.9% of incident radiation, respectively. In general, sugarcane grown in the monocrop system intercepted greater amount of solar radiation (Fig. 4c) when compared with the agroforestry systems (Fig. 4a and b); however, when compared with the two agroforestry systems, the sugarcane grown in the intercrop I system showed greater amount of intercepted solar radiation, which was approximately 12.2% higher than the intercrop II system. These observations were made considering mean values during the fifth cane-ratoon cycle.

Fig. 4. Solar radiation intercepted by sugarcane in intercrop and monocrop systems throughout the days after cutting in the fifth cane-ratoon cycle.
Sugarcane yield components in agroforestry and monocrop systems
A significant difference for all variables were verified for sugarcane yield components when grown in the intercrop and monocrop systems throughout the evaluation years (Fig. 5). We saw a significant difference for the NN between the cropping systems for only the fourth cane-ratoon cycle where the intercrop I and II system values were greater than the monocrop system (Fig. 5a). In relation to the evaluation years, the smallest NN was verified for the cane-plant cycle with an average value of 5.3 nodes per plant. When compared with the other evaluation years, we observed an increase of 64.3% in the NN with an average value for all cane-ratoon cycles of 14.9 nodes per plant.

Fig. 5. Yield components of sugarcane in intercrop and monocrop systems throughout the evaluation years. Each bar represents average values ± SE. Means followed by the same uppercase letter compare the agroforestry systems with the control (monocrop), by Dunnett's test (P < 0.05); and lowercase letters compare the evaluation years for each cropping system, by Tukey's test (P < 0.05).
We observe a pronounced response for the SN in the second and third cane-ratoon cycles (Fig. 5b). The greatest SN was seen for the monocrop and intercrop I systems, which were 35.2 and 41.0% greater than the intercrop II system in the second and third cane-ratoon cycles, respectively. Values for SN were observed to level-off for the fourth and fifth cane-ratoon cycles, with an average value of 10.6 stalks m−2 in the different cropping systems (Fig. 5b). For the cane-plant cycle, the lowest SN was seen with an average value of 5.7 stalks m−2. The monocrop system showed a SW 38.5, 26.0 and 23.7% greater than the intercrop II system for the second, third and fourth cane-ratoon cycles, respectively (Fig. 5c); while a significant difference was not observed when compared with the intercrop I system.
The greatest stalk yield, 85.3 Mg ha−1 was obtained for the monocrop system, followed by the intercrop I with 78.4 Mg ha−1 and lastly, the intercrop II system with 63.1 Mg ha−1 in the third cane-ratoon cycle (Fig. 5c). For the fifth cane-ratoon cycle, the monocrop system showed greater values than either of the two agroforestry systems. In the first year, no difference was observed for the stalk yield for all cropping systems; this year had the lowest values for stalk yield. In relation to the evaluation years, the greatest SW values were obtained in the third cane-ratoon cycle with an average value of 75.6 Mg ha−1 and a subsequent decrease in the values reaching 52.1 Mg ha−1 in the fifth cane-ratoon cycle (Fig. 5c).
Sugarcane morphological traits in different cropping systems
Significant differences for the morphological traits of sugarcane when grown in intercrop and monocrop systems throughout the evaluation years were observed (Fig. 6). We saw a significant difference for the SD between the cropping systems in the second and third cane-ratoon cycles, where the monocrop and intercrop I system showed the greatest values when compared with the intercrop II system (Fig. 6a). The greatest values of SD were observed for the fourth cane-ratoon cycle with an average value of 29.8 mm, while the lowest values obtained for cane-plant cycle were seen with an average value of 20.0 mm.

Fig. 6. Morphological traits of sugarcane in intercrop and monocrop systems throughout the evaluation years. Means followed by the same uppercase letter compare the agroforestry systems with the control (monocrop), by Dunnett's test (P < 0.05); and lowercase letters compare the evaluation years for each cropping system, by Tukey's test (P < 0.05).
The greatest SL values were found for the intercrop I system; these were greater than the monocrop and intercrop II systems for the second and third cane-ratoon cycles (Fig. 6b). The SL values for the monocrop system in the fifth cane-ratoon cycle were greater than the other agroforestry systems. Additionally, an increasing trend throughout the evaluation years was found independent of the cropping system; the greatest SL was observed in the fifth cane-ratoon cycle with an average value of 200 cm, which was 34.5% greater than those obtained in the cane-plant cycle with a reported average value of 131 cm.
Sugarcane juice quality in intercrop and monocrop systems
When evaluating the effect of the cropping systems on the sugarcane quality (Fig. 7), a significant difference between the treatments for JV and total sucrose content were found; whereas for the sucrose content, no significant difference was observed. An average sucrose content of 174.4 g L−1 was obtained for all systems (Fig. 7b). The greatest values of JV were seen for the intercrop I and monocrop systems, which were 31.7 and 26.2% greater than the intercrop II system (Fig. 7a). The same response trend was seen for the variable total sucrose content, where the intercrop I and monocrop system were 32.1 and 26.1% greater than the intercrop II system (Fig. 7c).

Fig. 7. Quality traits of sugarcane in the different cropping systems. Each bar represents average values ± SE. Means followed by the same lowercase letter compare the agroforestry systems with the control (monocrop), by Dunnett's test (P < 0.05).
In relation to the effect of cultivation years on sugarcane quality, all variables showed significant differences across years (Fig. 8). The cane-plant cycle presented the lowest values for all studied variables. JV increased until the fourth cane-ratoon cycle at which point a subsequent decrease of 29.5% in the JV produced was seen in the fifth cane-ratoon cycle (Fig. 8a). The third and fourth cane-ratoon cycles showed no significant difference with an average JV of 37.5 m3 ha−1. This same trend was observed for the total sucrose content (Fig. 8c). The greatest values were obtained for the third and fourth cane-ratoon cycles with a subsequent decrease of 34.8% in the total amount of sucrose produced in the fifth cane-ratoon cycle.

Fig. 8. Quality traits of sugarcane between the different evaluation years. Each bar represents average values ± SE. Means followed by the same lowercase letter compare the evaluation years by Tukey's test (P < 0.05).
The greatest sucrose content values were recorded in the fourth cane-ratoon cycle, which differed significantly from the other evaluation years (Fig. 8b). It is important to highlight the low sucrose content in the first evaluation year, which was only 69.1 g L−1. In other years, considering an average value for all cane-ratoon cycles of 193.6 g L−1, a difference of 64.3% was observed.
Discussion
Tree growth determines the amount of solar radiation intercepted by sugarcane in agroforestry systems
Aleurites fordii growth depends on tree spacing, which determines the degree of intraspecific competition between other trees and interspecific competition between trees and sugarcane plants. This is especially relevant during the first year after tree planting due to sugarcane casting shade on the A. fordii trees. The greater degree of competition seen in the intercrop II system led to greater tree growth, a development which can be associated with a strategy of the trees to acquire more resources (solar radiation, water, nutrients) through greater plasticity of the tree canopy (Schröter et al., Reference Schröter, Härdtle and Von Oheimb2012; Longuetaud et al., Reference Longuetaud, Piboule, Wernsdörfer and Collet2013; Van de Peer et al., Reference Van de Peer, Verheyen, Kint, Van Cleemput and Muys2017). The greater growth values of the trees cultivated in the intercrop II system resulted in a reduction of productive sugarcane responses. In this context, agroforestry systems should consider the benefits provided by both species in order to obtain a balance in the production system.
Aleurites fordii growth is influenced by the season of the year. In summer and autumn seasons, the tree growth is favored. A higher incidence of solar radiation and the occurrence of higher temperatures can benefit the photosynthetic rate of trees and result in an increase in the production of photoassimilates for tree growth. According to Boardman (Reference Boardman1977), photosynthetic activity determines the growth of plants due to an increase or decrease in photoassimilates, a relationship which can be described as a function of meteorological conditions. On other hand, in the winter and spring seasons, the growth of A. fordii trees was influenced by the occurrence of low air temperatures such as in days with frost, which can result in a reduction of photosynthetic activity as a consequence of cells freezing (Larcher, Reference Larcher2000). This response can reduce cell division and expansion, and affect tree growth (Table 1).
The growth and development of different species in the same area results in dynamic interactions between a community of plants that changes with time. These interactions influence the distribution of existing resources in the system (Muller et al., Reference Muller, Paciullo, Martins, Rocha and Castro2014), where solar radiation is the first to change. The lowest amount of radiation intercepted by the sugarcane in the intercrop I and II systems is explained due to the effects of the A. fordii canopy, which shades the sugarcane plants, especially those in the intercrop II system because of the lower spacing between trees.
According to Leite et al. (Reference Leite, Zubizarreta-Gerendiain and Robinson2012), canopy dimensions interfere with the performance of physiological processes and are often used as indicators of a tree's ability to compete for resources. The results of the present study are similar to those of Hardy et al. (Reference Hardy, Melloh, Koenig, Marks, Winstral, Pomeroy and Link2004), who reported that the amount of radiation intercepted by the trees and consequently the radiation that reaches the ground is determined by canopy characteristics such as CD and the size of the existing gaps in the canopy, factors which can be determined by tree arrangement.
Our study highlights the importance of the choice of tree arrangement; considerations should be given to the height and CD of a tree species over time and the requirements of the crops present in the understory. In this study, the lesser amount of solar radiation intercepted by sugarcane cultivated in the intercrop II system negatively influenced sugarcane yield components. It is therefore that a balance between crop and trees should be sought over time.
Yield components are influenced by cropping systems and evaluation years
The yield and quality components of sugarcane were influenced by different cropping systems and evaluation years. Changes in microclimate conditions of different cropping systems explain the variation of the yield components, and morphological and quality traits of cultivated sugarcane. A greater degree of interspecific competition for available natural resources was observed in the agroforestry systems but not the monocrop system, due to the presence of trees. Solar radiation and water availability were the primary meteorological variables that influenced yield components and the quality traits of sugarcane (Figs. 3 and 4a, b). It can be affirmed that meteorological variables are the primary factors responsible for the yield and quality of sugarcane (Keating et al., Reference Keating, Robertson, Muchow and Huth1999; Inman-Bamber et al., Reference Inman-Bamber, Bonnett, Spillman, Hewitt and Glassop2010; Cardozo and Sentelhas, Reference Cardozo and Sentelhas2013).
The cane-plant cycle was negatively affected by low water availability, which occurred between the months of December 2011 to March 2012 (Fig. 3). This resulted in low values for yield and quality components, primarily SW and produced JV (Figs. 5c and 8a). Greater susceptibility of sugarcane to water stress occurs in the stalk elongation phase, which results in a considerable reduction in the production of biomass and reduces the SW and sucrose yield (Robertson et al., Reference Robertson, Muchow, Donaldson, Inman-bamber and Wood1999; Silva and Costa, Reference Silva and Costa2004; Inman-Bamber and Smith, Reference Inman-Bamber and Smith2005).
The monocrop and intercrop I systems showed similar responses for the number of stalks and SW (Fig. 5b and c), SD (Fig. 6a), JV and total sucrose yield (Fig. 7a and c). These responses are related to the greater availability of solar radiation in the understory of the A. fordii trees in the intercrop I system, which allows for a greater amount of solar radiation to be intercepted by sugarcane plants (Fig. 4a), as well as less competition for water and nutrients (Zhang and Li, Reference Zhang and Li2003; Pinto et al., Reference Pinto, Bernardes, Stape and Pereira2005; Nicodemo et al., Reference Nicodemo, Castiglioni, Pezzopane, Tholon and Carpanezzi2016). A greater amount of intercepted solar radiation resulted in higher photosynthetic rates (Ribeiro et al., Reference Ribeiro, Machado, Magalhães Filho, Lobo, Martins, Silveira, Yind and Struik2017), and consequently, greater production of assimilates, which determines the productive responses of the sugarcane plants.
The low yield, morphological differences and quality of sugarcane cultivated in the intercrop II system are explained by the low amount of solar radiation intercepted by the sugarcane (Fig. 4b), when compared with the intercrop I system. The low amount of solar radiation intercepted is associated with the effects of the canopy of the A. fordii trees, which casts shade on the sugarcane plants, and led to a greater competition for water and nutrients.
The reduction in the productive responses of sugarcane cultivated in the intercrop II system may be related to the morphophysiological adjustments (Paciullo et al., Reference Paciullo, Miranda Gomide, Castro, Fernandes, Müller, Pires and Xavier2011); for example, as a shade tolerance strategy, these adaptations were not able to compensate a reduction of radiation in the understory of A. fordii and therefore influenced the productive sugarcane responses. According to Pinto et al. (Reference Pinto, Bernardes, Stape and Pereira2005), the main limiting factor in agroforestry systems is the availability of solar radiation, which together with the competition for water and nutrients limits sugarcane yields in plants near to the forest species.
The stalk yields in the agroforestry systems showed satisfactory values (78.4 and 63.1 Mg ha−1 for the intercrop systems I and II, respectively) for the third cane-ratoon cycle when compared with the average stalk yield for the state of Rio Grande do Sul of 51.5 Mg ha−1 during the 2013/2014 sugarcane cycle (Conab, 2014). Additionally, these results are similar to those obtained by Pinto et al. (Reference Pinto, Bernardes, Stape and Pereira2005), who evaluated the yield of sugarcane in agroforestry systems with Eucalyptus grandis and found differences in sugarcane yields in different tree spacing. In the previously cited study, sugarcane grown among trees planted 11.6 m apart showed average yields of 64.1 Mg ha−1 in the state of São Paulo, Brazil. The yields seen in the present study were higher than those obtained by Elli et al. (Reference Elli, Caron, Paula, Eloy, Schwerz and Schmidt2016a, Reference Elli, Caron, Eloy, Behling, Souza and Schwerzb), who evaluated the yield of sugarcane in different agroforestry systems with Parapiptadenia rígida species, found stalk yields of 61.9, 53.1 and 41.6 Mg ha−1 in three cultivation cycles. These results demonstrate the productive potential of sugarcane in intercropping conditions with forest species.
Number of sugarcane crops harvested
During the sugarcane cycle, it was possible to identify a period of greater production independent of the cropping systems. In the third and fourth cane-ratoon cycles, the sugarcane reached its peak production resulting in the highest rate for produced stalks and JV. In the fifth cane-ratoon cycle, a reduction of the productive capacity of the sugarcane was observed with a significant reduction in most of the analyzed variables. This may be explained by the lower number of plants per unit area, and due to the lower sugarcane tillering. This result was more evident for the intercropping systems because the higher levels of shading on the plants negatively influencing the tillering of the sugarcane. According to Singels and Smit (Reference Singels and Smit2009), the density of sugarcane plants tends to decrease with a reduction of solar radiation interception due to the effects of shading resultant from the intercropping with the forest species.
Successive ratoon cycles resulted in the decline of productive sugarcane responses over time. Underground buds released from apical dominance successively emerged to produce another (ratoon) that grows to maturity. A general decline in sugarcane yields in successive ratoons is a phenomenon termed ratoon decline (Ramburan et al., Reference Ramburan, Wettergreen, Berry and Shongwe2013), and it limits the economic viability of sugarcane production due to the increasing frequency and necessity of costly replanting operations. Lower yields of older ratoons are generally associated with an increase in pests and diseases, increased competition between tillers and subsequent tiller mortality (Chapman et al., Reference Chapman, Ferraris and Ludlow1992), weed competition (Srivastava and Chauhan, Reference Srivastava and Chauhan2006) and other crop management factors such as shading resultant from the growth of forest species in intercropping systems. The typical number of sugarcane crops harvested from a single planting can range from three to seven cane-ratoon cycles (Ramburan et al., Reference Ramburan, Wettergreen, Berry and Shongwe2013).
Sugarcane juice production depends on the cropping system used
Changes in microclimatic conditions in different cropping systems led to variations in juice production and total sucrose yield, while variations for the sucrose content were not observed in the different cropping systems. Greater juice production and total sucrose yield observed for the monocrop and intercrop I systems, and this can be explained by the lower degree of competition between sugarcane plants and trees for resources, particularly for solar radiation which was not limiting in these conditions. On other hand, for the intercrop II system, a greater degree of competition for resources resulted in a significant reduction in produced JV and in total sucrose yield. In addition, a lower number of obtained stalks and lower average SW (Fig. 5b and c) resulted in a lower JV, which highlights the relationship between the studied variables.
Total sucrose yield is a highly complex trait that depends on yield components, and morphological and quality traits, each having its own sensitivity to abiotic conditions (Rae et al., Reference Rae, Grof, Casu and Bonnett2005). Interactions among sugarcane yield components and their effect on sucrose yields have been identified by other authors (Wang et al., Reference Wang, Jackson, Lu, Fan, Foreman, Chen, Deng, Fu, Ma and Aitken2008; Gouy et al., Reference Gouy, Luquet, Rouan, Martiné, Thong-Chane, Costet, Niboucheb and Gozé2015). According to these authors, the SN was reported to be the most important component for sugarcane production, followed by SW and SD, while plant height and sucrose content were considered to be of secondary importance (Wang et al., Reference Wang, Jackson, Lu, Fan, Foreman, Chen, Deng, Fu, Ma and Aitken2008; Gouy et al., Reference Gouy, Luquet, Rouan, Martiné, Thong-Chane, Costet, Niboucheb and Gozé2015).
Our study demonstrated that intercropping systems did not significantly affect sucrose content in sugarcane juice. This response can be explained by microclimate variations in the cropping systems, which was not sufficient to cause variation in sucrose content. In addition, due to the A. fordii species’ leaf senescence early in the winter season, this characteristic allows a greater availability of radiation during the sugarcane maturation period; this resulted in similar sucrose content between the different cropping systems. Variations in sucrose content were observed during the cane-ratoon cycles. These variations may be related to cane-ratoon age and the variation of the air temperature during each cane-ratoon cycle (Fig. 3), where low air temperatures during the ripening period may be responsible for a greater or lesser accumulation of sucrose.
The observed results corroborate with those of Cardozo and Sentelhas (Reference Cardozo and Sentelhas2013), who reported that in relation to the proximity of sugarcane harvest, the occurrence of low temperatures can hinder the growth of sugarcane, forcing a conversion of reduced sugars into sucrose. These results confirm that air temperature variation can influence sucrose content. The sucrose content in the stalk can vary by harvest time and crop age (Cardozo and Sentelhas, Reference Cardozo and Sentelhas2013), which was confirmed in the present study.
The study of the tree growth, as well as the interception of solar radiation, and sugarcane yield components, morphological traits, juice yield and quality of sugarcane cultivated in agroforestry systems are not popular subjects of research. The information generated in this study is relevant, as it provides information to farmers and can assist in the planning of more ideal agroforestry systems via more efficient arrangements, in addition to confirming the viability of sugarcane cultivated in agroforestry systems. This is especially relevant in the context of Brazilian law No. 12,651, May 25, 2012 which established a new Forest Code that allows farmers to plant agroforestry systems in areas of permanent preservation (APP) and legal reserves (RL), provided that said systems are subject to a sustainable management plan.
Conclusion
Agroforestry systems should consider the benefits of both forestry and cultivated species. In this study, A. fordii trees had greater growth in the intercrop II system; however, this system promoted reductions in sugarcane yield components due to the lowest relative amount of solar radiation intercepted by sugarcane plants. For sugarcane production, the use of an intercropping system with 12 × 12 m2 arrangements should be prioritized, because it promotes greater sugarcane yields when compared with 6 × 6 m2 intercropping systems; significant differences were not observed when the system (12 × 12 m2) was compared with the monocropping system for most of the analyzed variables, which support the first hypothesis. We recommend the cultivation of sugarcane for up to a maximum of five cycles; after this period, economic evaluation and decision-making is necessary in order to plan new sugarcane plantations, which support the second hypothesis.
The choice in agroforestry systems should consider the balance of a system; in this context, the intercrop I system should be prioritized because it presents higher sugarcane yields. In the future, from the moment that A. fordii trees show a productive return, a new joint analysis of the data should be made in order to verify the suggested recommendations of the present research.
This study sought to provide new sustainable alternatives for farmers in order to increase the diversification of rural properties and maintain and/or improve the preservation of existing agroecosystems. It is important that new research is conducted in order to study the use of agroforestry systems in threatened ecosystems such as those in APPs and RLs.
Acknowledgements
The authors wish to acknowledge the National Council for Scientific and Technological Development (CNPq-Brazil), for the productivity scholarship of the co-author Braulio O. Caron and the Coordination for the Improvement of Higher Education Personnel (Capes-Brazil) for their financial support of the author Felipe Schwerz.


