


Introduction
Adopting reduced tillage (i.e., strip tillage or no tillage) strategies can reduce fuel consumption and cost, with positive feedbacks for increasing C sequestration and mitigating greenhouse gas emissions (West and Marland, Reference West and Marland2002; Koga et al., Reference Koga, Tsuruta, Tsuji and Nakano2003; Lal, Reference Lal2004; Filipovic et al., Reference Filipovic, Kosutic, Gospodaric, Zimmer and Banaj2006; Nelson et al., Reference Nelson, Hellwinckel, Brandt, West, De La Torre Ugarte and Marland2009). Reducing or eliminating tillage also improves soil biological activity, nutrient availability, water storage and soil structure (Kladivko, Reference Kladivko2001). However, reduced or no-till farming is associated with increased use of herbicides in typical conventional systems with short crop rotations (Friedrich, Reference Friedrich2005), indicating increased weed pressure might be a concern for organic producers. In fact, reduced and no-till approaches in organic systems have had negative impacts on weed management and crop yields (Peigné et al., Reference Peigné, Ball, Roger-Estrade and David2007; Mäder and Berner, Reference Mäder and Berner2012). These issues have hindered the adoption of reduced and no-tillage (NT) strategies in organic production systems where alternative disturbance-free weed control techniques are few (Corbin et al., Reference Corbin, Collins, Krebill-Prather, Benedict and Moore2015).
Strip-tillage (ST) is a reduced tillage method that limits soil disturbance to a narrow planting strip within the field, leaving the inter-row space largely undisturbed. ST can be considered a precision tillage system (Kurstjens, Reference Kurstjens2007) or a non-inversion zone-tillage method (McLaughlin et al., Reference McLaughlin, Drury, Reynolds, Yang, Li, Welacky and Stewart2008). ST uses 70% less fuel than moldboard plowing (Hanna, Reference Hanna2001; McLaughlin et al., Reference McLaughlin, Drury, Reynolds, Yang, Li, Welacky and Stewart2008; Morris et al., Reference Morris, Miller, Orson and Froud-Williams2010), and can improve aspects of soil health, including soil structure (Drury et al., Reference Drury, Tan, Reynolds, Welacky, Weaver, Hamill and Vyn2003), water holding capacity (Licht and Al-Kaisi, Reference Licht and Al-Kaisi2005), C and N sequestration (Al-Kaisi et al., Reference Al-Kaisi, Yin and Licht2005) and microbial biomass (Weyers et al., Reference Weyers, Johnson and Archer2013). With ST, farmers are not barred from using additional mechanical weed control, such as rotary hoeing and inter-row cultivation. However, the suitability of ST for organic production systems is uncertain.
Our main objective was to examine the feasibility of ST for organic crop production. We previously showed ST increased soil microbial biomass, an indicator of soil health, over a conventional tillage (CT) approach (combination of moldboard, chisel and disc-tillage methods) in organically managed cropping systems (Weyers et al., Reference Weyers, Johnson and Archer2013). Over 8 years of production, this evaluation assessed ST and CT under both a 2-year, three-crop rotation (2y) and a 4-year, four-crop rotation (4y), with and without fertilization. Yields, system productivity (measured with gross returns) and weed seed density were used to evaluate the effectiveness of ST and crop diversity for organic system performance. ST was expected to provide sufficient weed control and not negatively affect crop yields in low-input and organically managed 2- and 4-yr crop rotations compared with CT.
Materials and methods
Site description
The study was conducted at the Swan Lake Research Farm, near Morris, MN (45°41′N, 95°48′W). The study was established on ground previously managed conventionally, with chemical pesticides and disk tillage, and cropped in a corn–soybean–spring wheat rotation, ending with soybean in 2001. The 3-ha experimental area encompassed five soil series within a Barnes/Aastad catena, which were primarily clay loams (USDA-NRCS, 2016) that developed from glacial till. The 0–15 cm soil depth averaged 33 g kg−1 total C, 31 g kg−1 organic C, 3 g kg−1 N, 11 mg kg−1 P and 206 mg kg−1 K with a 7.3 pH. Johnson et al. (Reference Johnson, Archer, Weyers and Barbour2011) provide additional information on soil properties.
A fully automated weather station, within 0.5 km of the experimental site, collected hourly precipitation and soil temperatures. Climatic characteristics, including precipitation, high and low seasonal temperatures, and total degree-days are provided in Table 1. The 30-year (1981–2010) annual average precipitation is 672 mm, air temperatures range from an average of −12.2 °C in January to an average 21.4 °C in July, and growing degree days average 1314 using a 10 °C base temperature (NOAA-NCDC, 2013).
Table 1. Select climatology measurements taken at the Swan Lake Research Farm, near Morris, MN, from 2002 to 2009.

Experimental design
The evaluation presented here focuses on the 96 experimental plots (6 m × 12 m) of the organic management component of a larger scale farming systems study conducted from 2002 to 2009, described by Archer et al. (Reference Archer, Jaradat, Johnson, Weyers, Gesch, Forcella and Kludze2007) and Weyers et al. (Reference Weyers, Johnson and Archer2013). The management component followed organic standards accepted in the region at the time, but the plots were not officially certified. The experiment was arranged as a randomized complete block design with four replicate blocks. Two levels each of tillage, rotation and fertility treatments were applied in a full factorial arrangement. Tillage treatments were ST and CT; rotations were 2-year (2y) and 4-year (4y) (see crop sequences below); and fertilizer strategies were fertilized or non-fertilized. Four main management systems, CT-2y, CT-4y, ST-2y and ST-4y, under each of the fertilized and non-fertilized treatments for a total of eight different management system combinations were compared.
Management practices
The 2y rotation was corn/winter rye–soybean, until 2007, and then it was corn–soybean/winter rye (Table 2). This switch was made to improve establishment of the winter rye. Before spring planting, this winter rye cover crop was terminated by field cultivation in CT systems and rotary hoeing or spring tillage in ST systems. The 4y rotation was corn–soybean–spring wheat/alfalfa–alfalfa through 2006, and was changed to corn–soybean–alfalfa–alfalfa thereafter. In 2006, this change in the rotation was planned and alfalfa was not underseeded in the wheat plots. In 2007, these plots were seeded with an annual alfalfa (AA) variety, Big N. This change was implemented to allow better growth and productivity of the alfalfa as a means to improve its termination after 2 years of harvest activity. Termination of alfalfa was accomplished in ST using undercutting sweeps in early years, then chisel tillage (CH) in later years, and in CT with moldboard plow (Table 3). All crops under both rotations were grown every year. For each experimental plot, this established a single and invariable crop entry point into the rotation.
Table 2. Planting, harvest and fertility management on the organic systems management experiment from 2002 to 2009.

1 Crop variety if common listed once, or indicated by year; P, Pioneer; DK, DeKalb; NC, NC+ Organics; BR, Blue River.
2 In 2007, alfalfa was established as a biennial (BA) crop following soybean or as an annual (AA) crop following wheat.
3 Manure application rate given as applied, moist.
4 Weight of liquid hog manure estimated using a density of 1.01 kg L−1.
5 Double listings are for 2 and 4y rotations, respectively, where different rates were used.
6 Nutrient content is given in percent of the applied moist manure, content is provided in percentage for ease of comparing across the different applications; actual values are provided in the text.
7 n.a. indicates data was not available.
Table 3. Weed management and tillage activities by year, crop and management system.
1 CT, conventional tillage; ST, strip-tillage; 2y, two-year rotation; 4y, four-year rotation.
2 FC, field cultivation; RH, rotary hoe; RC, row-cultivation; Weed, hand hoeing; Mow, mowing; Har, Harrow; MP, moldboard plow; DT, disk tillage; CH, chisel tillage; ST, strip-tillage; NT, no-tillage; sp-spring; fa-fall.
3 In 2002, alfalfa was established as an entry point, with no-prior crop. For 2003–2005, alfalfa was planted with wheat, but harvested in its second year. No alfalfa was planted in 2006; however, alfalfa planted into wheat 2005 was harvested in this year. In 2007, alfalfa was established as a biennial (BA) crop following soybean or as an annual (AA) crop following wheat; in 2008 and 2009, alfalfa was established as BA following soybean, and harvested for 2 years. Management is for first year of BA unless second year (A2) is indicated.
Crop varieties, and planting and harvest dates for all crops are listed in Table 2. Row spacing for plantings was 76 cm for corn and soybean, and 18 cm for wheat and alfalfa. Corn and soybean crops were planted with a 3 m (four row) John Deere (JD) 9350 press wheel no-till drill or 3 m (four row) JD 1700 Maxemerge plus planter. Wheat was planted with a Marliss 3 m Pasture King no-till drill. Alfalfa was planted with the Marliss drill or a Gandy spreader. Winter rye cover crop was hand-broadcast seeded before or just at harvest of corn and soybean (Table 2).
The two fertilizer strategies included a non-fertilized treatment and a manure fertilized treatment. A non-fertilized treatment was implemented to address internal versus external fertility sources with legumes in both rotations serving as internal sources of N. In the fertilized treatment, dairy or swine manure was applied in spring to the corn crop in the 2y rotation, or the wheat crop in the 4y rotation, until 2007, when wheat was eliminated. At this point, N-fixation by alfalfa became the only source of N in the 4y rotation. Solid dairy manure was applied using a commercially available 4.5 ft JD manure spreader. Liquid hog manure was applied with a Vandale injection-type applicator and knifed into the soil at 15 cm depth. Application rates varied yearly and by rotation depending on manure source and expectations of nutrient content (Table 2). Dairy manure averaged 60% moisture, 11% total C, 0.69% total N and 0.11% mineral N.
In the fall, primary tillage activities were typically performed after final crop harvest in (October–November); occasionally fall tillage was delayed until spring (sp) before planting for corn, soybean and alfalfa (Table 3). Primary tillage was not used in the fall following wheat in all CT- and ST-4y rotations as it was underseeded with alfalfa. Generally in the CT systems, tillage with moldboard plow (3 m Case 400, to 20 cm depth) followed corn and alfalfa, and CH (6 m JD 610 chisel plow, to 15 cm depth) followed soybean. Generally in the ST systems, ST (eight row, 20 cm deep, 10 cm wide Yetter shank system centered on the planting row) was used after the harvest of corn and soybean. In ST-4y systems following alfalfa, fall ST was used in 2002, 2003 and 2007 (AA), fall field cultivation (eight sweep Wil-Rich 2500 field cultivator, reaching 15 cm depth) was used in 2004, and CH was used in remaining years. The switch to CH was to improve termination of the alfalfa. In the spring, one or more passes with the field cultivator, was used to prepare the seedbed—and for pre-plant weed control—mainly for all corn, CT-wheat, CT-soybean and first year CT-alfalfa following the switch in 2007.
Alterations to general primary tillage management were as follows (see Table 3). In fall of 2004, disk tillage (3.4 m JD 115 Tandem disk, to 15 cm depth) was used in all CT-4y and ST-2y plots following the corn harvest as they were already planted with the winter rye cover crop. Additional ST was used in ST-2y non-fertilized plots to manage corn residue. Management with fall NT was also used in CT-2y and ST-2y in 2005 and 2006 after corn harvest, and in 2008 and 2009 after soybean harvest, because winter rye was already planted. Fall NT was also used in CT-4y and ST-4y after harvesting soybean, followed by spring field cultivation to prepare the seed bed mainly for CT-wheat.
During the growing season weeds were managed with rotary hoeing (4.6 m JD 400 rotary hoe, 2.5 cm depth), inter-row cultivation (3 m JD 886 row-crop cultivator, 10 cm maximum depth), harrowing (3 m Ledy, 2.5 cm depth), inter-row mowing (Donald, Reference Donald2000) with a conventional push mower or hand weeding activities as appropriate for individual crops within each tillage and rotation treatment (Table 3). In both corn and soybean, weed control was applied from May through July at least three times following the recommendations of Oriade and Forcella (Reference Oriade and Forcella1999) as follows. Using WeedCast 4.0 software to predict emergence (Reese and Forcella, Reference Reese and Forcella1997) rotary hoeing was conducted twice at approximately 15 and 30% predicted weed emergence, and inter-row cultivation once at 60% predicted weed emergence. Harrowing, primarily in May, was used to control weeds emerging in wheat. Rotary hoeing was used for weed control, primarily in May, in first year alfalfa after 2007. Inter-row mowing and hand hoes were also used later in the growing season to control weeds.
Crop harvest and yields
Harvest dates for all summer crops are given in Table 2. Except for 2002, alfalfa was harvested on average three times per year during the second year of growth through 2006, then during the first and second years from 2007 to 2009. Alfalfa was cut with a swather and baled (Lindor baler) in most years. When biomass was insufficient for baling, a Bush hog FH174 flail mower was used and biomass was hand raked for harvest. All grain plots were harvested using a two-row Hegy 160 plot combine with the appropriate grain head, and total grain removed from a 1.52 m wide strip through the center of each plot. Subsamples of grain from each plot of corn, soybean and wheat were cleaned, weighed, dried and reweighed to extrapolate clean grain yields. Final clean grain and forage weights are reported in Mg ha−1and adjusted to 15.5, 13, 13.5 and 15% moisture, respectively in corn, soybean, wheat and alfalfa forage.
System productivity
In order to compare overall harvested production for each management system across all crops, the rotation's average annual value of production was calculated as the average of the gross returns for each crop in the rotation within replicate blocks. This evaluation produces the same result as calculating a crop yield equivalence; i.e., crop A yield equivalent weight (to crop B) = gross sales crop A/crop B price per unit weight (Singh et al., Reference Singh, Sah, Singh, Singh and Hasan2010). Gross returns were calculated using the average annual market price for organic grain production from 2007 to 2011 in the Upper Midwest (USDA-ERS, 2012). Organic pricing for alfalfa in the Upper Midwest was not available, so the average conventional price used was obtained from NASS Quick Stats (https://www.nass.usda.gov/Quick_Stats/) for the same period. The dollar amounts used per Mg of yield were: US$330 for corn, US$686 for soybean, US$364 for spring wheat and US$134 for alfalfa hay.
Weed seed sampling
Weed seed densities were used to represent weed pressure. Seeds are discrete and identifiable units compared with immature or mature plants whose individual sizes may vary considerably at any one sampling time. Thus, seed collection avoids the need for multiple peak biomass sampling events during the growing season. Moreover, weed seeds can be enumerated consistently and compared across systems that contain diverse crops that mature and/or are harvested at different times of the year (e.g., first-cut alfalfa versus spring wheat versus corn).
Immediately prior to fall tillage, twenty 6-cm diameter areas along a diagonal transect in the central 3 m of each plot were sampled for weed seeds each year from 2002 to 2005. In each area, the soil surface was vacuumed and all seeds, debris and loose soil removed. Samples within plots were aggregated. Seeds were washed from the soil, dried and separated using an air column. Seeds were identified to species and placed into one of the following groups: green foxtail [Setaria viridis (L.) Beauv.], common lambsquarters (Chenopodium album L.), redroot pigweed (Amaranthus retroflexus L.) and all others, which primarily included barnyardgrass (Echinochloa crus-galli [L.] Beauv.), common ragweed (Ambrosia artemisiifolia L.), wild mustard (Sinapis arvensis L.) and wood sorrel (Oxalis stricta L.). Densities are reported as total seeds m−2.
Statistics
Crop yields and system productivity were analyzed using a mixed model procedure (GLIMMIX) in SAS 9.4 statistical software (SAS, 2014a), with replicate block treated as a random effect in all tests. Influence of overall tillage, rotation and fertilizer effects on crop yields were evaluated by treating year as a random effect to account for year-to-year differences due to annual weather variability. The influence of these treatments on crop yields within years was evaluated by treating year as a main fixed effect in the mixed model. For the yield analysis, the random year-effect model gave the same results as the fixed year-effect model; therefore only results from the fixed effect model are provided (Table 4). Multiple comparison procedures were used to identify treatment differences for main effects and interactions, with a Bonferroni adjustment used when necessary. An alpha of 0.05 was used to statistically discriminate among treatment means.
Table 4. P-values for main and interaction effects on corn, soybean, wheat and alfalfa yields.

Total weed seed density was evaluated among crops with a mixed model procedure (GLIMMIX) in SAS 9.4, with replicate block and year as random effects. Multiple comparison tests were used to determine differences among crops due to rotation, tillage and fertilizer combinations across years, using a Bonferroni adjustment when necessary. Total and categorical weed seed densities were analyzed within crops with a mixed model and multiple comparison procedures as above. For these analyses on weed seed density, data were ln(x + 1) transformed to fit normality. Regression analysis, using JMP 11 statistical software (SAS, 2014b), was conducted on the transformed data to evaluate the effect of all tillage, rotation and fertilizer treatment combinations on linear changes in total weed seed density over time. Additional regression analyses were used to evaluate the influence of specific crops and entry points into the rotation on these regressions. Entry points, established in 2002, were either corn or soybean under the 2y rotation, or corn, soybean, wheat or alfalfa under the 4y rotation. Non-parametric correlations (Spearman's Rho, ρ) on untransformed data, conducted in JMP 11 (SAS, 2014c), were used to evaluate the influence of total weed seed density on individual crop yields within all tillage, rotation and fertilizer treatment combinations. Significant differences among treatments were determined at P < 0.05.
Results
Management effects on crop yields
Overall, grain yields of corn, soybean and wheat were influenced significantly by tillage; soybean yields were influenced by rotation; and all crop yields were influenced by fertilizer treatment (Table 4). Significant interactions, excluding years, were limited to tillage and fertility with soybean and wheat yields, and to rotation and fertility with corn and soybean yields. Year had a significant effect on crop yields, as precipitation and growing degree-days were variable year-to-year (Table 1), with lower yields generally falling in 2006 and 2009, the drier, cooler years (data not shown). Most treatment effects had significant two-way and three-way interactions with year.
Across all grain crops, differences in yields among management systems were generally the same, being greatest in fertilized CT systems, with little difference between fertilized ST systems and non-fertilized CT systems (Fig. 1). Corn yields were greater under fertilized CT treatments, but were generally the same between the fertilized ST treatments and non-fertilized CT treatments, with no differences due to rotation (Fig. 1a). Soybean grain yields were greater in CT than ST systems within both fertilized and non-fertilized treatments (Fig. 1b). However, due to the interaction between rotation and fertility, fertilized ST-2y had the same yields as non-fertilized CT treatments, and fertilized ST-4y had the same yields as non-fertilized ST treatments. Wheat grain yields were highest in the fertilized CT system, and the same between fertilized ST and non-fertilized CT treatments (Fig. 1c). Alfalfa forage was greater only with fertilization, with no difference due to tillage (Fig. 1d).

Figure 1. Average (A) corn, (B) soybean and (C) wheat grain crop and (D) alfalfa forage yields of the four main management systems by fertilized and non-fertilized treatments. Error bars indicate one standard error (n = 32). Lowercase letters indicate significant differences across all treatments. Management systems are: CT-2y, conventional tillage, 2-yr rotation; CT-4y, conventional tillage, 4-yr rotation; ST-2y, strip-tillage, 2-yr rotation; and ST-4y, strip-tillage 4-yr rotation.
Generally, these overall patterns for crop yields were not consistent within years nor did they reflect higher or lower precipitation or growing degree-days (data not shown). With corn, grain yields were the same between fertilized CT-2y and ST-2y in 5 of 8 years and ST-4y and CT-4y in four of 8 years. Soybean grain yields were the same among all systems, fertilized or not, in the first 2 years, and the same among all fertilized management strategies in 4 of 8 years, but variable among strategies in subsequent years (data not shown). Similarly, wheat grain yields were the same among all treatments the first 2 years of production and remained the same the next 3 years among the fertilized ST and non-fertilized CT and ST treatments, but always were greater in the fertilized CT. Although fertilization increased alfalfa forage overall, this was mainly due to a strong impact of just two production years (2005 and 2006) when forage was significantly greater in the fertilized treatments (data not shown). From 2007 to 2009, harvested alfalfa forage in the first year of growth averaged (±SD) 3.25 ± 1.02 Mg ha−1 and was not significantly different from harvested alfalfa forage in the second year of growth, which averaged 4.34 ± 1.52 Mg ha−1.
System productivity
System productivity, indicated by gross returns averaged over the rotation, was significantly greater in the fertilized CT-2y (US$1803 ha−1 yr−1), followed by equal returns in the fertilized ST-2y and CT-4y (averaging US$1249 ha−1 yr−1), and non-fertilized CT-2y (averaging US$1234 ha−1 yr−1), which were greater than the remaining systems (averaging US$863 ha−1 yr−1) (P < 0.05). This result was consistent when the 2002 returns were adjusted or removed to account for the lack of an alfalfa harvest (see Table 2). Within most years, productivity of the fertilized CT-2y system was high, but was different from all other management systems only in 2008 and 2009 (Fig. 2). In the other 6 years, productivity in the fertilized CT-2y system was equivalent to at least one other system. In any single year, productivity was not consistently lowest in any one management system, even among non-fertilized systems, but reflected the overall trend of lower productivity of the fertilized ST-4y, and non-fertilized CT-4y, ST-2y and ST-4y management systems. Moreover, year-to-year variability fluctuated by 55, 57 and 74% from the average productivity, respectively in the fertilized CT-4y, CT-2y and ST-4y systems, indicating somewhat better stability in the CT-4y system.
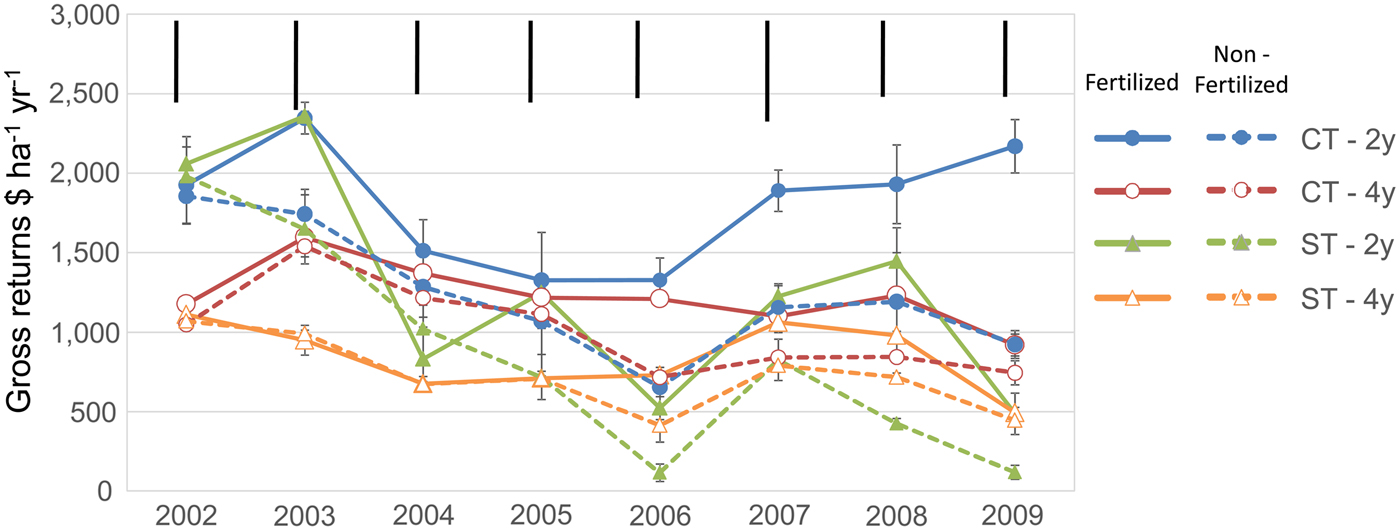
Figure 2. Management system productivity measured by average of potential gross returns (US$ ha−1 yr−1) within each rotation system over time. Bars on treatment means indicate one standard error (n = 4). Darker bars above means indicate the least significant difference among systems within that year (P < 0.05). Management system abbreviations are listed in Fig. 1.
Weed seed density
Among crops, the main effects of tillage, rotation, crop and year, but not fertility influenced total weed seed density. Averaged over fertility treatments, multiple comparisons among crops indicated that total weed seed density was significantly greater in ST-2y corn, followed by CT-2y corn, with the lowest total seed density occurring in CT-4y soybean (Fig. 3). Green foxtail contributed the most to total weed seed density, averaging 78% and ranging from 50 to 90% of the total seed density among all treatments. Common lambsquarters was the next dominant weed species, averaging 13% and ranging from 5 to 25% of total weed seed density.

Figure 3. Average total weed seed density [ln(x + 1) means m−2, left y-axis scale, and the back transformed means, right y-axis scale] averaged over fertility treatments and shown by management systems within crops, for 2002–2005. Bars represent the natural log standard errors (n = 32). Proportions of the four different weed seed groups are relevant only to the ln(x + 1) scale. Lowercase letters indicate significant differences in total weed seed density among systems and crops.
For total weed seed density within corn and soybean crops, tillage and rotation, but not fertility, were significant main effects, and there were no significant interactions (Table 5). Weed seed densities within seed groups were influenced by management strategies in corn and soybean, but in wheat and alfalfa crops, neither densities of total weed seeds nor any group were influenced except for redroot pigweed in wheat. In corn, these significant effects primarily indicated that total seeds, green foxtail, broadleaf and other seed densities were greater under the 2y than 4y rotations, and total and green foxtail seed densities were generally greater under ST than CT (Fig. 3). In soybean crops, broadleaf seed densities were greater under 2y than 4y rotations and total, green foxtail and common lambsquarters seed densities were greater under ST than CT (Fig. 3).
Table 5. Significant main effects and interactions with P-values for total and subgroups of weed seed densities by crop.

1 T × R × F, three-way interaction of tillage, rotation and fertility.
Regression analysis indicated that total weed seed densities increased substantially more over time in 2y versus 4y rotations, regardless of tillage or fertilization (Fig. 4). Within rotations, weed seed densities increased more over time within ST than CT, also regardless of fertilization. All regressions were linear and significant, though r 2 values indicated the regressions fit the data for 2y rotations much better than for 4y rotations. As this analysis compared across crops and entry points, additional regression analyses within entry points and within crops were conducted to understand these overall system trends (data not shown). Entry point analysis, i.e., looking at changes over time as influenced by successive crops in rotation, revealed that most regressions did not fit linear trends but fit quadratic or cubic relationships. These relationships indicated that an individual crop (or the management used for a crop) had a greater impact than the rotation strategy on total weed seed density. Regressions within crops were linear and significant for corn and soybean, quadratic for wheat, and linear but not significant for alfalfa. In particular, slopes for linear regressions within corn were significantly higher than for soybean, indicating greater densities of weed seeds within whole management systems were the result of having corn in the rotation.

Figure 4. Change in total weed seed density, ln(x + 1), over time by management system for the fertilized (A) and non-fertilized (B) treatments. Regression equations of the ln(x + 1) transformed means and r 2 values are shown. Bars represent the standard error of ln(x + 1) means (2y n = 8; 4y n = 16).
Correlations conducted within crops for all systems demonstrated few significant decreases in yield with corresponding increases in total weed seed densities (Table 6). These negative correlations mainly occurred for all management systems except ST-4y within the corn crop. Increasing weed seed density negatively affected soybean yields in the fertilized ST-2y system and in the non-fertilized ST-4y system. Wheat grain yields actually increased with increasing total weed seed density in the non-fertilized CT-4y system. Alfalfa forage yields were not significantly correlated to weed seed density.
Table 6. Spearman's Rho (ρ) and P-value for correlations between yield and total weed seed densities, by fertilized and non-fertilized treatments, listed by crop and management system.

1 CT, conventional tillage; ST, strip-tillage; 2y, two-year rotation with winter cover crop; 4y, four-year rotation.
2 ns, not significant.
Discussion
Crop rotation, tillage, fertility and weed management strategies had a substantial impact on crop yields and overall productivity of the organic management systems under evaluation. Average yield differences over 8 years were most pronounced for the soybean crop where the top performing strategy, CT-2y, had 49% greater yields over the lower performing ST-4y, compared with a 43% yield difference for corn between these same treatments. This result for soybean is surprising given that the weed seed densities, inferring a greater weed pressure, were substantially greater and correlated to reduced yields under the corn crop, particularly in the 2y rotation. The corn variety used might have exhibited a greater competitive ability when weed pressures were high (Ford and Mt. Pleasant, Reference Ford and Mt. Pleasant1994). Alternatively, aphid pest pressure might have caused yield declines in the soybean (Beckendorf et al., Reference Beckendorf, Catangui and Riedell2008). Although these organic soybean plots were not treated, the non-organic plots in the companion study had frequent insecticide applications during the 8 years of this experiment (Weyers et al., Reference Weyers, Archer, Forcella, Gesch and Johnson2017).
Under the 4y rotation, the increase in yield between tillage strategies was 30% more for CT- than ST-managed wheat. The difference in weed seed densities in wheat between tillage management systems was not significant and thus the higher yields were not due to differences in weed pressure. However, greater availability of N under CT could have given the CT-wheat a competitive advantage over ST-wheat. An evaluation of N mineralization processes in 2007 did indicate greater availability of N for potential crop uptake under the CT- than ST-managed wheat (S.L. Weyers, 2015, unpublished data). This greater N availability was probably due to mineralization of the spring-applied manure as a result of incorporation from cultivation and harrowing activities under CT (Eghball, Reference Eghball2000) that were absent in ST. When wheat was removed from the 4y rotation, N availability likely declined further as manures were no longer applied. This points to needed improvement of nutrient management for diverse rotations, even if they include N-fixing legumes.
In alfalfa, only 8% more forage was achieved with ST than CT. The lack of a significant tillage management effect on alfalfa yields is easily explained by the absence of tillage or other management disturbances prior to or during the alfalfa harvest year. This lack of disturbance persisted for the first 5 years of the experiment when alfalfa was underseeded into wheat. After the change in management, first-year harvest of alfalfa forage dropped in the ST treatment, but not significantly compared with CT. Second-year alfalfa forage, 2007–2009, was similar to second year alfalfa harvested after wheat in previous years; and again, no differences were observed between tillage treatments. Weed seed densities and weed management activities were not significantly different between the ST and CT alfalfa plots, nor did weed seed density increase over time the four alfalfa crop years evaluated. This was probably because alfalfa has a competitive advantage and suppressive effect on summer annual weeds (Tautges et al., Reference Tautges, Burke, Borrelli and Fuerst2017), and can be used strategically with zero or reduced tillage for this purpose (Anderson, Reference Anderson2015).
System productivity (gross returns) of the fertilized CT-2y system was highest averaged over the 8-year evaluation, even though yields of corn or soybean were not significantly different in fertilized CT-2y and CT-4y. This better performance seemed to be dependent on the higher price premium used for soybean, in combination with higher corn yields. Further, the overall significance of higher productivity was driven by greater yields in fertilized CT than ST systems in only half of the production years evaluated. Although price premiums for soybean have remained high (Dimitri and Oberholtzer, Reference Dimitri and Oberholtzer2009; USDA ERS, 2014; USDA AMS, 2016), selecting this CT-2y management system for the likelihood of better productivity might be challenged by increasing weed pressures. Further challenges to selecting this rotation might be inability to certify the two-crop/winter cover rotation with some organic certification agencies. Weed seed densities in the systems evaluated increased significantly over time, particularly due to corn in the rotation. Moreover, adoption of winter cover cropping continues to be a challenge in the Upper Midwest, particularly for grain-based production systems (Kladivko et al, Reference Kladivko, Kaspar, Jaynes, Malone, Singer, Morin and Searchinger2014; Arbuckle and Roesch, Reference Arbuckle and Roesch-McNally2015; Sindelar et al., Reference Sindelar, Schmer, Gesch, Forcella, Eberle, Thom and Archer2015).
In brief, rotation length rather than tillage system affected summer-annual weeds as measured by end-of-season weed seed densities. The phenology of summer annual weeds coincides closely with that of summer-annual crops such as corn and soybean (Baskin and Baskin, Reference Baskin and Baskin1985). These weeds have evolved to take advantage of simple rotations of corn and soybean. In contrast, cool-season crops like alfalfa and spring wheat have planting and/or harvesting dates that disrupt the life cycles of summer annual weeds like foxtail, lambsquarters and pigweed (Anderson, Reference Anderson2015). Consequently, population trajectories of these species, established through the first 4 years, were much lower in the 4y than 2y rotations. Similarly, annual broadleaf weeds were successfully controlled by diverse rotations in organic systems that included corn (Teasdale et al., Reference Teasdale, Mangum, Radhakrishnan and Cavigelli2004).
The current experiment indicated that adopting reduced tillage for an organically managed four-crop rotation in the Upper Midwest may be dependent on successful weed management and specifically indicated that weed management efforts should probably focus on the corn year of the rotation. Alternative weed management approaches needing greater exploration include cultural activities such as diversified rotations and inter-cropping (Liebman and Dyck, Reference Liebman and Dyck1993; Bond and Grundy, Reference Bond and Grundy2001). From the current case, possible changes to diverse rotations might be longer-term use of alfalfa in the rotation, as it did reduce weed seed densities, or eliminating corn as it correlated to increased weed seed densities and decreased yields. Another cultural method is to use dead biomass from cover crops to suppress weeds, but this method will depend on producing sufficient biomass to cover the soil surface (Wayman et al., Reference Wayman, Cogger, Benedict, Collins, Burke and Bary2015). In addition, termination methods for winter-surviving cover crop varieties with reduced or NT would have to be employed, such as roller-crimping of winter cover crop biomass (Kornecki et al., Reference Kornecki, Price and Raper2006; Forcella, Reference Forcella2013; Mirsky et al., Reference Mirsky, Ryan, Teasdale, Curran, Reberg-Horton, Spargo, Wells, Keene and Moyer2013). This method of weed control will be accessible to producers in the Upper Midwest as winter cover cropping methodology improves. Another method in development, particularly relevant to corn, is abrasive application of gritty agricultural residues, which are mortally damaging to small weeds but relatively harmless to young corn (Forcella, Reference Forcella2012; Erazo-Barradas, Reference Erazo-Barradas2016).
Although the current data indicated that reduced tillage compromised productivity, other results from this experiment indicated reduced tillage increased microbial biomass and, likely, overall soil health (Weyers et al., Reference Weyers, Johnson and Archer2013). In the near term, establishing an organic management system with a reduced tillage approach that benefits productivity as well as soil health continues to be a challenge in the Upper Midwest (Carr et al., Reference Carr, Gramig and Liebig2013). However, success with cover cropping and roller-crimping in reduced and no-till organic systems has been demonstrated in other regions of the Upper Midwest (Silva, Reference Silva2014; Bietila et al., Reference Bietila, Silva, Pfeiffer and Colquhoun2016), lending hope that research continued on this subject will develop the management systems needed for sustainable production and healthy soils. The results presented here suggest future research to improve ST systems for organic production need to focus on the management of weeds particularly in the corn production years. Additional studies are also needed to better understand nutrient availability under the different tillage strategies specifically with respect to the tillage-disturbed and non-disturbed rooting zones.
Acknowledgements
The authors are grateful to Jim Eklund, Charles Hennen, Scott Larson, Dean Peterson, Nancy Barbour, Alan Wilts, Joe Boots, Chris Wente, Jay Hanson, Steve VanKempen and numerous students for their expertise in field management, sample collection and data management. This work contributes to the USDA-ARS GRACEnet.
Mention of trade names or commercial products in this publication is solely for the purpose of providing specific information and does not imply recommendation or endorsement by the U.S. Department of Agriculture. USDA is an equal opportunity employer and provider.


