


Introduction
US farmers are currently faced with a number of environmental issues, some of which include ground and surface water contamination, soil erosion, and declining soil qualityReference Mueller, Barbercheck, Bell, Brownie, Creamer, Hitt, Hu, King, Linker, Louws, Marlow, Marra, Raczkowski, Susko and Wagger1. Most farms rely on off-farm chemical inputs and have little resemblance to natural systems. Natural systems capture energy and nutrients through complex interactions, which are simplified and disrupted under agricultural usesReference Gliesmann and Gliessman2. Interactions between agricultural management practices and soil biological, chemical, and physical processes affect the productivity of agricultural soils and their impact on environmental qualityReference Doran, Parkin, Doran and Jones3.
The use of the term ‘soil quality’ is related to concepts of sustainability, particularly with regard to agricultural sustainabilityReference Lal, Kimble, Follet and Cole4. Soil quality is the capacity of a soil to function within ecosystem boundaries to sustain biological productivity, maintain environmental quality, and promote plant and animal healthReference Doran, Parkin and Doran5. The most distinctive contribution of soil quality research is an attempt to understand the linkages among management practices and systems, observable soil characteristics, soil processes and soil functionReference Lewandowski and Zumwinkle6.
Part of any system to evaluate the sustainability of farming practices requires identification of soil attributes that serve as indicators of change and also relate to productivity. Soil attributes that are sensitive to changes and perturbations in the soil environment can be used as indicators of the status or condition of a farm's resourcesReference Karlen, Wollenhaupt, Erbach, Berry, Swan, Eash and Jordahl7. The biologically active components of soil including organic matter, soil microbial biomass and energy sources such as organic C and N, are known to be sensitive indicators of changes in soil managementReference Kennedy and Smith8. Soil organisms play a major role in plant litter decomposition and nutrient cycling, but they also influence plant disease and protectionReference Dowling and O'Gara9 and provide biological control of soil-dwelling insect pestsReference Kaya and Gaugler10. The overall focus of our research was to measure the effects of divergent agricultural practices on soil properties, with an interest on the sensitivity of these properties to capture rapid changes in soil conditions. The overall focus of our research was to measure the effects of divergent agricultural practices on soil properties, with an interest on the sensitivity of these properties to capture rapid changes in soil conditions. The specific research objective was to determine the capacity of a specific set of soil biological, chemical and physical properties to assess soil quality and determine its ability to detect short-term changes in soil conditions and processes.
Materials and Methods
Experimental site
The research site was the Farming Systems Unit (FSU) at the Center for Environmental Farming Systems (CEFS) near Goldsboro, NC (35°23′N, 78°5′W, elevation 35 m). The FSU is a large-scale long-term field experiment with a randomized complete block design having three replications and five farming systems. The systems that were sampled in this study are described in Table 1. They were a conventional system using best management practices (BMP), split into conventional tillage (CT) and no-tillage (NT) subplots, an organic production system and a successional ecosystem (old field succession). The FSU is approximately 80 ha in size with individual plots ranging from 0.81 to 4.05 ha. The dominant soil type within each replication is termed the diagnostic soil. The diagnostic soil types were Wickham sandy loam (fine-loamy, mixed, semiactive, thermic Typic Hapludult) and Tarboro loamy sand (mixed, thermic Typic Udipsamment). The site is blocked by soil type, such that all soil samples in a system are taken from the same ‘diagnostic soil’ in a given block.
Table 1. Description of the three systems used for the soil quality assessment. These systems are part of the FSU, a long-term systems field experiment initiated in 1998 at the CEFS near Goldsboro, NC.

The organic, BMP and the successional ecosystems were chosen for this study because they are most divergent with respect to management and therefore expected to experience short-term changes in soil quality. Soil chemical (pH, inorganic N, and total C and N), physical (bulk density and infiltration), and biological (soil respiration, entomopathogenic nematodes and Pseudomonas populations) indicators were measured.
Soil sampling
The study was initiated in September 1998 by planting rye (Secale cereale L.) on the entire 80 ha experimental site and systems were initiated in the spring of 1999. In March 1999, five random points were selected within each experimental plot for soil quality sampling. Following a baseline measurement, subsequent sampling was conducted over the course of the 1999 growing season, late May (spring) shortly after planting the summer crop (Summer I), mid-season at peak crop growth (Summer II), and post harvest in late October (fall). The same sampling cycle was repeated in the 2000 growing season. Each sampling site was physically marked and geo-referenced using a Trimble® backpack GPS unit and stored on a GIS database.
A composite of thirty, 2.54-cm diameter by 15-cm deep cores were taken adjacent to the plant row on the untracked side near the geo-referenced point. The composite samples were placed in large buckets lined with plastic bags and the soil thoroughly mixed by hand. The composite sample was then divided in the field into three equal portions of approximately 200 g for determination of pH, total C, total N, NO3 and NH4-N analyses and for quantifying entomopathogenic nematodes and fluorescent Pseudomonas populations.
Soil fertility indicators
Soil samples were prepared for testing by first air-drying and then fine grinding to pass through a 2-mm sieve. Soil pH was determined using a 1:1 soil to water ratio. For inorganic N (NH4+NO3-N) determinations, 5 g of air-dried, ground soil was weighed into a 50-ml plastic centrifuge tube. Fifty ml of a 1 M KCl solution was then added to the tube and the mixture shaken for 1 h. The tubes were then centrifuged at 1000 rpm for 12 min, after which time approximately 5 ml of the supernatant was transferred into plastic vials and frozen until further analysis. Samples were analyzed using a Latchat QuikChem Method 10-107-04-1-A and 10-17-05-A, for NH4 and NO3-N respectively. Total soil C and N were determined by combustion on a Perkin-Elmer 2400 CHN Elemental Analyzer.
Soil respiration and infiltration
The closed chamber method of Parkin et al. Reference Parkin, Doran, Franco-Vizcaino, Doran and Jones11 was used to measure soil respiration in situ as an indirect measure of microbial activity. One measurement was made at each of the five plot geo-located points. A PVC ring 7.6 cm in diameter and 7.6 cm deep was forced 7.5 cm into the ground slightly to the side of the crop row on the untracked, inter-row side. Rings were installed after crop planting each year and remained in place for the multiple measurements made that year. To determine the headspace within each ring, the ring was lined with Saran Wrap and 2.54 cm of water added. The distance from the water surface to the top of the ring was measured. The Saran Wrap was then removed, allowing the water to drain into the soil within the ring. The ring was capped to be airtight. After 24 h, a 100-cm3 gas sample was withdrawn from the closed chamber using a syringe and a Draeger® gas detector tube. This method actually calls for a one-half hour incubation time. Consequently the respiration results were conservative because the 24-h incubation time used in our study likely resulted in rates 2–4-fold lower than the standard assay (John Doran, personal communication 23 March, 2007). Headspace measurements were used to convert Draeger tube readings into kg C evolved ha−1 day−1. The concentration of CO2 gas was converted using the headspace volume in the chamberReference Parkin, Doran, Franco-Vizcaino, Doran and Jones11, Reference Sarrantonio, Doran, Liebig, Halvorson, Doran and Jones12. Another PVC ring 7.6 cm in diameter and 15 cm deep was installed just to the side of the crop row on the untracked inter-row side. These rings were installed after planting in the spring and remained in place for the duration of the cropping season. The elapsed time for the 2.54 cm of deionized water (non-constant head) to infiltrate the soil surface was recorded.
Bulk density
An Uhland core samplerReference Blake, Hartge and Klute13 was used to obtain surface (upper 7.5-cm) bulk density on intact cores (7.6 cm in diameter by 7.6 cm in length) three times over the course of the two years, in March and November 1999, and November 2000. Measurements were taken in the crop row nearest the geo-referenced point.
Entomopathogenic nematodes and bacterial analyses
A 10-day in vitro Galleria mellonella bioassay was used to detect entomopathogenic nematodes in soil samplesReference Stuart and Gaugler14. This method, which entails ‘baiting’ the sample with insect larvae and then searching for cadavers, is commonly called the Galleria bait method. The G. mellonella larvae are normally not exposed to nematodes and, therefore, are very susceptible to infection. Each plastic bag, which contained approximately 200 g of soil (taken from the larger composite sample), was baited with five Galleria larvae placed on the soil surface. The bags were sealed and incubated in the dark for five days. At the end of this time period, all five larvae were removed and the cause of death determined. The bags were then re-baited with five fresh larvae, incubated for an additional five days and a final determination made. The nematode family was determined by the color of the cadaver. An ocher color indicated the presence of Xenorhabdus nematophila, the associated bacterium of Steinernema, while red indicated the presence of Photorhabdus luminescens, the associated bacterium of Heterorhabditis. The cadavers were dissected if the infecting nematode species was uncertain.
Populations of fluorescent Pseudomonas bacteria were determined using the most probable number (MPN) techniqueReference Woomer, Weaver, Angle and Bottomley15 using a 96-well microtiter plate procedureReference Gardener, Mavrodi, Thomasow and Weller16 and 210 μl of liquid King's B mediumReference Schaad, Schaad, Jones and Chun17 per well. The MPN of bacteria per gram of dry soil was determined using an Excel spreadsheet programReference Briones and Reichardt18.
Analyses of data
All chemical and biological measurements measured on a per soil weight basis were converted to a per soil volume basis using soil bulk density values. To satisfy the condition of homogeneity in the analysis of variance (ANOVA) some of the data were transformed as suggested by Gomez and GomezReference Gomez and Gomez19. The soil respiration, inorganic N and MPN data sets involved small values (e.g. less than 10) and were thus normalized with a logarithmic transformation of the form log(X+1), where X is the original data. A square root transformation of the form (X+0.5)1/2 was used for the nematode data because of its small whole number nature and large presence of zeroes. All data were analyzed using SAS20 following a split split-plot ANOVA model procedure and pair comparisons between systems using Tukey's testReference Ott and Longnecker21. In the ANOVA, systems were treated as a whole plot factor, sub-system (e.g. BMP/NT and BMP/CT) as a subplot factor, and sampling date as a sub-sub plot factor. All statistical tests were interpreted at the 5% probability level.
Results
Results from the analysis of variance for each parameter indicator are shown in Table 2. In general, system responses differed by date of sampling for soil respiration, total inorganic N, total C, total N, soil pH and soil bulk density. Significant system and/or date of sampling main effects were found for the other parameters. The error variability in the data was high for entomopathogenic nematodes and infiltration time as indicated by the resulting coefficient of variations of 64.0 and 44.0%, respectively. Despite the magnitude of the error variance for these two parameters the date source of variation was highly significant in the analysis.
Table 2. Results from the ANOVA for the nine soil quality indicator properties measured.

* and ** indicate significance at the 5 and 1% levels of probability, respectively. NS denotes non-significance.
Biological indicators
Soil respiration rates were very low to moderately low ranging from 2.0 to 13.4 kg C ha−1 day−1 (Fig. 1). This was expected knowing that the site has a low carbon pool due to excessive tillage management prior to the study and the lack of time required to increase this pool under the newly implemented systems. Generally, summer respiration rates were lowest in the two tilled systems organic and BMP/CT and highest in the two un-tilled systems successional and BMP/NT. Some studies have shown that soil biological activity is enhanced in systems that minimize or eliminate tillageReference Weil, Lowell and Shade22, while other studies have shown that no till and systems having similar characteristics mimic natural behavior unlike CT systemsReference House and Brust23. Several other studies have found a strong correlation between biological activity and degree of soil disturbance and amount of surface residueReference Karlen, Wollenhaupt, Erbach, Berry, Swan, Eash and Jordahl7, Reference Weil, Lowell and Shade22, Reference Carter24. In general, undisturbed agronomic and natural environments have greater amounts of organic substrates for decomposer organismsReference House and Alzugaray25. The decomposing rye residue at the soil surface and the subsurface decomposition of the rye root mass likely contributed to the higher respiration rates in the successional and BMP/NT systems observed in the summer. In both years, respiration rates dropped from summer to fall to rates of 6.3 kg C ha−1 day−1 or below, mainly due to a decrease in soil temperature (temperature data not shown). Soil respiration rates were much higher in the summer of 2000 compared to 1999. This could be attributed to cooler temperatures and greater rainfall. It could also be that peanut, which provides a denser soil canopy compared to corn, provides an environment more conducive to microbial activity. As discussed earlier, the differences in soil respiration rates between treatments were likely conservative because of the 24-h incubation time used for this assay. Thus it is likely that the differences between treatments were even greater than we report here.

Figure 1. Soil respiration as measured by CO2 evolution in the organic, BMP (NT and CT) and successional systems. Within each sampling date, means without a letter in common differ significantly at the 5% probability level. No significant difference between any two systems is denoted as NS.
The three species of entomopathogenic nematodes detected were Steinernema glaseri, Steinernema carpocapse and Heterorhabditis bacteriophora. In general, S. glaseri nematodes were high in numbers while numbers for other species were low (Fig. 2). Characteristics of the S. glaseri speciesReference Gaugler, Weeden, Shelton and Hoffman26–Reference Smart29 that may explain its abundance include: (1) it is highly mobile and therefore effective at finding its insect host, (2) it survives well within a wide soil temperature range 15–35°C, and (3) it has been found to survive well in coarse textured soil because of better mobility through the large pore spaces.
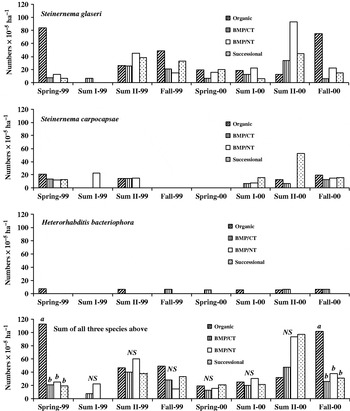
Figure 2. Nematode numbers at each sampling date in the organic, BMP (NT and CT) and successional systems. Within each sampling date, means without a letter in common differ significantly at the 5% probability level. No significant difference between any two systems is denoted as NS.
Entomopathogenic nematodes are characterized based on foraging behaviors, with ‘ambushers’ being those that remain sedentary at or near the surface waiting for passing insect hosts, and ‘cruisers’, which are highly mobile and therefore can parasitize hosts with low mobility and reside within the soil profileReference Kaya and Gaugler30. S. carpocapse, an ambusher, has been shown to be highly sensitive to tillage and is likely to persist in undisturbed systems, which tend to have greater soil surface moisture and cooler temperaturesReference Millar and Barbercheck31. The other two detected species are cruisers found to be less sensitive to tillage. Based on this, we expected to see greater numbers of S. carpocapse nematodes in the NT and successional systems and greater numbers of S. glaseri and H. bacteriophora nematodes in the CT and organic systems. However, system differences in nematode numbers were found only on the spring 1999 and fall 2000 sampling events where the organic system showed significantly higher total nematode numbers than the other three systems. The higher numbers were due to an increase in the population of S. glaseri which we cannot explain.
Bacterial numbers were generally higher in the spring and fall sampling dates and lowest in the summer sampling dates (Fig. 3). It has been shown that populations decrease into the summer months as a result of high soil temperatures and lower soil moistureReference Gunapala and Scow32. Differences between systems were found in the second summer sampling date of 1999 and in both sampling dates in 2000. In 1999, numbers were slightly higher in the two BMP systems (NT and CT). In 2000, CT had fewer numbers for the first summer date and the organic system was lowest in number for the second summer date. The differences observed are likely due to a combination of factors including differences in soil moisture, crops grown, and types of surface residue, absence or presence of tillage, and use of agricultural chemicals.

Figure 3. Bacterial numbers determined with the MPN technique at each sampling date in the organic, BMP (NT and CT) and successional systems. Within each sampling date, means without a letter in common differ significantly at the 5% probability level. No significant difference between any two systems is denoted as NS.
Chemical indicators
Concentrations of NO3-N and NH4-N were determined separately, but NH4-N values were small enough to be inconsequential, thus the NO3− and NH4+ data were pooled and results are reported as total inorganic N (Fig. 4). Inorganic N contents were low overall but some system differences did occur. The differences occurred mainly in the summer and were due to differences in fertilizer applications. A corn crop was planted in the BMP systems in 1999 and fertilized with 30% urea ammonium nitrate (UAN) once in April at a rate of 14 kg N ha−1 and again in June at a rate of 132 kg N ha−1. This explains the greater inorganic N contents found in the BMP systems in the two summer 1999 sampling dates. This was also observed in the summer sampling dates of 2000. The high inorganic N contents found in the organic system in the summer dates of 2000 likely resulted from a turkey litter incorporation of 4.5 Mg ha−1 made on May 5.

Figure 4. Total inorganic N (NO3-N+NH4-N) content in the upper 7.5 cm of soil for each sampling date in the organic, BMP (NT and CT) and successional systems. Within each sampling date, means without a letter in common differ significantly at the 5% probability level. No significant difference between any two systems is denoted as NS.
Soil total carbon and total nitrogen contents in each system varied with time (Fig. 5). These two properties did not differ between systems until fall 1999 where the untilled BMP/NT and successional systems began to show slightly higher levels than the tilled BMP/CT and organic systems. Differences between these two system groups (untilled versus tilled) became more evident in 2000. NT had the highest carbon and nitrogen content on the last sampling date (fall 2000).

Figure 5. Soil total carbon (A), total N (B) and pH (C) at each sampling date in the organic, BMP (NT and CT) and successional systems. Within each sampling date, means without a letter in common differ significantly at the 5% probability level. NS is non-significant.
We did not expect to find differences in soil carbon and nitrogen content at this early stage in the development of these systems. Many studies have reported changes with time over the long term (10+ years)Reference Karlen, Wollenhaupt, Erbach, Berry, Swan, Eash and Jordahl7, Reference Wander, Traina, Stinner and Peters33, Reference Rice, Smith and Blevins34, while few studies have found differences over short termsReference Needleman, Wander, Bollero, Boast, Sims and Bullock35.
In general, most studies agree in that tillage stimulates the decomposition of organic matter resulting in a net decline in content with time. The incorporation of organic matter into the plow layer generally exposes organic matter to higher soil moisture content than at the soil surface and therefore leads to greater decompositionReference Franzluebbers, Arshad and Ripmeester36.
Because conservation tillage systems like NT leave residues near or at the soil surface, most investigations report a substantial change in soil organic matter in surface soil as compared with CT systems. It is also known that soil organic matter is sorbed on the surfaces of the fine mineral particles to form microaggregates and in this way is protected from microbial decompositionReference Six, Pausitan, Elliot and Combrink37. Tillage breaks aggregates apart making this organic matter available to soil microbes and therefore stimulates the decomposition process.
Another factor affecting the dynamics of carbon and nitrogen in the untilled systems group (BMP/NT and successional) is the frequent wetting and drying at the soil surface. The slower decomposition of residue during dry periods decreases net losses of carbon by microbial consumption and thus favors the sequestration process. On the other hand, the frequent wetting and drying has been found to increase the resistance of certain N compounds to microbial decomposition which leads to higher total N accumulation in the surfaceReference Franzluebbers, Arshad and Ripmeester36.
Soil pH values ranged between 5.0 and 5.7 indicating moderately acid (pH 6.0–5.5) to strongly acid (pH 5.5–5.0) conditions (Fig. 5). Values from spring to fall in 1999 were somewhat consistent for the agronomic systems for organic, BMP/CT and BMP/NT. The successional system was different having a lower pH on each sampling date and also the pH decreased from spring to fall. Interestingly, the pH for all systems increased from fall 1999 to spring 2000. The same trend as in 1999 was observed in 2000 with the successional system having a lower pH on each sampling date but this year all four systems showed a decrease in pH from spring to fall.
The difference in acidity between the successional system and the other systems is likely related to differences in organic matter dynamics and microbial activities. The highly diverse group of broadleaf plants and grasses that grew in the successional system produced large amounts of plant biomass and thatch residue. The decomposition of this residue releases acid functional groups from which H+ ions dissociate. Also, the increase in residue biomass with time likely stimulated microbial activity and therefore increased the production of carbonic acid, a by-product from microbial respiration. This is supported by the observation that soil pH increased in the successional system from fall 1999 to spring 2000. During this period microbial activity is at its lowest because of low soil temperatures and therefore the production of carbonic acid is likely at its minimum. The successional system is also characterized by having grass species with massive root systems. Thus, a significant amount of carbonic acid is likely being produced as a by-product from root respiration.
Physical indicators
No differences in soil bulk density were found between systems in spring 1999 (Table 3). Averaged across systems, the bulk density was 1.36 g cm−3 on this base-line sampling date. With time, values remained at or below 1.36 g cm−3 in the tilled organic and BMP/CT systems and increased to higher levels in the untilled successional and BMP/NT systems. The increase in bulk density in the untilled systems characterizes the magnitude of natural settling and consolidation that occurred with time. In general, the natural settling of soil that occurred from fall 1999 to fall 2000 increased the bulk density of the untilled systems from 1.36 g cm−3 to 1.50 g cm−3 on the average. This final bulk density is below the critical root limiting value of 1.60 g cm−3 identified in the scientific literatureReference Jones38 for the soil type found at the study site. However, the differences in treatments observed demonstrate the importance of using bulk density to adjust soil analysis to a volume basis (see Doran and ParkinReference Doran, Parkin, Doran and Jones3, p. 29–32). The bulk densities of successional and BMP/NT systems averaged 7.3 and 14% higher than those of the organic and BMP/CT systems in fall of 1999 and 2000, respectively (Table 3). Thus, failure to adjust soil analysis (including microbial counts) from a weight to a volume basis would have resulted in an average error of interpretation of treatment comparisons in the field of from 7 to 14%—an unacceptable error by any standards.
Table 3. Soil bulk density and infiltration at each sampling date in the organic, BMP (NT and CT) and successional systems.

1 ND, not determined.
Within each sampling date, means without a letter in common differ significantly at the 5% probability level.
Despite the large error variability in the infiltration data, differences between systems were found in most sampling dates (Table 3). The general trend in the data fits well with the soil bulk density data in that the two untilled systems BMP/NT and successional had higher bulk densities and lower infiltration rates. Also, the tilled BMP/CT and organic systems had lower bulk densities and higher infiltration rates. These trends were most evident in the fall 2000 date. In general, comparing the infiltration rate average between the two tillage groups (tilled versus untilled) in fall 2000 reveals that the consolidated state of soil in the untilled systems decreased infiltration by 48.2 cm h−1.
Measurements of infiltration using ring or cylinder techniquesReference Reynolds, Elrick, Youngs, Dane and Topp39 can be naturally highly variable but there are some sources of variability that can be controlled. Since the movement of water in soil is determined by the nature of the soil matrix, any factors affecting porosity and pore-size distribution should be considered when choosing areas to be sampled. For example, wheel-trafficked areas, highly washed or eroded zones, and foot-trafficked locations should be avoided when sampling. However, wheel track areas should be assessed separately if they critically influence the characteristics of runoff, infiltration, and potential erosion from a field. Also, physical properties have been shown to vary with distance from crop rows for various reasonsReference Cassel, Unger and Van Doren40. Therefore, it is important to sample the same plot location using the crop row as a reference point.
Discussion
A resourceful soil quality assessment includes measurements of physical, chemical and biological properties that reflect the status of the multiple soil functions affecting productivity and environmental healthReference Papendick and Parr41. With this in mind, we measured soil properties that relate to critical soil functions in agricultural systems in the Atlantic Coastal Plains region. For example, excessive tillage has degraded soil properties and resulted in productivity losses in many cases. Adverse soil conditions resulting from inadequate soil management include: (1) compacted soil zones that restrict crop rooting and water movementReference Vepraskas42, (2) systems with low biological activity because of depleted soil organic matter or the system's limited ability to accumulate organic matterReference Kamprath and Welch43, and (3) increased soil acidity and high exchangeable aluminumReference Cassel44. The soil quality assessment must also consider temporal and spatial variations of these functionsReference Larson and Pierce45. We therefore measured the soil properties collectively and at the same field locations over time.
At this early stage of this long-term study, statistical differences between systems were found for all soil quality indicators except for entomopathogenic nematodes. For most indicators, the error variances in the statistical analyses were low, indicating that sample numbers were adequate. The nature of system response varied from sampling date to sampling date for most properties. This differential response emphasizes the importance of multiple sampling when evaluating soil quality and when making comparative system evaluations.
The biological assessment was emphasized by including not only soil respiration measurements but also populations of beneficial soil bacteria and entomopathogenic nematodes. We believe these organisms contribute to the overall health of the soil ecosystem because of their link to disease suppressive soils and parasitism of plant pests. At this early stage it is difficult to conclude that these parameters are sensitive to soil management. It is our hope that these measurements become useful as a survey of endemic populations at this early stage and as a base-line point in an expected long-term differential response.
The soil respiration data indicated higher microbial activity in the BMP/NT and successional untilled systems. As discussed earlier, these differences would likely have been 2–4 fold higher had a half-hour respiration incubation time been used. While this in situ, simple and relatively fast method of evaluating CO2 efflux proved to be system-sensitive, it has no way to differentiate between efflux from root respiration and efflux from microbial respiration. Also, the method does not provide for a standard or critical level that can be used to determine how much CO2 evolved is ‘good’ or excessive, or results in a net loss of carbon from the system.
Like the biological data, the chemical data (total C, total N, soil pH and inorganic N) was sensitive to system management. For total C and N, differences between systems were most evident in the 2000 sampling dates, with BMP/NT showing greater contents on the last sampling date. The soil pH and inorganic N results do not suggest a possible difference in soil function status between any two of the agricultural systems studied. All three agricultural systems, BMP/NT, BMP/CT and organic, had similar pH values and overall low soil inorganic N levels. The successional system had a slightly more acidic soil condition than the three other systems.
Soil bulk density increased with time in the untilled BMP/NT and successional systems but the resulting values were not considered detrimental to either productivity or environmental quality. The magnitude of difference in bulk density between the two tilled BMP/CT and organic systems and the two untilled BMP/NT and successional systems accents the importance of expressing the results of soil quality indices on a volumetric rather than a gravimetric basis. By fall 2000, these two system groups differed in bulk density by 0.20 g cm−3, a difference that results in the calculated volumetric index value being 15% greater in the untilled systems relative to the tilled systems.
The infiltration measurements were highly variable but the system effect was large in magnitude on some sampling dates and therefore significant in the statistical analysis. It is important to avoid added variability with this measurement by choosing appropriate sampling locations that represent overall field conditions. For example, disturbed areas by vehicular or foot traffic or eroded or highly washed areas that do not represent the overall surface of the system being evaluated should be avoided.
In conclusion, most soil quality indicators proved to be sensitive to the detection of rapid changes in soil conditions that occur by the influence of soil management. The results fulfill the first phase of the long-term soil quality assessment being conducted at the experimental site; to document the soil conditions of the systems at their inception. The soil quality indicators will be measured multiple times in the next several years to monitor temporal changes in soil function. The base-line information generated in this study and the long-term monitoring of the systems will be used to evaluate the amount, direction, and speed of change in soil quality and resulting impacts on crop productivity and the environment.


