Introduction
Andalusia, the southernmost region of Spain, is the main olive-growing area in the world, producing more than one-third of the world's olive oil 1 , 2 . Olive groves dominate the landscape of Andalusia on approximately 1.5 million-ha or 17% of the total surface area of the region. Despite a recent trend toward new intensive olive groves in valley areas, almost half of the olive farms are located on slopes steeper than 15% and 80% of the olive grove acreage is rain-fed 1 , 3 . Traditional olive orchard management is based on low tree densities (<140 trees ha−1) 3 , tree crown size is controlled by pruning, and weed control through repeated tillage and/or herbicide use, in order to sustain production in areas where rainfall is limited and highly variable from year to year. The combination of a Mediterranean-type climate with periodical torrential rainstorms, sloping areas and management practices that fail to provide ground cover year-round, is associated with severe problems of soil erosion in many olive-farming areas of Andalusia, accompanied by soil fertility depletion, biodiversity loss and environmental degradationReference Gómez, Giráldez and Gómez 4 , Reference Beaufoy 5 .
In the past decade, a growing number of olive farmers in Andalusia have shifted from conventional to organic farming. In 2011, there were over 56,000 ha of organic olive groves 1 , with 40% located in the province of Córdoba. This shift to organic olive production in Andalusia has accelerated the adoption of sustainable management practices aimed at soil conservation, in addition to the prohibition of synthetic fertilizers and pesticides. Milgroom et al.Reference Milgroom, Soriano, Garrido, Gómez and Fereres 6 reported that the shift to organic olive production in the province of Córdoba was accompanied by a reduction in tillage and an increase in grazing livestock or mechanical mowing to control weeds, which decreased the risk of soil erosion, based on a visual assessment of erosionReference Milgroom, Soriano, Garrido, Gómez and Fereres 6 , Reference Milgroom, Gómez, Soriano and Fereres 7 . However, little is known about the effects of shifting from conventional to organic farming on soil properties based on different soil management practices in olive orchards of Andalusia, where organic farming was officially regulated in 1991. Álvarez et al.Reference Álvarez, Soriano, Landa and Gómez 8 showed that organic olive orchards in a mountainous area in the north of Córdoba had soil properties (i.e., bulk density, macroaggregate stability, saturated hydraulic conductivity, phosphorus (P), potassium (K), cation exchange capacity (CEC), soil respiration and bacterial population) similar to those in natural adjacent areas, although generally lower in the tilled than in the grazed organic olive groves, but organic carbon (C) and nitrogen (N) tended to be higher in natural areas than in organic olive groves. However, these olive groves were in mountainous areas characterized by steep slopes and low productivity, where farmers have traditionally employed very low-intensity management systemsReference Milgroom, Soriano, Garrido, Gómez and Fereres 6 , Reference Álvarez, Soriano, Landa and Gómez 8 .
In Andalusia, where olive tree cultivation is of great socio-economic importance, the most representative olive groves occupy about three-quarters of the total olive-grove area, and are located on hills and rolling plains with level to moderate slopes (below 20%) 3 . In these intensified, traditional rain-fed olive groves, farmers typically manage weeds throughout the year through repeated tillage and/or herbicide application with the primary goal of reducing weed competition for scarce water resources. In Campiña (natural region, in the southern part of Córdoba province, characterized by a rolling landscape), the shift to organic olive production has resulted in a decrease in tillage intensity without herbicides, and in an increase in mechanical mowing to control weedsReference Milgroom, Soriano, Garrido, Gómez and Fereres 6 . The objective of this study was to evaluate soil properties in organic olive groves under different soil management systems in Campiña, more than 5 years after conversion from conventional to organic farming, comparing them with soil properties in nearby undisturbed areas with natural vegetation.
Materials and Methods
Study site and organic olive farm characteristics
The study area was located in Campiña, south Córdoba, (between 37.75° − 37.20°N and 4.67° − 4.17°W). The climate in the area is typically Mediterranean, with an average annual rainfall of around 560 mm, concentrated between November and April, an average mean annual temperature of 16 °C, and an average annual reference evapotranspiration (ETo) of 1250 mm. Elevation in the study area ranges from 230 to 593 m.
Twenty rain-fed organic olive farms were selected in Campiña for the study. Organic olive farms were characterized based on the number of years since the farms were certified as organic. The main soil types on the farms were Calcaric Regosol and Calcic Cambisol 9 . Two soil management systems to control weeds were identified: tillage (T) and mechanical mowing (M). Five olive farms were selected for each soil management system in each soil type. Additional conditions for a farm to be selected included at least three decades of olive production and use of their current soil management system for at least the five preceding years. Information about organic olive farms was collected from the Andalusian Committee of Ecological Agriculture (CAAE; a control, certification and training organization) database. Six undisturbed (U) areas with natural vegetation typical of the Mediterranean maquis (i.e., sclerophyll and aromatic perennial shrubs) were selected to serve as benchmark soils for U areas. U areas are not frequent in the study area; so three U areas adjacent to the olive groves were selected in each of the two soil types.
Each farmer was interviewed for a complete description of their olive-farming practices and fruit yields over the past 3 years. Soil management prior to organic management was bare soil, controlling weeds by tillage and/or spraying with herbicides. The T system, defined as non-inverting-shallow T, consisted of three passes of a chisel-plough and/or cultivator (10–20 cm depth) in the spring, after rainfall events and weed growth; and usually one pass of a tine-harrow in the summer. Weed management with a mechanical mower (usually a reel mower) was performed one to three times a year during the spring, depending on weed growth. Therefore, the cover remained during the winter. Fertilization of olive orchards was similar regardless of the soil management system, providing generally 3–4 kg of organic fertilizer (14.3% N, 0.65% P and 4.41% K; N-plus, Nitrorganic S.L., Cabra, Spain) per tree per year. In general, olive pruning was completed every 2 years and the pruning residues were chopped and incorporated into the soil (∼1.2 Mg ha−1). Pruning consisted of thinning of branches using hand tools to improve lighting inside the tree, and the shortening of the upper branches.
Field measurements, soil sampling and analysis
Fieldwork was conducted in late spring 2006. On each farm, a sampling area, considered representative of the olive orchard, was selected. Within each sampling area, olive tree planting density was determined by measuring tree distances (between and inside rows). Olive tree crown volume was determined by measuring the crown major axes in five representative olive trees, and calculated assuming an ellipsoidal shape. Tree crown cover was calculated as the product of the mean horizontal crown area and olive tree density. A representative sampling area was also selected in each natural area.
Soil sampling and measurements were carried out outside the canopy of the tree. Slope was measured at five random points with a pocket inclinometer. Vegetative and stone ground covers were measured by the visual method of HerwegReference Herweg 10 in ten random areas (0.5 m × 0.5 m each). Water infiltration rate was measured at five random points using single rings (21.5 cm diameter) inserted 5 cm into the ground, in tests lasting 1.8 h with constant water depth of 4 cm. Field-saturated hydraulic conductivity (K s) was calculated from the data obtained in the water infiltration rate testsReference Wu, Pan, Mitchell and Sanden 11 . Soil bulk density was measured at eight random points using a cylindrical core sampler (5.0 cm diameter, 5.0 cm high) at two soil depths (0–10 and 10–20 cm).
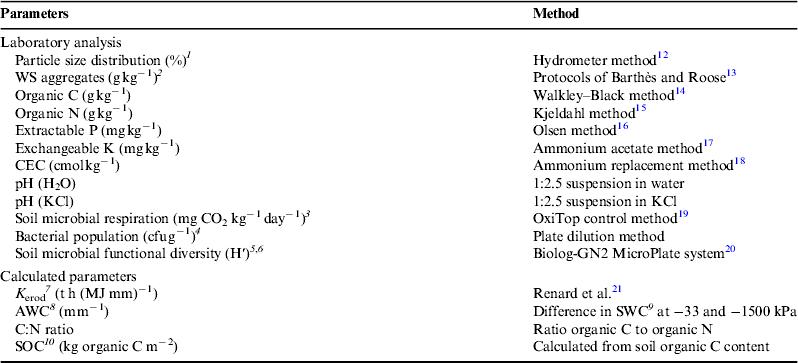
Soil samples for laboratory analyses were collected at five random points in each sampling area, at two soil depths (0–10 and 10–20 cm) (Table 1). Soil structure was determined visuallyReference Schoeneberger, Wysocki, Benham and Broderson 24 in each of the two soil depths. Soil samples were air-dried, and passed through a 2 -mm sieve before chemical and physical analyses. Samples for the determination of soil biological properties were collected at five random points (0–10 cm depth) in all sampling areas during the same day, July 12, 2006; soil was sieved through a 2-mm screen, and refrigerated at −20 °C within 24 h of the sampling.
Table 1. Soil physical, chemical and biological properties analyzed, and analytical methods used.
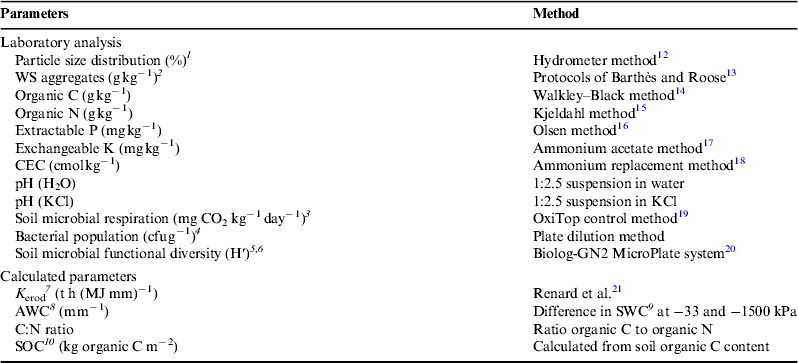
1 Coarse sand (2.0–0.1 mm) and fine sand (0.1–0.05 mm) were separated by wet sieving.
2 Water-stable aggregates separated into WS-microaggregates (<0.02 mm), WS-mesoaggregates (0.02–0.2 mm) and WS-macroaggregates (>0.2 mm) on a basis free of coarse sand (>0.25 mm).
3 100 g of soil (dry weight) moistened to 50% of soil water-holding capacity and 50-ml beaker filled with a 1 M NaOH solution in an incubation cabinet (WTW, Weilheim, Germany) at darkness and 20 °C for 1 day.
4 Suspension of 5 g soil in 50 ml of 0.85% w/v NaCl solution, shaken for 60 min, centrifuged at 150 g for 3 min, diluted from 10−1 to 10−4, and inoculated in duplicate using 0.1 ml onto nutrient agar (Difco, Detroit, MI, USA) plates; viable bacterial colonies (colony-forming units, cfu) were counted after 4 days, incubation at 22–24 °C.
5 Calculated using the Shannon diversity index (H′)Reference Zak, Willig, Moorhead and Wildman 22 .
6 Biolog GN2 MicroPlate system (Biolog Inc., Hayward, CA), containing a water-blank well and 95 different C sources for identification of aerobic Gram-negative bacteria; each of 96 wells of microplates inoculated with 120 μl suspension of 2 ml from 1:10 dilution (5 g soil in 50 ml of 0.85% w/v NaCl solution) in 18 ml of 0.85% NaCl solution, and incubated at 25 °C; colour development measured every 12 h up to 312 h by reading absorbance at 595 nm.
7 Soil erodibility estimated from field measurements and soil analysis.
8 Available water-holding capacity of the soil.
9 Soil water content, estimated using particle size distribution, bulk density, stone volume, organic C and CEC measurementsReference Rawls, Brakensiek and Morel-Seytoux 23 .
10 Organic C stocks in any soil layer taking into account bulk density and stone volume.
Energy consumption
Energy consumption in mechanical operations (non-inverting-shallow T or mechanical M) for weed control included energy consumption of machinery and implements (tractor and cultivator/chisel-plough or mechanical mower) and human labor. Basic data for calculating the energy consumption of machinery and implements were obtained from Guzmán and AlonsoReference Guzmán and Alonso 25 . The diesel fuel energy (content plus industrial manufacture) was 43.33 MJ l−1, and estimated average of diesel fuel consumption for tractor was 0.15 l kW-h−1. With regard to human labor, a value of 2.2 MJ h−1 was usedReference Guzmán and Alonso 25 , Reference Fluck and Fluck 26 . Thus, the total energy requirements were approximately 644 MJ h−1 for both weed control strategies (tractor 4 × 4, 90 kW; and mechanical mower or cultivator of similar weight, 700 kg, and hours of useful life, 2500 h)Reference Guzmán and Alonso 25 , of which 91% (585 MJ h−1) was attributable to diesel fuel consumption. Although the total time required for each weeding operation was variable, depending on the specific tractor and farm implements used and soil conditions (e.g., slope, stoniness), in organic olive farms in this study it reached 2 h ha−1 for the most unfavorable conditions (i.e., 1.29 GJ ha−1 of energy consumption).
Statistical analyses
Separate one-way analyses of variance (ANOVA) of soil properties were performed for each soil depth, with soil management system and soil type as factors. To satisfy ANOVA assumptions, field-saturated hydraulic conductivity and bacterial population data were log-transformed by log(x + 1) and log(x), respectively, before analysisReference Steel and Torrie 27 . Statistical results (P values) relate to transformed data.
To investigate the effects of soil management system and soil type on soil properties at farm level, a standardized principal component analysis (PCA)Reference Dunteman 28 , based on a correlation matrix, was performed for the topsoil layer (0–10 cm depth), using untransformed data. Soil type and management system effects on specific soil properties were assessed using standardized scores of the most significant principal components (PCs) for each individual olive orchard and U area.
Results
Olive orchard characteristics
The organic olive orchards evaluated averaged 3130 kg ha−1 yr−1 in olive fruit yield for 2003–05, with no significant differences due to soil management system (Table 2), although the relatively high farm-to-farm variability in yield suggests that in order to detect possible differences at the level of the values observed, a larger sample, if possible, should be included in future studies. The average yield was similar to the average value for rain-fed olive groves in the study area (3211 kg ha−1 yr−1 for 2003–05) 1 . Tree density was relatively low (average of 106 trees ha−1), similar to that in the traditional rain-fed olive groves in the study area (112 trees ha−1) 3 ; however, the trees have two or three trunks, forming relatively large canopies (average crown volume of 66 m3 tree−1), which covered 25% of the ground (Table 2). Exposed stones covered 11% of ground surface. The vegetative ground cover in late spring was 61% in the mowed orchards, as in U areas, compared with 9% in tilled orchards (Table 2).
Table 2. Characteristics of the organic olive orchards studied, as per soil-management system (mean values ± standard error).

1 Average, years 2003–05.
2 Measured in spring.
Soil properties
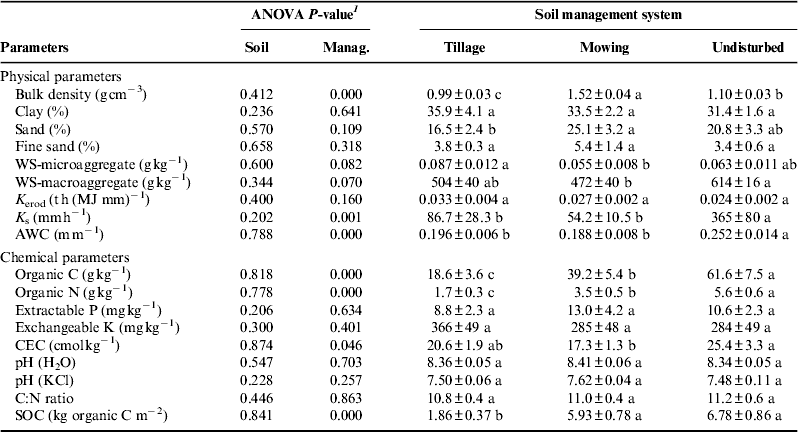
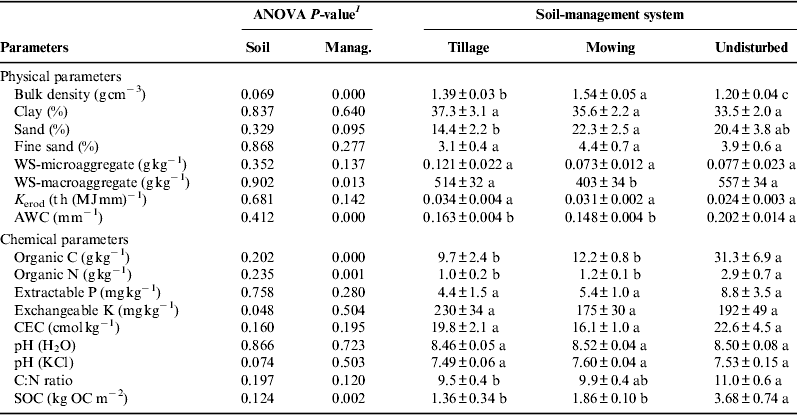
There were no differences for any of the soil physical and chemical properties analyzed (Table 3) in the soil surface (0–10 cm depth) between the two soil types (P > 0.1; Table 3). In the soil sub-surface (10–20 cm depth), similar results were obtained (Table 4). A comparison of values between surface and sub-surface values showed a decrease in available water-holding capacity (AWC) of the soil, organic C content and soil organic carbon (SOC) stocks, nutrient content (N, P and K) and C:N ratio, and an increase in bulk density, affected by soil management, and pHw, with depth. Soil structure was generally blocky, at both soil depths, and showed a characteristic cracking due to the presence of expansible clay minerals (smectite) typical of soils in Campiña 29 . Soil texture ranged from loam to clay, with a predominance of clay-loam (USDA classificationReference Gee, Bauder and Klute 30 ), with the sampled areas displaying no differences in particle-size fractions between the two soil depths.
Table 3. Physical and chemical soil surface properties (0–10 cm depth) in organic olive orchards under current soil management systems and in U areas in Campiña (southern Córdoba), (mean values ± standard error for the two soil types combined). Different letters within a row indicate significant differences (Fisher's LSD test; P < 0.05).
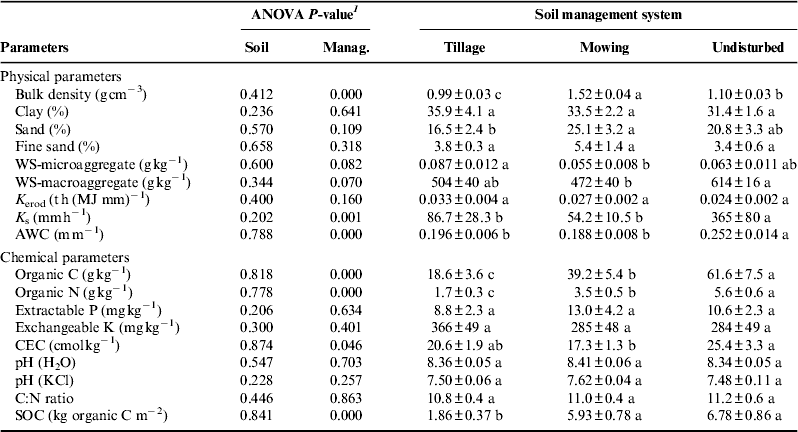
1 P-value for separate one-way ANOVA for soil-type and soil-management system factors.
Table 4. Physical and chemical soil sub-surface properties (10–20 cm depth) in organic olive orchards and in U areas evaluated in Campiña (southern Córdoba), (mean values ± standard error for the two soil types combined). Different letters within a row indicate significant differences (Fisher's LSD test; P < 0.05).
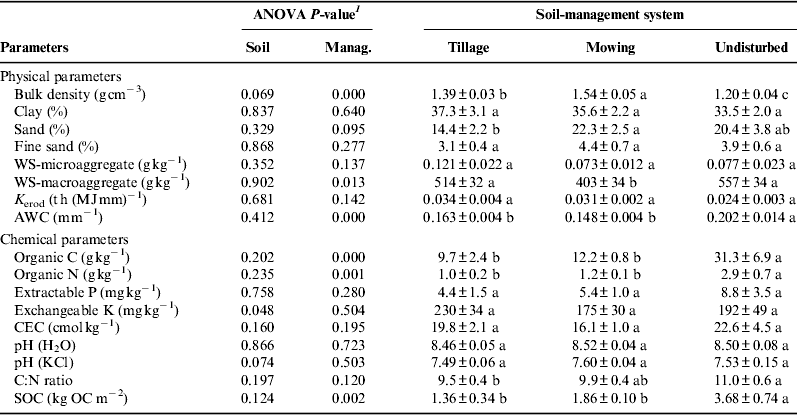
1 P-value for separate one-way ANOVA for soil-type and soil-management system factors.
Bulk density values were significantly lower in the surface layer of tilled orchards. The mowed olive orchards were significantly more compacted than the tilled orchards or the U areas at the two soil depths (Tables 3 and 4). The water-stable (WS) macroaggregate values were high, with a trend towards higher values in the U areas. This high stability of the WS-macroaggregates, and the developed soil structure observed in the field, are correlated with the high values of K s for these soil texturesReference Rawls, Brakensiek and Morel-Seytoux 23 , which were much higher in the U areas compared with the olive orchards. AWC was higher in the U areas (at both soil depths) with similar values between the T and M orchards. Olive orchards had an AWC average value (0–20 cm depth) of 0.18 and 0.17 m m−1 for T and M soil management, respectively, while U areas showed higher values of 0.23 m m−1 (Tables 3 and 4).
Organic C content in soil was clearly affected by the soil management system. Average organic C contents in the olive orchards were 19 and 39 g kg−1 in the top 10 cm of soil, and 10 and 12 g kg−1 in the sub-surface layer, for T and M soil management, respectively, which were lower values than those measured in the U areas (62 and 31 g kg−1, in surface and sub-surface layer, respectively). As a result, the average values of SOC stock in the top 20 cm of soil were 31 and 74% of that in the U areas for T and M olive orchards, respectively (Tables 3 and 4). Nevertheless, values of organic C content in T orchards were in the upper range of the values reported for rain-fed agricultural soils in the same study area 29 and for traditional olive groves in the regionReference Benítez, Pedrajas, del Campillo and Torrent 31 . Organic N content in soil followed a similar pattern to that of organic C (Tables 3 and 4). Organic N content in soils in olive orchards was in the medium range of values recommended for olive cultivationReference García, Ruíz, Cano, Pérez and Molina 32 . The C:N ratio was within normal values (9–12) for agricultural soilsReference Young, Aldag and Stevenson 33 , with no differences between soil management systems. There were no differences in extractable P and exchangeable K content among the U, M and T areas. Extractable P content was lower than recommended values for olive cultivation in soils of a similar textureReference García, Ruíz, Cano, Pérez and Molina 32 , Reference Pastor, Navarro, Vega and Castro 34 , while exchangeable K content was within recommended values for olive farming in soils with high clay contentReference García, Ruíz, Cano, Pérez and Molina 32 , Reference Pastor, Navarro, Vega and Castro 34 . CEC values were in the adequate range for agricultural soils with high clay contentReference Pastor, Navarro, Vega and Castro 34 , with U areas having higher values (Tables 3 and 4).
Biological activity (microbial respiration and bacterial populations) were higher in the M orchards compared with the T orchards and U areas (Table 5). This could be influenced by the mowing operations in M orchards, carried out 6–7 weeks before sampling, and by subsequent decomposition of weed residues, left on the soil surface, by soil micro-organisms. Soil microbial respiration and bacterial populations were linearly correlated (P < 0.001). Functional microbial diversity values (Shannon index, H′) ranged from a maximum of 4.42 to a minimum of 4.02, with no differences due to soil management (Table 5).
Table 5. Biological soil surface properties (0–10 cm depth) in organic olive orchards under current soil management systems and in U areas in Campiña (southern Córdoba province), (mean values ± standard error for the two soil types combined). Different letters within a row indicate significant differences (Fisher's LSD test; P < 0.05).

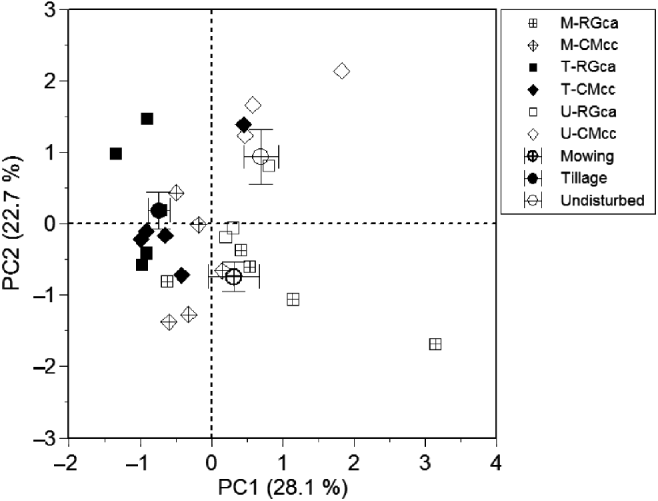
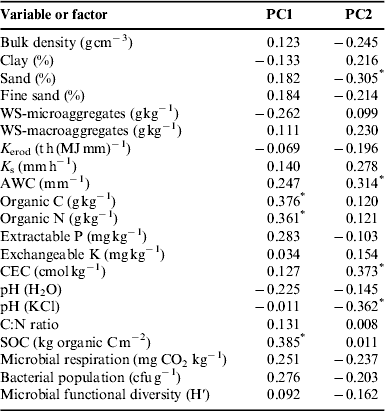
Results (eigenvalues) from the PCA showed that the first two PCs explained over 50% of the variance of total data set (PC1: 28.1%; PC2: 22.7%) (Fig. 1). The first PC (PC1) separated T from M orchards and U areas (ANOVA P-value <0.005), (U = M>T), and was composed of soil chemical properties (organic C and N contents, and SOC stock; Tables 3 and 6), which were affected by the soil management system. This separation at the farm level reflects differences in soil properties related to SOC stock, which had higher loads in PC1 (Table 6). These values tended to be higher in the U areas, and lowest in the T orchards (Table 3). However, there was a relatively high variability from farm to farm within the same soil management system, probably reflecting specific farm conditions such as differences in topography, soil management and farming practices or previous management history in that particular farm. There were no significant soil type effects on PC1 scores. PC2 included soil properties that related to soil parent materials (i.e., sand content and associated AWC, pHKCl and CEC; Table 6) and was also affected by soil management (Table 3). PC2 scores showed significant differences (P < 0.005) between farms due to soil management system (U = T>M; Fig. 1), reflecting management system effects on some physical and chemical soil properties related to soil fertility and productivity (e.g., AWC and CEC). However, it was not possible to separate effects based on the two soil types (P > 0.5) (Fig. 1), due to the similarity between both soil types in the sampling areas in this study (Table 3).

Figure 1. Soil-management and soil-type effects on the first and second principal components (PC1 and PC2) derived from standardized PCA using overall data sets for topsoil (0–10 cm depth). Symbols represent the PC scores of individual olive orchards (T or M) or U areas located in the Calcaric Regosol (RGca) and Calcic Cambisol (CMcc) soil types. Circles show mean scores for each soil management or soil use, and bars represent the standard error of the mean.
Table 6. Factor loadings for the two PCs (>50% of PC's explained variance) from standardized PCA for all soil variables measured in the topsoil layer (0–10 cm depth).

* Variables are considered significant for loadings >|0.3|.
Discussion
Olive orchard characteristics
The organic olive orchards studied in Campiña presented similar productivity as the average of conventionally managed, rain-fed olive groves in the area, with the T orchards presenting a numerically higher average yield (3354 kg ha−1 yr−1), which was not statistically significant. The amount of water transpired by the olive trees is the key factor that determines the yield of rain-fed olive groves in this region 35 . Thus, organic farmers in the study area have been able to increase soil protection without increasing weed competition for soil water resources, particularly when weeds are left to grow during the rainy, cold season (autumn–winter), when ETo is low and soil surface remains wet for a considerable number of days. This mitigates the differences between soil water use by the weeds and that directly evaporated from the soil surface in the unvegetated areas. Studies in Andalusia have shown that olive groves with a vegetative cover tended to have greater potential to reduce run-off lossesReference Gómez and Benites 36 , Reference Gómez, Giráldez and Fereres 37 , due to increased surface roughness and a higher infiltration rate due to greater effective macro-porosity. Thus, organic olive yields in Campiña suggest that conventional rain-fed olive orchards that are at a similar production level, should consider shifting from herbicide-based weed management to a soil management system based on a vegetative cover during autumn and winter, without incurring yield losses. Nevertheless, further studies in different bioclimatic areas in the region are required to validate that hypothesis for each area, and to develop the technical advice that should be provided to the farmers to prevent excessive weed growth in early spring.
Soil properties
The T orchards studied had a lower SOC level, possibly associated with increased weed biomass in the M orchards, and the acceleration of the mineralization of the soil organic matter (SOM) caused by tillage. Nevertheless, in the T orchards, the organic C content was higher than the minimum levels in the topsoil of olive groves recommended by the regional authorities to prevent severe soil degradation (1% SOM, or 5.8 g kg−1 organic C) 38 . The organic C measured in the soil surface (0–10 cm depth) of the T orchards (19 g kg−1; Table 3) was much higher than traditional rain-fed olive orchards with a soil management based on conventional tillage (10 g kg−1), or bare soil from herbicide use (6 g kg−1), in a similar olive-growing area of AndalusiaReference Castro, Fernández-Ondoño, Rodríguez, Lallena, Sierra and Aguilar 39 . However, soil organic C and N content in the organic olive orchards (even in the M orchards) was less than the U areas. The organic olive orchards studied maintained high WS-macroaggegate values regardless of soil management system. This can be related to their relatively high clay content, and the relatively high organic C content for an agricultural soil under Mediterranean conditions. This also indicates a high resilience for the type of tillage performed in the organic olive orchards studied. The olive orchards also showed relatively high K s values due to high WS soil aggregates. The organic olive orchards maintained similar (T orchards) or higher (M orchards) values of microbial respiration rates, soil bacterial populations and functional microbial diversity than those measured in the U areas. Thus, comparison with the U areas suggests that overall the soil management systems maintained in the organic orchards (either M or T) has helped to preserve the biological activity of these soils under olive farming.
Sustainability of traditional olive groves
The evaluation of soil properties in organic olive groves can provide some insight into the potential for conventional olive groves located in the same landscape that have started cover-crop-oriented soil management to increase their soil quality. In Andalusia, more than half of the olive groves are located on slopes less than 15% 3 , and are therefore not subjected to the compulsory CAP regulations. A significant reluctance to extend cover crop management in olive groves in the less steep areas, as well as some open questions about its viability, especially on intensive farms, remain in the region. In the olive orchards located in areas steeper than 15%, the compulsory implementation under CAP regulations 40 , 41 of permanent cover crop management can result in a significant increase in soil organic C content, compared with the compulsory alternative of conservation tillage management, or soil management based on herbicidesReference Castro, Fernández-Ondoño, Rodríguez, Lallena, Sierra and Aguilar 39 . This modification of soil management should also result in a significant decrease in soil losses by water erosion, one of the objectives of such implementation. Although not addressed in this study, the results obtained in other modeling and experimental studies in olive orchards in AndalusiaReference Gómez, Giráldez and Gómez 4 , Reference Gómez, Giráldez and Fereres 37 indicated that soil erosion rates at hill-slope scale can be reduced to 28 or 12% for M and T management systems described in this study, respectively, compared with bare soil management based on year-round tillage. The results obtained in this study suggest that tillage can be used occasionally between early spring and early autumn to control weed growth without severe erosion. Further studies aimed at improving soil erosion estimations in the study area are needed to reduce uncertainty over erosion predictions, and, therefore, any discussion about the long-term sustainability of organic olive farming in the area.
Although the environmental sustainability of Andalusian olive groves has to be through the adoption of sustainable soil management practices, in the endeavors to prevent soil loss and soil degradation, these alternative managements could contribute to the reduction of non-renewable energy consumption. The total energy invested in weed control practices in traditional rain-fed olive groves was around 5.65 and 5.32 GJ ha−1 yr−1 for conventional and organic olive groves, respectivelyReference Guzmán and Alonso 25 . Energy consumption in each mechanical operation for weed control (T or M) reached 1.29 GJ ha−1 (1.17 GJ ha−1 of fuel consumption), in organic olive farms in this study. Therefore, the adoption of soil management systems that reduce the number of mechanical operations in the olive groves, as presented in this study (non-inverting-shallow T and mechanical M), could also reduce the consumption of non-renewable fossil-fuel energy, which in turn would be an additional contribution to the environmental sustainability of traditional olive groves in Andalusia.
Acknowledgements
We gratefully acknowledge the support from the regional government of Andalusia through project C03-058. We also thank D. José Miguel Garrido and the Andalusian Committee for Organic Farming for their collaboration and support in this study.


