


Introduction
Cover crops are valuable tools for building sustainable agricultural systems through their role in improving soil health, reducing erosion, increasing soil organic carbon (SOC) levels, suppressing weeds and pests, supplying and retaining nutrients and fostering beneficial biodiversity (Schipanski et al., Reference Schipanski, Barbercheck, Douglas, Finney, Haider, Kaye, Kemanian, Mortensen, Ryan, Tooker and White2014; Blanco-Canqui et al., Reference Blanco-Canqui, Shaver, Lindquist, Shapiro, Elmore, Francis and Hergert2015). Roots seem to play a pivotal role in supplying these services, yet cover crop root traits remain poorly characterized. The gap in knowledge of cover crop root traits limits our ability to recommend cover crops for intended ecosystem services. For example, increasing SOC is a top motivation for planting cover crops (CTIC, 2015, 2016) and an emerging body of literature suggests that root carbon inputs contribute equally or more to SOC than aboveground carbon inputs despite a smaller mass (Puget and Drinkwater, Reference Puget and Drinkwater2001; Rasse et al., Reference Rasse, Rumpel and Dignac2005; Kong and Six, Reference Kong and Six2010; Mazzilli et al., Reference Mazzilli, Kemanian, Ernst, Jackson and Piñeiro2015; Austin et al., Reference Austin, Wickings, McDaniel, Robertson and Grandy2017). Therefore, if cover crops are planted to increase SOC, we must address the gap in knowledge surrounding the quantity, quality and distribution of cover crop roots.
Recently, cover crop bicultures and mixtures (more than two species) have grown in popularity as a way to increase aboveground biomass production and to reduce the C:N ratio of aboveground biomass compared to non-legume monocultures (Finney and Kaye, Reference Finney and Kaye2016; White et al., Reference White, DuPont, Hautau, Hartman, Finney, Bradley, LaChance and Kaye2017). Grass–legume bicultures can produce as much or more aboveground biomass compared to component species grown in monocultures (Ranells and Wagger, Reference Ranells and Wagger1996; Hayden et al., Reference Hayden, Ngouajio and Brainard2014; Poffenbarger et al., Reference Poffenbarger, Mirsky, Weil, Maul, Kramer, Spargo and Cavigelli2015). However, an extensive study on aboveground biomass production of cover crop mixtures demonstrated that mixtures infrequently produce more aboveground biomass than the most productive species as a monoculture (Finney et al., Reference Finney, White and Kaye2016). Although a mixture may not produce more biomass than the most productive non-legume as a monoculture, mixtures can improve biomass production compared to less productive legume species whereas reducing the mixture's C:N ratio (Finney et al., Reference Finney, Murrell, White, Baraibar, Barbercheck, Bradley, Cornelisse, Hunter, Kaye, Mortensen, Mullen and Schipanski2017). These assertions were based solely on aboveground measurements. Therefore, measuring root traits of mixtures has the potential to deepen our understanding of the benefits of cover crop mixtures.
To date, there have only been a few studies that assessed root traits of grass–legume bicultures, and no research about root traits of more diverse cover crop mixtures. An intercropping experiment, where barley and field pea were planted similarly to a cover crop biculture, demonstrated that when barley and field pea were intercropped, barley increased its root distribution both laterally and vertically compared to barley when it was planted as a monoculture (Hauggaard-Nielsen et al., Reference Hauggaard-Nielsen, Ambus and Jensen2001). Another study on barley-hairy vetch bicultures found that root length density (RLD, cm root length cm−3) and rooting depth were greater for barley and the barley-vetch biculture than hairy vetch alone. Between 0.8 and 1.2 m depth, they showed that the barley-vetch biculture had more RLD than the barley monoculture (Ramirez-Garcia et al., Reference Ramirez-Garcia, Martens, Quemada and Thorup-Kristensen2015). Thus, cover crop mixtures may be able to improve root traits, such as root biomass production, horizontal and vertical root distribution, and C:N ratio, compared to component species as monocultures.
To provide more information about root traits of cover crop monocultures and mixtures, we studied root traits of four winter annual cover crop treatments: three monocultures and a five species (5 spp.) mixture within a larger maize–soybean–winter wheat organic field experiment comparing 12 cover crop treatments. Cover crop monocultures were selected to compare root traits from three different plant families. Triticale (Poaceae), canola (Brassicaceae) and crimson clover (Fabaceae) have diverse root systems given their distinct evolutionary histories (Bodner et al., Reference Bodner, Leitner, Nakhforoosh, Sobotik, Moder and Kaul2013). Triticale, a monocot, has a fibrous root system. Whereas canola and crimson clover, two eudicots, possess a taproot that can undergo secondary growth, which refers to widening of stem or root tissue. Additionally, plants within the Fabaceae family, also known as legumes, can fix atmospheric nitrogen.
The 5 spp. mixture was selected to look at the root interactions between these three species. Although five species were planted, two species, red clover and Austrian winter pea were extremely rare in the 5 spp. plots. We did not sample red clover and Austrian winter pea monoculture plots for this reason. Therefore, the mixture expressed itself as a 3 spp. mixture of canola, crimson clover and triticale. Combining these three species provides two opportunities for complementary root traits that might enhance the quantity, quality and distribution compared to component monocultures. Monocot and eudicot species may have complementary root architectures that would allow a mixture to explore a greater volume of the soil compared to monocultures. Legumes and non-legumes have complementary nitrogen acquisition strategies that may reduce mixture root C:N compared to non-legume monocultures.
We examined differences between the following root traits: root biomass C, R:S ratio, C:N ratio, vertical root distribution (0–5, 5–20 and 20–40 cm), lateral root distribution (in-row vs between-row), and root size distribution (<2 and >2 mm in diameter) in fall and spring. Since roots are highly plastic, the root traits measured in this field experiment reflect the planting window, climate and soil conditions of the site (Bardgett et al., Reference Bardgett, Mommer and De Vries2014). Additionally, we calculated C inputs for the entire rotation, which included total inputs for cover crops, cash crops and manure applications. The objectives of this study were threefold. First, we determined how root traits varied among three winter annual cover crop species: crimson clover, canola and triticale. Second, we ascertained whether a cover crop mixture could increase the quantity, quality and distribution of roots compared to component monocultures. Finally, we assessed contributions of cover crop and cash crop root carbon inputs to the cumulative C inputs of an organic soybean–winter wheat–corn grain rotation.
Materials and methods
Site
Research was conducted within a larger organic maize–soybean–winter wheat field experiment located at the Russell E. Larson Agricultural Research Center near Rock Springs, P.A. (40°43′N, 77°55′W, 350 m elevation). These research plots have been maintained since 2012 and contain additional cover crop treatments that were not featured in this cover crop root investigation. Mean annual precipitation at the research station was 975 mm and mean monthly temperatures ranged from 3°C in January to 22°C in July. The research site was classified as a USDA hardiness zone of 6b, which corresponded to an average annual minimum winter temperature of −20°C. Murrill channery silt loam (fine-loamy, mixed, semiactive and mesic Typic Hapludalf) was the dominant soil series in the field experiment (>80% of site area). The two less dominant soil series were Hagerstown silt loam (fine, mixed, semiactive and mesic Typic Hapludalf) and Buchanan channery loam (fine-loamy, mixed, semiactive and mesic Aquic Fragiudult) (Murrell et al., Reference Murrell, Schipanski, Finney, Hunter, Burgess, LaChance, Baraibar, White, Mortensen and Kaye2016; Soil Survey Staff, 2017). The field site was characterized for texture, soil organic matter (SOM), pH and Mehlich 3 extractable nutrients at the sub-plot level by the Penn State Agricultural Analytical Services Lab. Field characterization data were averaged across the sub-plots where cover crops were grown in 2016–2017. Soil texture was predominantly loam with an average of 35% sand, 39% silt and 26% clay. Average soil pH (1:1 H2O), SOM (LOI method using a 360°C furnace) and Mehlich 3 extractable nutrients were 6.7, 1.8%, 28.3 ppm P, 125 ppm K, 106 ppm Mg and 1095 ppm Ca, respectively.
Experimental design
The 3-year maize–cereal rye–soybean–winter wheat–cover crop rotation was organized in a randomized complete block design with four replications. Each complete block contained three main plots within which the three cash crops were rotated. All main plots (24 m by 348 m) were split into 12 subplots (24 m by 29 m) within which the 12 cover crop treatments were randomized. The 12 cover crop treatments included a fallow subplot, six cover crop monocultures and five cover crop mixtures. This paper only focuses on three cover crop monocultures (triticale, canola and crimson clover), a 5 species (5 spp.) mix, and the fallow plot as a control reference.
Cover crops were established during the third week of August after winter wheat was harvested and straw was baled. Before planting, wheat stubble was incorporated using a chisel plow with twisted shanks, followed by disk, s-tine and cultimulch operations to prepare the seed bed. Cover crops were planted in rows spaced 19 cm (7.5 in) apart with a no-till drill fitted with a cone and belt seed distributor. Cover crop seeding rates were based on regional expertise (Table 1) (Murrell et al., Reference Murrell, Schipanski, Finney, Hunter, Burgess, LaChance, Baraibar, White, Mortensen and Kaye2016). Since 2012, this field trial has been used to study the multifunctionality of cover crop monocultures and mixtures after winter wheat and proceeding maize (Murrell et al., Reference Murrell, Schipanski, Finney, Hunter, Burgess, LaChance, Baraibar, White, Mortensen and Kaye2016).
Table 1. Cover crop treatments used for root research

Latin name, plant family, common name and cultivar name are listed for each cover crop used. Seeding rate is expressed as the number of viable seeds that were drilled per m2 and the amount of seed planted per hectare.
Root trait research was conducted on crimson clover (Trifolium incarnatum L. cv. ‘Dixie’), triticale (X Triticosecale Wittmack cv. ‘Trical 815’) and canola (Brassica napus L. cv. ‘Wichita’) monocultures and a 5 spp. mixture that contained crimson clover, triticale and canola as dominant species in the 2016–2017 winter annual cropping window (Table 1). Cover crops were planted on August 24th, 2016, and terminated on May 4th, 2017. The 2016–2017 winter annual cover cropping window accumulated 2137 growing degree days (GDD°C) using a base temperature of 0°C.
Sample collection
Aboveground biomass and root cores were sampled from the field on November 14th, 2016 and on May 2nd, 2017. We sampled aboveground biomass from two 0.25 m2 quadrats in each cover crop subplot of interest. Due to the large degree of variance associated with root biomass measurements (van Noordwijk et al., Reference van Noordwijk, Brouwer, Meijboom, do Rosário G. Oliveira, Bengough, Smit, Bengough and Engels2000), we selected sampling quadrats that had negligible weed biomass and a healthy stand of cover crop biomass. In the 5 spp. mix, we additionally chose quadrats that had negligible amounts of red clover and Austrian winter pea biomass. Root core sampling occurred in these aboveground sampling quadrats in order to calculate root-to-shoot (R:S) ratios. These non-random biomass sample locations were selected to facilitate focused measurement on variation among quadrats dominated by the species of interest, rather than other types of field scale variations such as weeds or areas with uneven stands.
In each quadrat, we sampled a 10.3 cm diameter soil core using a Giddings tractor-mounted-hydraulic-soil-sampler from an in-row location and a between-row location (Fig. 1). A core diameter of 7 cm or greater was recommended to capture rooting variability (do Rosário G. Oliveira et al., Reference do Rosário G. Oliveira, van Noordwijk, Gaze, Brouwer, Bona, Mosca, Hairiah, Smit, Bengough and Engels2000). Therefore, two in-row cores and two between-row cores were sampled per treatment subplot. In the monocultures, in-row cores were placed above in-row locations that had regular plant cover. In the 5 spp. mixture, we chose in-row core locations that had canola, crimson clover and triticale inside the 10.3 cm core diameter. The largest canola plant was the central point of the sampling. There were no weeds, red clover, or Austrian winter pea above the root cores. Soil cores were split into three depths: 0–5, 5–20 and 20–40 cm in the field. The soil cores were stored at 4°C for a period of 1 to 3 months before they were processed.
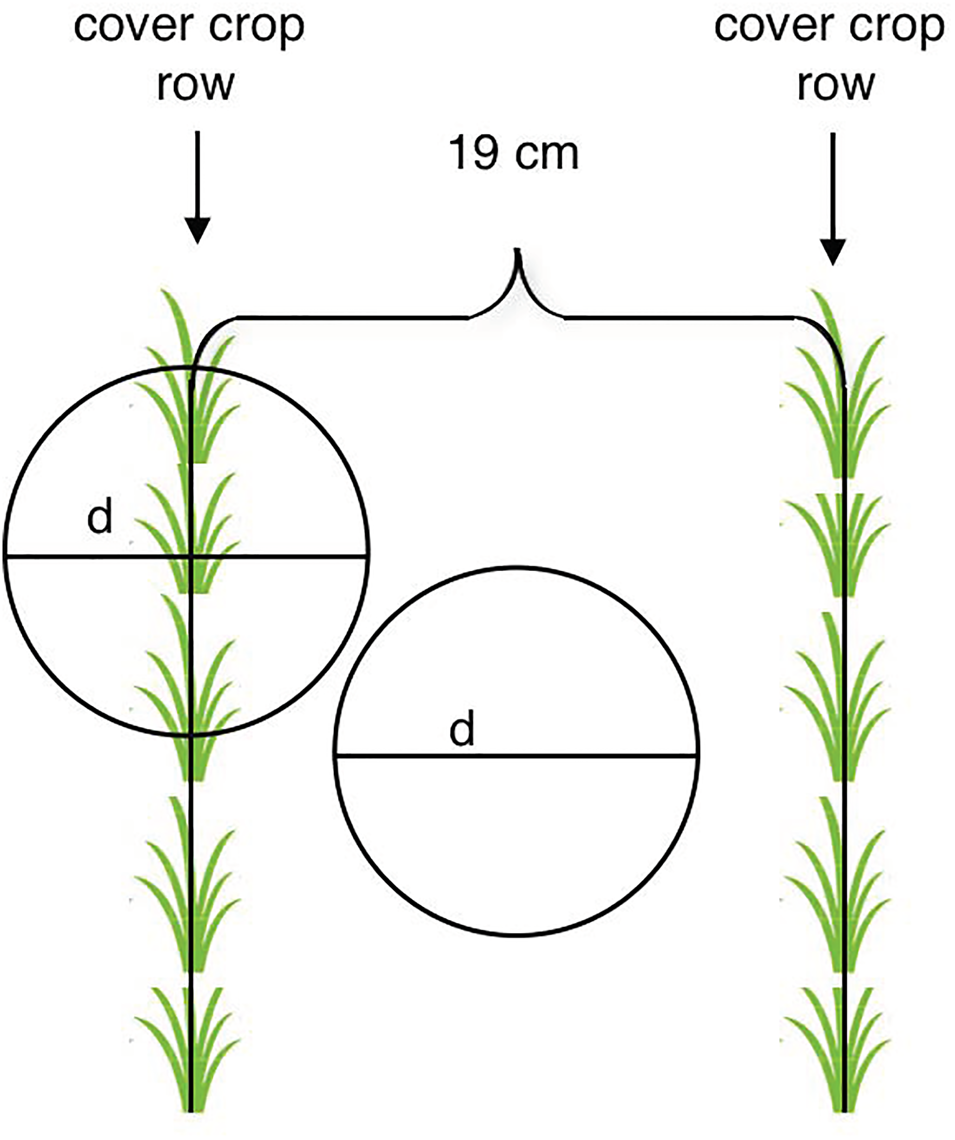
Fig. 1. Soil cores were taken from in-row and between-row locations. Cover crops were planted in rows spaced 19 cm apart. Core diameter, d = 10.3 cm.
In addition to the aboveground biomass that was sampled above root cores, aboveground biomass was sampled from three additional 0.25 m2 quadrats from each subplot that were randomly flagged immediately after cover crop seeding. These randomly sampled quadrats were used to measure aboveground biomass at the field scale. R:S ratios measured in the root quadrats were applied to field scale aboveground biomass values to determine field scale root inputs.
Root measurements
Root cores were stored at 4°C until roots could be washed. Each core soaked for 15 min to several hours in a tote with a Liquinox (ALCONOX, New York), a detergent, to assist with soil dispersion and the cores were gently broken up by hand as they were soaking. The entire contents of the tote (soil, Liquinox solution and roots) were poured through a 2–0.5 mm nested sieve set until all visible roots were captured on the sieves. Several studies have shown that washing roots above a 0.5 mm sieve can capture approximately 75–95% of the root biomass (Böhm, Reference Böhm1979; Amato and Pardo, Reference Amato and Pardo1994; Livesley et al., Reference Livesley, Stacey, Gregory and Buresh1999). To separate roots from other particles, the sieves were then placed in totes of clean water to pick roots out with tweezers. Roots were initially picked into a beaker full of water as roots were separated from particulate organic matter. Once roots were clean, they were transferred to a petri dish for root size class and root biomass measurements. Roots were not able to be separated by species in the 5 spp. mixture. Root biomass was separated into a coarse fraction, >2 mm in diameter, and a fine fraction, <2 mm in diameter using a caliper. Root samples were then dried at 60°C for ≥48 h and then weighed. These analyses resulted in oven dry root biomass for coarse roots (>2 mm), fine roots (<2 mm) and total roots. In-row and between-row root biomass were averaged together in order to calculate mean root biomass. Then mean root biomass values were scaled up to 0.25 m2 to calculate the R:S ratio using the aboveground biomass in the root quadrats. All results were converted to units of carbon by assuming that all biomass had 42% C. Carbon and nitrogen concentrations were only measured on roots from 5 to 20 cm.
Cumulative carbon input calculations
Cover crop root carbon inputs were calculated based on R:S ratios that were measured in root quadrats in fall 2016 and spring 2017. These R:S ratios were applied to 2 years of field scale aboveground biomass data, which included 2015–2016 and 2016–2017. Weeds were assumed to have an R:S of 0.3 to enable estimation of field scale root biomass production (Bonifas et al., Reference Bonifas, Walters, Cassman and Lindquist2005). Total cover crop carbon inputs were calculated by summing root and shoot C for both fall and spring. Winter annual cover crop carbon inputs after winter wheat were placed in the context of the full 3-year organic grain rotation. Harvest indexes (HIs) for soybean, winter wheat and maize were used to convert yield data into non-grain carbon inputs (Equation 1) (Bolinder et al., Reference Bolinder, Janzen, Gregorich, Angers and VandenBygaart2007):

HIs were chosen based on literature values and regional expertise for soybean, winter wheat and corn (Kemanian et al., Reference Kemanian, Stöckle and Huggins2007; Kemanian, Reference Kemanian2017). We assumed that all cash crops contained 0.42 g C g−1 based on our prior measurements at this field site. Finally, cash crops were assumed to have an R:S ratio of 0.33, which was added to the non-grain carbon input (Equation 1). Winter wheat straw was removed after grain removal and was therefore subtracted from the non-grain carbon input. Cereal rye aboveground biomass was sampled from three 0.25 m2 quadrats in four separate subplots. Cereal rye was assumed to have an R:S ratio of 0.5 based on spring results for triticale in this paper. Manure inputs before winter wheat and corn were each approximately 3.8 Mg C ha−1. Cover crop, cash crop and manure inputs were all averaged over two entries of the rotation. Although the assumptions required for our full-rotation carbon budget leave much room for improved accuracy, they allow us to assess the relative importance of cover crops (and cover crop species) in comparison to other key C inputs during the rotation.
Statistical analyses
Mixed analysis of variance models with cover crop treatment as a fixed effect and block as a random effect were used to test differences in shoot carbon, root biomass carbon at different depth intervals, root biomass carbon in the between-row space, the percent of total root biomass carbon in the between-row space, the percent of total root biomass carbon that were coarse roots, total cover crop carbon inputs and non-grain corn carbon inputs. These models were run for fall and spring separately. Residuals met assumptions of normality and homogeneity. Multiple comparisons were made using a Tukey adjustment at α = 0.05 with the package Agricolae (De Mendiburu, Reference De Mendiburu2017). These mixed models were run using R (R Core Team, 2019). Two sample t-tests were conducted in R to compare composite root C:N ratios with shoot C:N ratios for each cover crop treatment and season combination. Repeated measure mixed model analyses were investigated for the above parameters, but the cover crop by season interactions were not significant. C:N ratios and R:S ratios were analyzed using a repeated measures mixed model with cover crop treatment and season as fixed effects and block as a random effect (Proc Mixed 9.4). Multiple comparisons were made using a Tukey–Kramer adjustment at α = 0.05.
Results
Root traits
In fall, root biomass C varied among cover crop treatments at 0–5 and 0–40 cm (Fig. 2 and Table S1). Triticale produced more fall root biomass C at 0–5 cm than the 5 spp. mix and crimson clover. Triticale also produced more fall root biomass C than crimson clover from 0–40 cm. In spring, root biomass C differed among species at all depths (Fig. 2 and Table S1). Triticale had more spring root biomass C at 5–20, 20–40 and 0–40 cm than all other cover crop treatments (Table S1). The 5 spp. mix, canola and triticale produced more root biomass C at 0–5 cm than crimson clover in both fall and spring (Table S1).
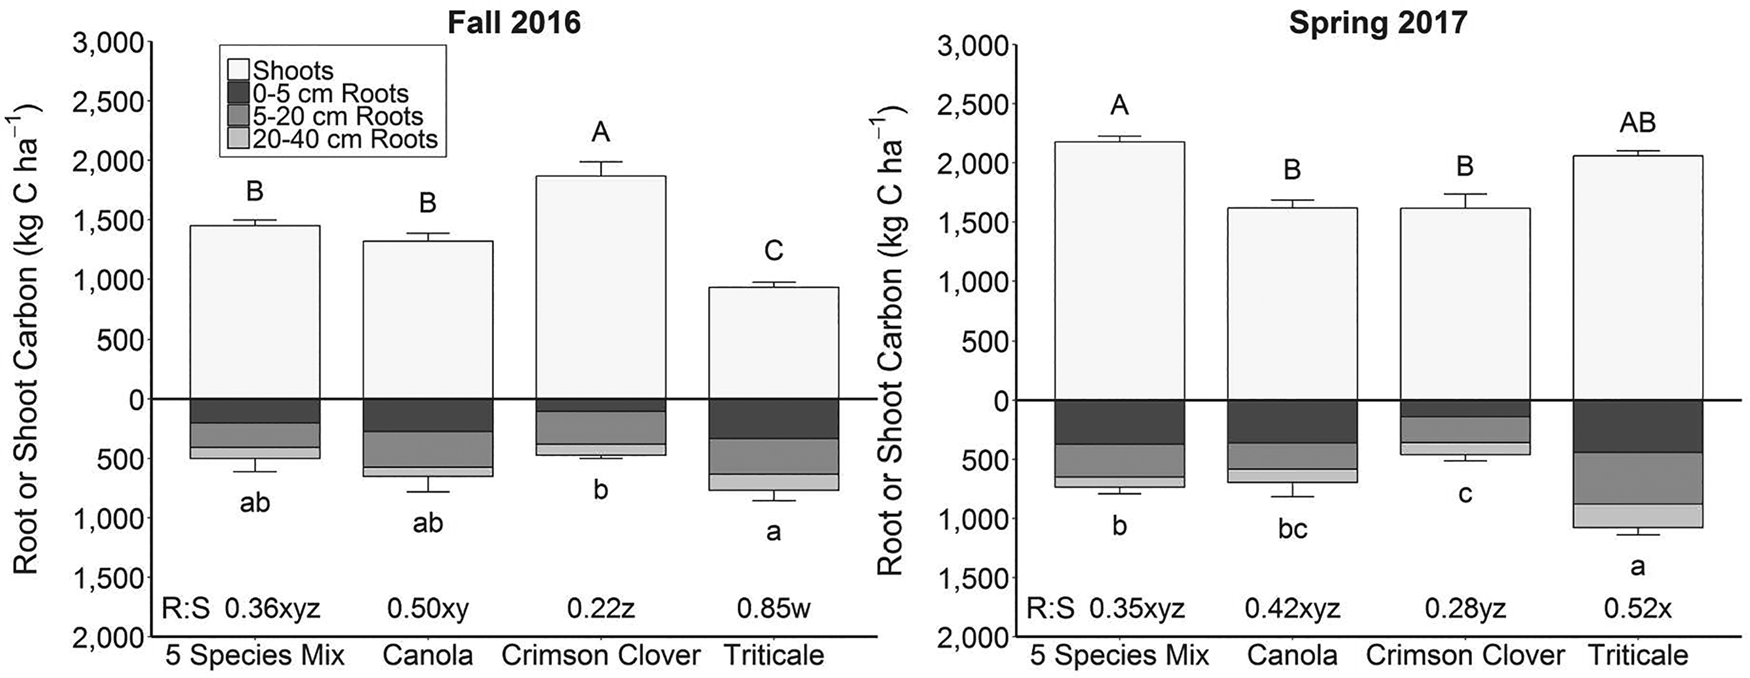
Fig. 2. Cover crop root and shoot carbon (C) in fall 2016 and spring 2017. Uppercase letters indicate significant differences in shoot C and lowercase letters indicate significant differences in 0–40 cm root C (P < 0.05). Root C results represent the average of in-row and between-row roots. Biomass comparisons were made for fall and spring separately. See Table S1 for differences between depth intervals. Error bars represent 1 standard error of the mean. Root-to-shoot (R:S) ratios are displayed at the bottom of the figure. Letters w–z represent significant differences in R:S ratio for the cover crop by season interaction (P < 0.05).
R:S ratios differed among cover crop treatments, with a significant cover crop by season interaction in the 2016–2017 winter annual cover cropping window (Fig. 2 and Table S2). Triticale had the highest R:S ratio in fall 2016. Whereas in spring 2017, triticale's R:S ratio declined, but was still greater than crimson clover's R:S ratio (Fig. 2).
Between-row root biomass C differed among cover crop treatments at all depths in both fall and spring (Fig. 3 and Table S3). Triticale produced more roots in the between-row space than other treatments (Fig. 3). Specifically, triticale had more between-row roots at each depth interval than other treatments, except for in fall 2016 at 20–40 cm, where triticale only had more between-row roots than canola (Table S3). The percentage of total root biomass in the between-row space also varied among cover crop species at 0–5, 5–20 and 0–40 cm in both fall and spring. Triticale roots were distributed more evenly across in-row and between-row space compared to the other treatments as indicated by the % of total root biomass found in the between-row space (Fig. S1). Crimson clover had a similar % of roots between rows as triticale at 5–20 cm in fall and 0–5 cm in spring. At 20–40 cm, % between-row root was statistically similar among treatments (Fig. S1).

Fig. 3. Between-row root carbon in fall 2016 and spring 2017. Letters indicate significant differences in 0–40 cm between-row root C for fall and spring separately (P < 0.05). Error bars represent 1 standard error of the mean. See Table S3 for differences between depth intervals.
C:N ratios differed among cover crop treatments, with a significant cover crop by season interaction. As expected, crimson clover roots had the lowest C:N ratio and triticale roots had the highest C:N ratio. The C:N ratios for triticale, canola and the 5 spp. mix's root C:N ratio increased during spring. For canola and the 5 spp. mix, the coarse roots were mostly responsible for the increase in their C:N ratio during the spring. Triticale and crimson clover root C:N ratios were larger than their shoot C:N ratios both fall and spring (Table 2). For canola, root C:N was only larger than its shoot C:N during spring (Table 2).
Table 2. Cover crop C:N ratios of root and shoot tissue in fall 2016 and spring 2017

Superscript letters indicate differences in <2 mm root, >2 mm root, composite root and shoot C:N ratios for cover crop by season interactions (P < 0.05). The composite root C:N ratios were calculated by multiplying the proportion of root biomass that was <2 and >2 mm by their root C:N and adding them together. There was no >2 mm roots for crimson clover and triticale.
Cumulative carbon inputs
Over the 3-year organic grain rotation, C inputs to soil ranged from 14.8 Mg C ha−1 (fallow) to 22.1 Mg C ha−1 (5 spp. mix). Soybean and winter wheat carbon inputs were the same across all cover crop treatments. The differences in treatments were due to total cover crop C inputs and the cover crops' influence on maize C inputs. When averaged across two entries, the 5 spp. mix produced the most C inputs followed by canola, triticale and crimson clover, with the fallow treatment producing the least C. The 5 spp. mix produced greater cover crop C than the other treatments in 2016–2017, but not 2015–2016 (Fig. S2). The 5 spp. mix produced greater corn C inputs compared to triticale (Table 3). Overall, the 5 spp. mix produced more total C inputs than other treatments (Fig. 4). Roots comprised a range from 2.0 Mg C ha−1 (fallow) to 4.1 Mg C ha−1 (5 spp. mix) of the 7.2 Mg C ha−1 (fallow) to 14.5 Mg C ha−1 (5 spp. mix) of non-manure carbon inputs that were returned to the soil.
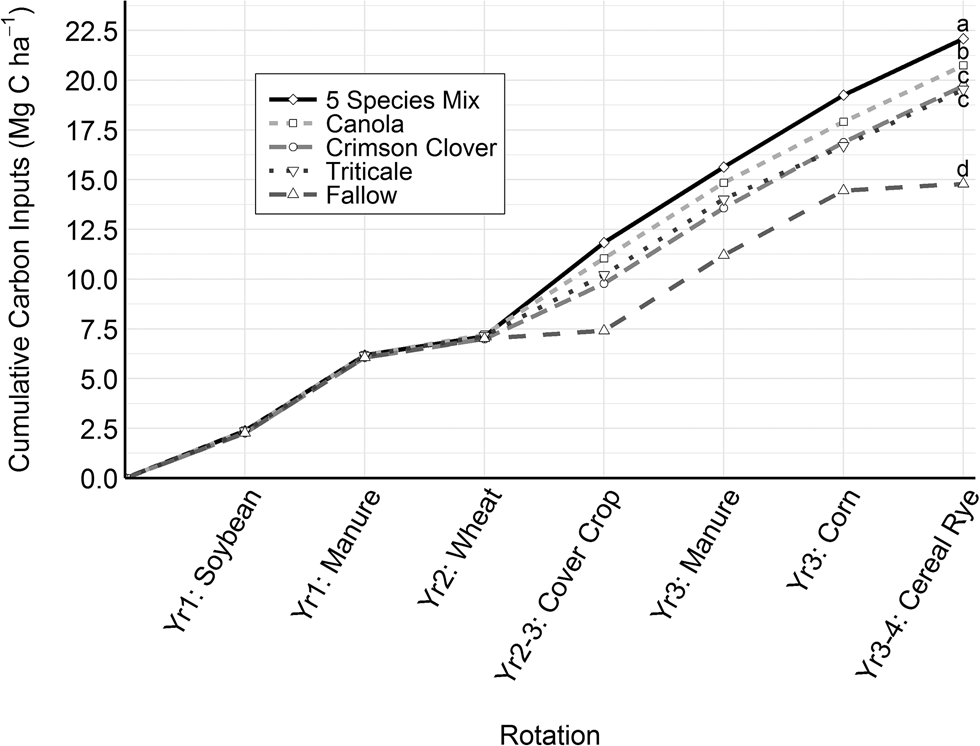
Fig. 4. Average cumulative carbon inputs for each cover crop treatment in 3-year organic soybean–winter wheat–corn grain rotation. Letters indicate significant differences in total carbon inputs at the end of a full rotation (P < 0.05).
Table 3. Summary of cash crop yield, HIs and cash crop or cover crop carbon inputs
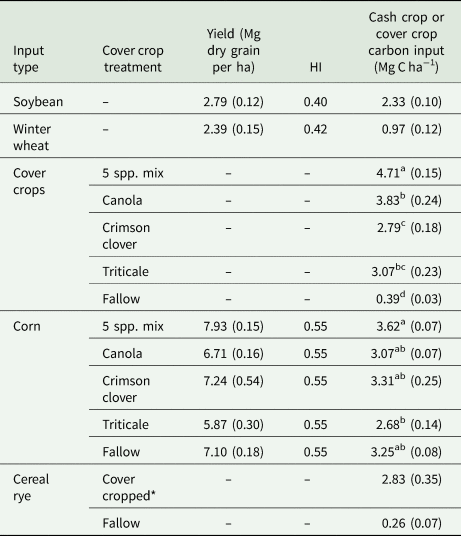
Superscript letters indicate significant differences in corn or cover crop carbon input among cover crop treatments (P < 0.05). Cover crop and corn carbon input were compared separately.
* 5 spp. mix, crimson clover, canola, and triticale plots all had cereal rye after corn grain.
Discussion
Root trait differences among cover crop species
Cover crop roots are known to play an essential role in building SOC, among other services, but there have only been a handful of papers published on cover crop root traits and even less that describe root traits of winter annual cover crops that were sampled in both fall and spring (Poeplau and Don, Reference Poeplau and Don2015; Kaye and Quemada, Reference Kaye and Quemada2017). Our root trait data from triticale, crimson clover and canola monocultures show important differences in root biomass distribution, R:S ratios and root C:N ratios, which we summarized qualitatively in Figure 5.
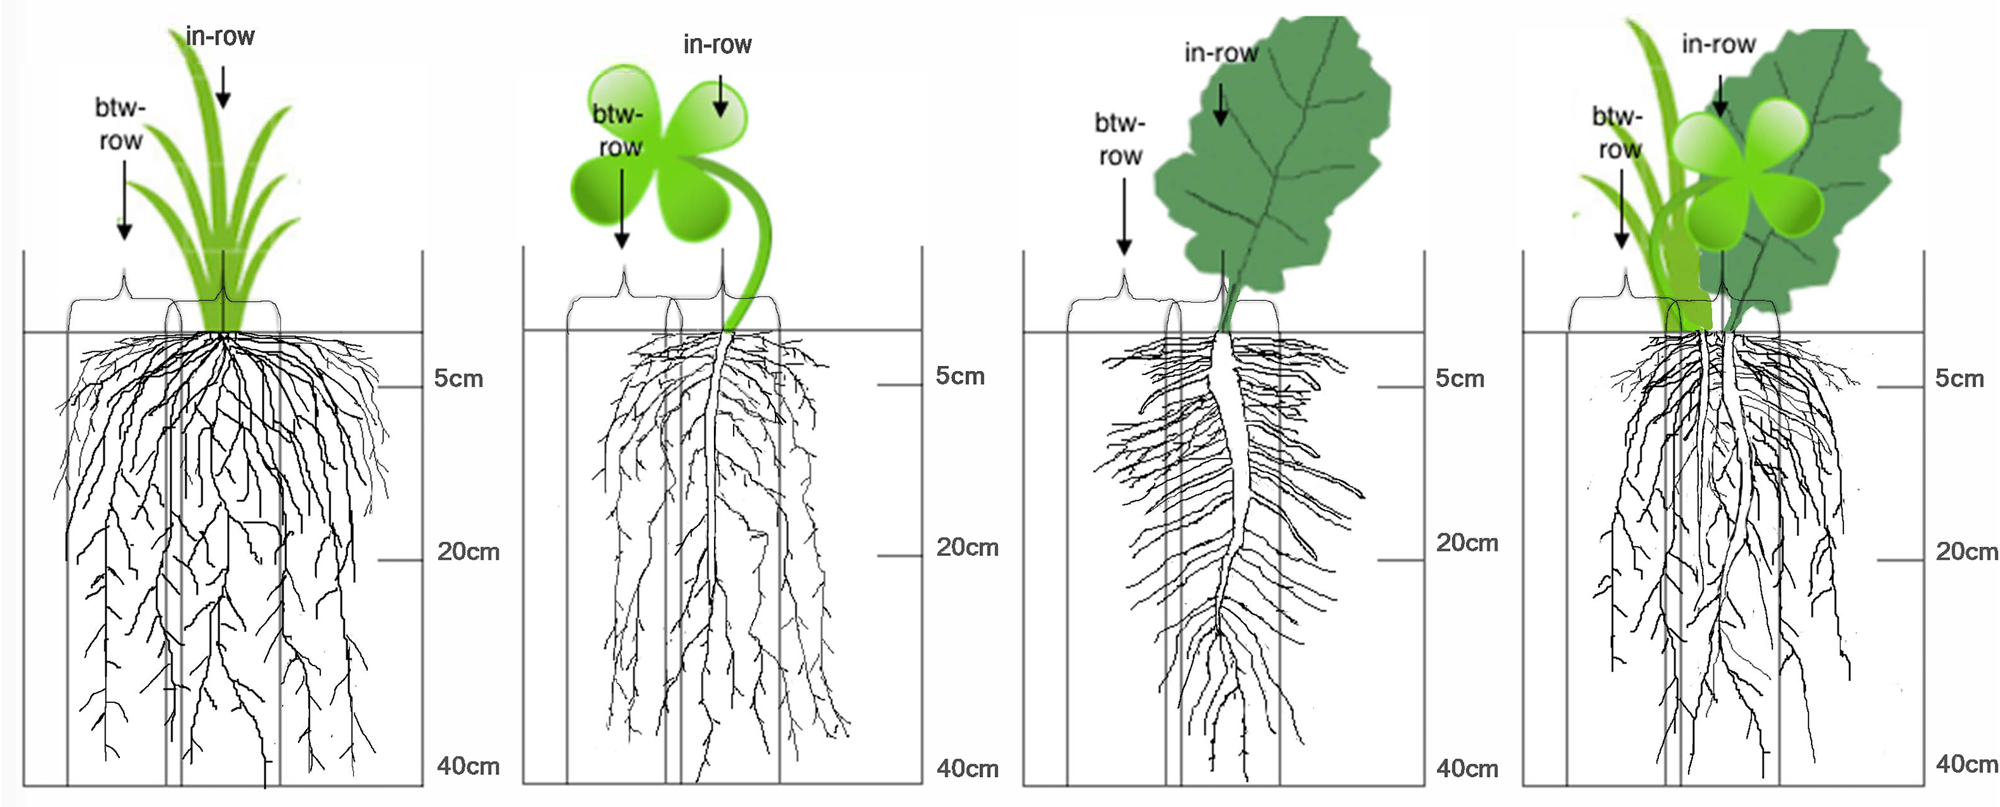
Fig. 5. Cover crop root distribution patterns of four cover crop treatments, including triticale, crimson clover, canola and a 5 spp. mixture. Treatments were sampled from in-row and between-row locations at three depth intervals: 0–5, 5–20 and 20–40 cm. The artwork aims to visually portray the root distribution results.
Triticale produced more root biomass than crimson clover in both fall and spring (Fig. 3). This agrees with literature findings that grass cover crops tend to produce more root biomass than common winter annual legume cover crops such as Austrian winter pea and crimson clover (Kuo et al., Reference Kuo, Sainju and Jellum1997; Hauggaard-Nielsen et al., Reference Hauggaard-Nielsen, Ambus and Jensen2001; Thorup-Kristensen, Reference Thorup-Kristensen2001; Maul and Drinkwater, Reference Maul and Drinkwater2010; Williams et al., Reference Williams, McCool, Reardon, Douglas, Albrecht and Rickman2013; Wendling et al., Reference Wendling, Büchi, Amossé, Sinaj, Walter and Charles2016; Amsili, Reference Amsili2018). Fewer previous studies include comparisons with brassica cover crops, but two studies found that Brassica rapa campestris and Brassica juncea produced more root biomass than the common legume cover crops listed above (Sangster et al., Reference Sangster, Knight, Farrell and Bedard-Haughn2010; Wendling et al., Reference Wendling, Büchi, Amossé, Sinaj, Walter and Charles2016). Hairy vetch appears to be an exception as this species has a larger R:S ratio than Austrian winter pea and crimson clover and in some studies hairy vetch produced root biomass equal to cereal rye (Sainju et al., Reference Sainju, Whitehead and Singh2005; Vasileva, Reference Vasileva2015; Frasier et al., Reference Frasier, Noellemeyer, Fernández and Quiroga2016). Austrian winter pea and crimson clover tend to have a smaller R:S ratio compared to grass species. Reduced root growth in legumes has been shown to be related to the high costs of nitrogen fixation compared to accessing soil nitrogen (Voisin et al., Reference Voisin, Salon, Munier-Jolain and Ney2002).
Triticale's impressive fall root production was greater than would be expected given its aboveground biomass production. The observation that grasses can have high root production despite low aboveground production should inform cover crop ecosystem service evaluation (Bodner et al., Reference Bodner, Himmelbauer, Loiskandl and Kaul2010). Triticale's R:S values in this study were greater than cereal cover crop species R:S ratios measured after corn silage in central New York (Ort et al., Reference Ort, Ketterings, Czymmek, Godwin, Swink and Gami2013). These results could potentially be explained by fall manure applications and a later planting date in the central New York study. The high R:S ratios observed in our field study are likely related to relatively lower nitrogen availability compared to fertilized cover crops and cash crops (Bolinder et al., Reference Bolinder, Janzen, Gregorich, Angers and VandenBygaart2007; Lynch et al., Reference Lynch, Marschner and Rengel2012). A high R:S of 0.85 should only be applied in scenarios of low aboveground biomass production. The variability in R:S ratios across species indicates the need to consider this variable when designing cover crop mixtures and potentially when breeding cover crop cultivars.
Higher between-row root production under triticale compared to other cover crop treatments was a novel result of this study. Although there are almost no comparisons of between-row root biomass for cover crop species in the literature, several studies on inter-cropped systems have shown that maize roots extended further in the between-row space than eudicot crops such as soybean, fava bean, cow pea and cabbage (Gao et al., Reference Gao, Duan, Qiu, Liu, Sun, Zhang and Wang2010). Triticale roots were more evenly distributed between the in-row and between-row spaces than canola, which placed the majority of its roots under the in-row space (Fig. 5). Higher between-row root biomass under certain grass cover crops may help to explain greater weed suppression compared to eudicot cover crops (Baraibar et al., Reference Baraibar, Hunter, Schipanski, Hamilton and Mortensen2017).
Carbon-to-nitrogen (C:N) ratios of cover crop roots in this study confirmed previous findings that root C:N is wider that shoot C:N (Sievers and Cook, Reference Sievers and Cook2018). An interesting result was that triticale root C:N was greater than canola root C:N in both fall and spring. Brassica root C:N is often presented for the whole root system, but in this study we measured root C:N for both coarse and fine root fractions. Therefore, we were able to demonstrate that the fine canola root C:N remains low between fall and spring, whereas the coarse root C:N ratio is responsible for the higher canola root C:N ratio in spring. Canola's fine roots have a low C:N ratio that likely cause a higher turnover rate compared to triticale roots (Roumet et al., Reference Roumet, Birouste, Picon-Cochard, Ghestem, Osman, Vrignon-Brenas, Cao and Stokes2016).
In this study, we found that crimson clover produced low root biomass, surface root biomass and between-row root biomass (Fig. 5). Canola had greater root biomass production than crimson clover, but fewer between-row roots compared to triticale. Although triticale produced the most roots in spring 2017, its high root and shoot C:N ratio contributed to depressed corn yields (Table 3). Although we focused on cover crop carbon inputs, this root trait research can inform mechanisms behind nutrient acquisition and weed suppression (Sainju et al., Reference Sainju, Singh and Whitehead1998; Kiaer et al., Reference Kiaer, Weisbach and Weiner2013; Wendling et al., Reference Wendling, Büchi, Amossé, Sinaj, Walter and Charles2016).
Can mixtures improve cover crop root traits?
Species root trait information can help us understand the potential benefits of planting cover crop mixtures. Cover crop mixtures may ameliorate weaknesses of individual cover crop species such as low root biomass production in crimson clover and high root C:N in triticale. Increasing the quantity, quality and distribution of cover crop roots may be an effective strategy to build SOC, without declines in cash crop yield. The 5 spp. mix produced greater total root biomass, surface roots and between-row roots compared to crimson clover (Fig. 5). Therefore, combining legumes and non-legumes may be a good way to increase root biomass production and distribution compared to legume monocultures. The mixture did not lead to greater root biomass distribution compared to canola. The benefits of including triticale in the mixture were not fully realized since triticale only made up a small proportion of the mixture compared to crimson clover and canola (Table S4). Therefore, more work measuring root traits of grass–eudicot mixtures compared to component monocultures is required to further test whether grasses can increase between-row roots in mixtures. Furthermore, more work is required to assess whether a canola–grass–legume mixture can improve root traits compared to a grass–legume biculture. Including crimson clover in the 5 spp. mix resulted in lower root C:N ratios compared to triticale. The 5 spp. mix produced greater corn yields than triticale due to its higher quality (lower C:N) root and shoot inputs.
How do root inputs fit into cumulative carbon inputs?
Roots increased estimates of total carbon inputs in the 3-year organic grain rotation by between 37% (crimson clover) and 46% (triticale). Root inputs were especially useful when cover crop R:S ratios were markedly different. For example, despite similar aboveground production, triticale had a greater R:S ratio than crimson clover, which helped to push it closer to canola's total carbon input. Cover crop decisions not only affect the amount of cover crop C returned to the soil, but can also influence C inputs from the following cash crop. Cover crop influence on cash crop C inputs depended on the cash crop having a limited supply of nitrogen, which can commonly occur in organic systems.
One weakness of destructively sampling root biomass is that one cannot quantify root turnover. As a result, we calculated total cover crop carbon inputs by adding standing stocks in fall with standing stocks in spring. This may have led to an overestimation of C inputs from certain cover crop species' roots compared to others. The 5 spp. mix, canola, and crimson clover's fine roots had a much lower C:N ratios than triticale's roots, which would have made them more susceptible to root turnover. One indication of this was that in spring 2017, canola and crimson clover had less roots at 5–20 cm than in fall 2016. Winter temperatures likely contributed to root death and root turnover in spring. In order to estimate root turnover, we assessed changes in total aboveground shoot carbon, which included living biomass and dead residues, at two sampling times between November and May (Table S5). We found that canola lost 40% of its shoot carbon between November and February. However, the 5 spp. mix and crimson clover lost 16 and 42% of its shoot carbon respectively between February and April. Although there may have been some decomposition of triticale residues, triticale maintained steady growth between all sampling dates (Fig. S3). If these losses were the same belowground, cover crops could have had lost 0.20 Mg C ha−1 (crimson clover) and 0.26 Mg C ha−1 (canola). A study by Fisher et al. (Reference Fisher, Eissenstat and Lynch2002) found that common bean experienced 50% root turnover by the time the pods had filled. Therefore, it is possible that root turnover was even higher than estimated by aboveground dieback and decomposition.
Rhizodeposition C, the flux of organic carbon released from roots during plant growth, which includes exudates, lysates, secretions, root border and root cap cells, sloughed root cells, inputs from mycorrhizal fungi and root turnover, remains poorly characterized (Kuzyakov and Schneckenberger, Reference Kuzyakov and Schneckenberger2004; Bolinder et al., Reference Bolinder, Janzen, Gregorich, Angers and VandenBygaart2007; Wichern et al., Reference Wichern, Eberhardt, Mayer, Joergensen and Müller2008). Bolinder et al. (Reference Bolinder, Janzen, Gregorich, Angers and VandenBygaart2007) suggested multiplying root biomass by a factor of 1.65 to account for rhizodeposition C inputs. If rhizodeposition C was added to root carbon inputs it would increase root carbon input by 1.3 Mg C ha−1 (fallow) to 2.7 Mg C ha−1 (5 spp. mix). Although applying a single factor for rhizodeposition is appealing, several studies have shown that root biomass does not reflect soluble carbon input (Adkins et al., Reference Adkins, Jastrow, Morris, Six and de Graaff2016; Stewart et al., Reference Stewart, Roosendaal, Denef, Pruessner, Comas, Sarath, Jin, Schmer and Soundararajan2017). These studies pointed out that when comparing similar grass cultivars that root length was a better predictor for understanding rhizodeposition C and stabilization of SOC. Therefore, the relationships between root traits and rhizodeposition C inputs remain an important research gap.
Total carbon input results indicate that the 5 spp. mix should be more likely to lead to increases in SOC compared to other cover crop treatments. Although transgressive overyielding, the phenomenon where a mixture produces more biomass than the most productive species in the mixture grown as a monoculture, occurred in 2016–2017, it was likely because cereal rye was replaced with triticale after the first 3 years of the experiment (Finney et al., Reference Finney, White and Kaye2016). Due to field site variability, we were not able to detect changes in % SOM after the 3-year crop rotation (Fig. S4). Although our preliminary C budget leaves many facets poorly constrained, our data clearly demonstrate that variation in cover crop root traits can significantly impact total C inputs across a rotation, and that the cover crop species effects are due to both direct inputs and impacts on subsequent cash crop growth.
Conclusions
Increased knowledge of cover crop root traits can improve our understanding of the linkages between root traits and the services cover crops provide. Our study highlighted root trait differences among three important winter annual cover crops: canola, crimson clover and triticale. Several important root traits were uncovered including the high fall R:S ratio and large production of between-row roots for triticale. The 5 spp. mix was associated with increased quantity and distribution of roots compared to a crimson clover monoculture, which highlights the benefits of combining legumes that have limited root biomass with brassica and grass species that produce greater root biomass, but have a higher C:N ratio. Although our study highlighted several important root trait differences among these cover crop treatments, it is crucial to acknowledge a potential shortcoming that this study reflected only 1 year (fall 2016 and spring 2017) of root measurements at one site. This is a major limitation of any root study due to the high labor costs associated with measuring roots. As a result, most root studies are conducted in the greenhouse or during one season in the field.
Advancing research on cover crop root traits will serve as a strong foundation for intentionally designing mixtures with complementary root traits. Furthermore, measuring roots improved estimates of cover crop carbon inputs. The history of cover crop choices had a significant impact on rotation C inputs to the soil due to both cover crop inputs and the impact of cover crops on productivity of the following corn crop.
Supplementary material
The supplementary material for this article can be found at https://doi.org/10.1017/S1742170520000216.
Acknowledgements
This study was funded by the USDA National Institute of Food and Agriculture, Organic Research and Extension Initiative under Project PENW-2015-07433, Grant No. 2015-51300-24156 and Accession No. 1007156. We want to thank Brosi Bradley, Nancy Bao, Elise Elizondo, Rachael Nicolescu, Bridget Burgos, Mark Younkins and Sydney Seidenberger for their help washing roots. Additionally, we thank Joseph Amsili's committee members Armen Kemanian, Charles White and Jonathan Lynch (Penn State) for their input.


