Introduction
The American Clean Energy and Security Act, which was passed in the US House of Representatives in 2009, but failed to pass the US Senate, proposed the establishment of a cap-and-trade system to regulate greenhouse gas (GHG) emissions in the USA. The Act portended significant changes for agriculture in the USA, and research on the relationship between agriculture and GHG emissions has increased in the past year. The primary agricultural GHGs include carbon dioxide (CO2), nitrous oxide (N2O) and methane (CH4). Although industry, transportation and energy sectors were the greatest source of GHG emissions in 2007, agricultural soil-management activities, including fertilizer applications, were responsible for 67% of US N2O emissions1. While agriculture is considered an uncapped sector with respect to regulation of GHG emissions, as established in Title V Section 501 (b) in the House bill, in Title V Section 502 (a), the bill proposes that ‘…the Secretary shall establish a program governing the generation of offset credits from domestic agricultural and forestry resources.’ Thus, farmers who reduce their emissions potentially could derive a profit by selling their emission credits.
A cap on the energy sector will most likely increase agricultural input prices, such as electricity, fuel and domestically produced fertilizers and pesticidesReference Babcock2. This will be particularly important for conventional agricultural producers who rely on petroleum-based inputs. Organic agriculture, on the other hand, avoids the use of synthetic fertilizers and pesticides, and relies on the use of manure, legumes and other natural sources of nitrogen (N)Reference Ziesemer3, thus eliminating synthetic N use and possibly reducing N2O emissionsReference Kotschi and Müller-Sämann4. Organic agriculture also has a lower energy requirementReference Mäder, Fliessbach, Dubois, Gunst, Fried and Niggli5–Reference LaSalle and Hepperly7. Moreover, there is an indication that the benefit of lower energy use in organic agriculture is accompanied by greater carbon (C) sequestration rates than in conventional agriculture8. Thus, organic producers may be better positioned to sequester C and reap the benefits of the C-offset scheme than conventional producers. Greene et al.Reference Greene, Dimitri, Lin, McBride, Oberholtzer and Smith9 point out that the mitigation of environmental externalities with organic production systems could improve the environmental performance of US agriculture if the adoption rate of organic practices were higher. In this study, we analyzed the potential for GHG offsets, particularly from reduction in CO2 and N2O emissions, of organic and conventional soybean producers in the USA using on-farm survey data obtained through the USDA-National Agricultural Statistics Service (NASS) Agricultural Resource Management Survey (ARMS) in 2006. More specifically, we determined the economic value to individual soybean farmers from the environmental benefits associated with their production practices in a potential C-offset market.
GHG mitigation in agriculture
As defined by LalReference Lal10, ‘soil C sequestration’ is plant removal via photosynthesis of the GHG, CO2, with subsequent storage of fixed C as soil organic matter. Both organic and conventional cropping systems have the potential to induce C sequestration, but each system has different energy requirements, cost structures and relative intensities of their sources of GHG emissions. Consequently, each of these components affects farmers’ profit functions in a different manner. Research analyzing the differential profit between organic and conventional farming systems based on potential for C sequestration, GHG mitigation and economic value in a C-based market has been limited. Information regarding the performance of organic and conventional farming practices based on varying management regimes, however, has increased in recent years.
Tillage effects
The main component of agricultural soil-management activities is tillage. Tillage practices can be classified according to the percentage of residue cover remaining on the soil after planting. Conventional-till (CT) leaves less than 15% of residue cover on the soil after planting due to its reliance on the use of intensive tillage equipmentReference Sandretto and Payne11. Reduced-tillage refers to the case where 15–30% residue cover remains after tillage in order to reduce water or wind soil erosionReference Lal12; mulch-till, ridge-till and no-till (NT) leave 30% or more residue coverage and are referred to as conservation tillage practices. CT involves plowing or disking the soil to prepare for planting and also includes cultivation for weed management. CT has been criticized for depleting soil CReference Baker, Ochsner, Venterea and Griffis13, while reduced tillage has been proposed as a method to restore soil organic carbon (SOC), reduce the amount of C released into the atmosphere and maintain a higher level of C storage. The United Nations Environmental Program (UNEP) and the World Meteorological Organization (WMO) Intergovernmental Panel on Climate Change (IPCC) guidelines14 identify tillage as one of the main management practices that affect soil C stocks in croplands. Furthermore, tillage practices also influence, among others, chemical pesticide and fertilizer use. West and MarlandReference West and Marland15 (p. 439–440) suggested that ‘optimizing agricultural management through efficient use of fertilizers, irrigation and tillage operations can often enhance C sequestration while simultaneously reducing the C emissions associated with agricultural inputs such as fertilizers and on-farm fuels.’ Reduced tillage systems, on the other hand, may be subject to herbicide resistance, based on reliance on herbicides and genetically modified seeds to manage weeds. Some authors also disagree with the argument that tillage practices can alter C emissions from soils and contribute to GHG emission reduction. For example, NT might reduce direct energy consumption, but would increase indirect energy consumption through an increased use of inputs/herbicides compared to CTReference Ziesemer3. Moreover, LalReference Lal10 discussed the importance of identifying those ‘hidden’ C costs related to the production of nitrogenous fertilizers and pesticides when evaluating a practice's potential for SOC sequestration. Organic agriculture relies on the use of tillage because, by definition, it precludes the use of herbicides. Research has shown that despite relying on intensive and frequent cultivation, organic systems can store more soil C than conventional systemsReference Marriott and Wander16. Thus, determining which combination of farming and tillage practices is best for sequestering SOC and GHG mitigation has been the subject of much discussion. West and MarlandReference West and Marland15 stated that conversion from CT to NT in soybean production would result in a net removal differential of −371 kg C ha−1 yr−1. Along the same lines, West and PostReference West and Post17 proposed using a factor of 16% increase in C sequestration when switching from CT to NT. Robertson et al.Reference Robertson, Paul and Harwood18 found that C storage was three times greater in an NT system than an experimental organic system. It should be noted, however, that their results were based on samples taken only from the top 7.5 cm of soil and their organic system was not as diversified as is required for certified organic production. Other research corroborated NT C sequestration benefits primarily in the upper soil layer, while plow tillage (PT) systems sequestered equivalent C when the entire soil profile was examinedReference Blanco-Canqui and Lal19, Reference Poirier, Angers, Rochette, Chantigny and Ziadi20. When specifically evaluating NT against organic agriculture systems, Teasdale et al.Reference Teasdale, Coffman and Mangum21 found greater soil C and N concentrations at all depth intervals up to 30 cm in an organic system than in NT at the end of 9 years. In a follow-up trial, the authors found that corn grain yield was 18% greater under organic than NT. Results from a 10-year-old long-term experiment in Iowa demonstrated that a four-crop rotational organic system could sequester 0.53 Mg C ha−1 yr−1 in the top 15 cmReference Cambardella and Delate22, similar to converting from PT to NTReference West and Post17.
N and liming impacts
Although N2O is produced naturally in soils through nitrification and denitrification processes, fertilizer applications can increase the quantity of N in the soil, fostering further nitrification and denitrification, and, in turn, increasing N2O emissions1. According to IPCC Guidelines for National Greenhouse Gas Inventories23, both synthetic N fertilizers and organic amendments (e.g., manure) contribute to GHGs. Reducing N applications through monitoring tools, such as the pre-side-dress N testReference Shoemaker, McGranahan and McBride24, can help ameliorate GHG emissions. Lime applications to adjust soil pH and improve plant growth also can affect GHG emissions. As indicated in IPCC guidelines14, liming can lead to CO2 emissions as the lime dissolves. Few references are available comparing organic and conventional systems in relation to liming practices, as both groups apply lime according to site-specific soil conditions.
Energy use in organic versus conventional systems
Calculations for energy use in agriculture should incorporate not only direct energy consumption but also indirect energy consumption derived mainly from synthetic inputs such as fertilizers and pesticidesReference Hill25, Reference Stolze, Piorr, Häring and Dabbert26. Pesticide manufacturing, based on crude petroleum and natural gas productsReference West and Marland27, requires up to five times greater energy per kilogram than N fertilizerReference Helsel28. Energy inefficiency of conventional agriculture, relative to organic practices, is driven by manufacturing and distributing synthetic pesticides and fertilizersReference Ziesemer3, which accounts for 70–90% of the costs of productionReference Shoemaker, McGranahan and McBride24. PimentelReference Pimentel6 found that organically grown corn and soybeans use 31 and 17% less fossil-energy inputs, respectively, compared to conventional corn and soybeans. Mäder et al.Reference Mäder, Fliessbach, Dubois, Gunst, Fried and Niggli5 found that organic systems required 34–53% less energy than conventional counterparts. Research in the UK29 found that organic crops require 50% less energy input per unit of area than conventional crops, as a result of avoiding synthetic fertilizers and pesticides.
C-sequestration evaluation
Atmospheric CO2 sequestration through agricultural soil management has been suggested as a way to mitigate GHG emissionsReference Ziesemer3, Reference Lal10, Reference West and Marland27, Reference Lewandrowski, Peters, Jones, House, Sperow, Eve and Paustian30, Reference Tawil31. The IPCC recommended that analyses of GHG mitigation be performed using CO2 equivalent emissions (CO2 eq. or CO2e) in order to allow comparisons of all gas emissions. All non-CO2 gasses, such as N2O, are converted into CO2 eq. using their global warming potentials (GWP), which are calculated over a 100-year period23, with CO2 assigned a value of 1, CH4 a value of 25 and N2O a value of 298 CO2 eq. Despite the wide use of the IPCC's Emission Factor Database (EFDB), these models do not include specific values for organic farming; thus, as an estimate, conventional farming values are employedReference Müller-Lindenlauf32.
Organic systems have been reported to sequester more C than conventional systemsReference Cambardella and Delate22. The UK Soil Association33 reviewed studies from 39 sites around the world and found, in 32 of these sites, soil C levels were 8–325% greater in organic systems. Pimentel et al.Reference Pimentel, Hepperly, Hanson, Douds and Seidel34 reported an annual soil C increase of 981, 574 and 293 kg C ha−1 yr−1 in 22-year-old experimental organic animal-based, organic legume-based and conventional systems, respectively. Niggli et al.Reference Niggli, Fliessbach, Hepperly and Scialabba35 estimated a potential sequestration rate of 500 kg C ha−1 yr−1, while Marriott and WanderReference Marriott and Wander16 reported that organic farming increased SOC concentrations by 14% relative to conventional agriculture. Similarly, Liebig and DoranReference Liebig and Doran36 found that there was 22% greater SOC in the surface 30.5 cm on organic farms than on conventional farms.
C sequestration versus reduction in emissions
As discussed by Lewandrowski et al.Reference Lewandrowski, Peters, Jones, House, Sperow, Eve and Paustian30, a controversial issue that may arise in the regulation of the proposed C-trading market is the idea that C-emission reduction and C sequestration are not equivalent, attributing a more permanent nature to GHG mitigation benefits. This concept is based on the fact that while emissions can be reduced in one case (often only to be re-introduced through polluting practices at a later period), C storage can be completely reversed after plowing or tillage, releasing sequestered C into the atmosphere. Potential solutions to the problem of emission reduction versus C sequestration include using trading ratios by which the credits given for C sequestration are less than what is being sequestered, or requiring a 20-year contract for sequestration activities.
Based on the analysis of USDA-NASS ARMS data of organic and conventional soybean production in 12 US soybean-producing states collected in 2006, we hypothesized that organic soybean producers would be better positioned than conventional producers to take advantage of ‘green payments’ from C-offset programs, assuming that the policy adopted to address non-permanence concerns would include C reductions and C sequestration as equivalent metrics. In order to analyze potential changes in the profitability of organic and conventional soybean production based on organic price premiums and the sale of emission credits, we evaluated profits of representative farmers under different scenarios, typical of Midwestern US conditions.
Materials and Methods
The USDA-NASS ARMS on soybean production
Permission to utilize the USDA-NASS ARMS dataset was obtained through a memorandum of understanding with USDA-Economic Research Service (ERS). All data were coded by USDA and remained confidential throughout the analysis. The ARMS data included information about a producer's expenses, costs and production practices from 237 organic soybean producers and 1425 conventional producers in Illinois, Indiana, Iowa, Kansas, Michigan, Minnesota, Missouri, Nebraska, North Dakota, Ohio, South Dakota and Wisconsin. Data collected in the ARMS survey corresponded to one randomly selected field of each of the producers in the sample; data were expanded to the farm level by taking into account the number of acres on the selected farm. As McBride and GreeneReference McBride and Greene37 determined, through the use of farm survey weights that are proportional to their probability of selection, the ARMS sample was expanded to represent soybean acreage in each state, and in this particular dataset, such weights were also useful to ensure that surveyed organic producers represented the correct proportion of the population, even though their share on this sample was purposely over represented. The number of acres that the weighted sample of the ARMS survey represented was 63,846,000, accounting for 85% of the 75,522,000 total US soybean acres in 200638. The ARMS data included a sub-sample of organic producers that were identified through USDA-accredited state and private organic-certifying agencies. According to ERS data, the number of acres planted to organic soybean production in 2006 was 114,581; the weighted data in the ARMS survey accounted for 82,661 acres or approximately 72% of 2006 US organic soybean acreage39.
Scenario evaluation
In our evaluation of profits of surveyed farmers under different scenarios, the first scenario represented the profit attained by a conventional producer who does not alter production practices despite incentives that the Clean Energy Bill would propose to reduce emissions and sequester C. The second scenario took into account a producer's decision of using NT to make a profit from selling emission credits, since conventional producers practicing NT would be reducing their direct energy-related costs (and emissions) and availing themselves of the bill's incentives. The third scenario considered the case of a farmer who produces soybeans using organic practices. This latter scenario took into account the differential profit from selling emission credits and also the organic price premiums that a producer would obtain in the market. The equation that nested all the above-described scenarios is
where P soy is the organic or conventional market price of a bushel of soybeans, Y soy is the farmer's soybean yield in bushels per acre; C soy is the per acre cost associated with the production method chosen and based on the ARMS soybean data. The last two terms represent the price and quantity (on a per-acre basis) of permits a farmer would be able to sell depending on practices chosen. An important aspect of the analysis of a representative producers’ profit function is that the adoption of each practice might imply not only different input uses or C-sequestration rates but also different levels of output and sale price. This implies that while profit in Equation 1 could be higher due to lower energy use or higher C-sequestration rates using a specific agricultural practice, that practice could also convey lower yields, causing a simultaneous profit reduction. Thus, we calculated the profitability of a representative producer's choice taking into account all effects that the adoption of each alternative endorsed.
Estimations for terms
We estimated the first two terms of Equation 1 using ARMS data. To estimate the two components of the last term of that equation, we used current relevant literature.
Prices, yields and costs
We estimated the costs of organic and conventional soybean production following McBride and Greene'sReference McBride and Greene37 dividing of costs into operating costs, operating and capital costs, and total economic costs. However, we computed costs taking into account producers’ tillage practices. In this way, we are able to analyze difference in costs producers may have had even within the same method of production, and, thus computed Equation 1 in a more precise manner. As an example, we compared fertilizer cost differentials between conventional producers using CT and those using NT. However, because surveyed producers were not asked to indicate their tillage practices directly, classification according to tillage practices was an estimate, based on previous planted crop and machinery used.
GHG emissions
To estimate N2O emissions generated by US soybean producers from the use of N fertilizers, we used the procedure and equations defined as Tier 1 in Chapter 11 of Volume 4 of the IPCC guidelines14. As explained by EPA1 (p. 6–24): ‘the Tier 1 approach is based on multiplying activity data on different N inputs […] by the appropriate default IPCC emission factors to estimate N2O emissions on an input-by-input basis’. We used N application estimates to compute emissions derived from soil management activities and emission allowances corresponding to each of the different tillage practices reported. For that calculation, we followed equation (11.1) from IPCC14 and used the default emission factor of 1% to estimate direct N2O emissions from managed soils; we then transformed the N2O–N emissions into N2O and further converted them into CO2 eq. using their GWP. Following the EPA's glossary, we used ‘CO2eq.’ for GWP-weighted emissions (http://www.epa.gov/climatechange/glossary.html#C).
As indicated in Volume 4, Chapter 11 of IPCC guidelines14, adding lime leads to CO2 emission as the lime dissolves, and emissions from liming were given an emission factor of 0.12 or 0.13 depending on whether limestone or dolomite was used.
C-sequestration estimates
Because ARMS data were limited to a single year and did not include information regarding soil C stock in each field, we estimated C-sequestration rates available from current scientific literature. As Lal et al.Reference Lal, Kimble, Follet and Cole40 indicated, adopting conservation tillage simultaneously increases C sequestration and decreases GHG emissions. No specific data were available on CO2 eq. reduction from organic systems, so conventional rates were used. According to the US EPA41, conversion from conventional to reduced tillage could sequester 0.73 t CO2 eq. acre−1 yr−1, a value within the range of 0.64 and 1.05 t CO2 eq. acre−1 yr−1, cited by the Congressional Budget Office42.
Results and Discussion
Conventional and organic soybean costs of production, yields and sale price
Conventional soybean production from the ARMS weighted sample was 28,544,000 acres of NT, 380,000 acres of ridge-till, 19,136,000 acres of mulch-till, 9,652,000 acres of reduced-till and 6,051,000 acres of CT. Organic soybean production included 4000 acres of reduced-till and 79,000 acres of CT. The organic ridge-till sample had only five observations and was removed from the descriptive and comparative analysis. According to survey data, there were significant differences in operating costs between organic and conventional farming (Table 1), and between different tillage practices in conventional farming, as evidenced by differences in chemicals, fuel, lubrication, electricity, repairs and hired labor costs. As one would expect, NT farms had the highest costs for chemicals, and those costs decreased as tillage intensity increased. Fuel, lubrication and electricity costs were greatest for organic producers who used CT. Thus, conventional NT farmers reported the lowest fuel, lubrication and electricity costs, confirming a degree of substitution between costs for chemicals and tillage operations. Repairs had a similar pattern. A greater use of chemicals also reduced costs for hired labor and opportunity cost of labor. Thus, the data corresponded with the assertion by Pautsch et al.Reference Pautsch, Kurkalova, Babcock and Kling43 that higher fuel, labor and machinery costs accrued for CT than conservation tillage practices. Nevertheless, soybean is among the crops with the lowest energy-input costs as a share of total operating costs, accounting for approximately 22% of total operating costs in 2004Reference Shoemaker, McGranahan and McBride24. In 2006, fertilizer, fuel, lubrication and electricity accounted for 27% of total operating costsReference McBride and Greene37.
Table 1. Profitability and production costs of organic and conventional soybean producers by tillage practices.

1 This category includes 18 producers who used reduced-till and two producers who used mulch-till. To avoid compromising confidential information, they are grouped together under this category in all tables.
NT had the lowest total economic costs. Organic producers who used CT had the highest total economic cost (without considering ridge-till). Organic producers who used reduced-till and not chemical herbicides reported significantly lower labor costs than organic farmers using CT. Moreover, the former group had labor costs that were lower than conventional producers who used CT. Furthermore, organic producers using reduced-till had the lowest operating costs; however, it also evident that they were compromising yields in the process. It is not clear from the data that reduced labor costs were strictly the result of a reduced number of field operations (i.e., tillage) or less ‘walking’ of weeds in organic reduced-till fields. However, the number of observations in the reduced-till sample was low, casting doubt on the true representation of these results.
Organic producers using CT obtained soybean yields that were approximately 70% of their conventional counterparts (Table 1), similar to results reported by McBride and GreeneReference McBride and Greene37, but different from other reports. Badgley et al.Reference Badgley, Moghtader, Quintero, Zakem, Chappell, Avilés-Vázquez, Samulon and Perfecto44 conducted the most comprehensive review of organic versus conventional yields worldwide and found few yield differences between the two production systems. Delate et al.Reference Delate, Duffy, Chase, Holste, Friederich and Wantate45 reported equivalent organic and conventional corn and soybean yields under Midwestern US conditions. Pimentel et al.Reference Pimentel, Hepperly, Hanson, Douds and Seidel34 also confirmed similar yields over 22 years of a long-term comparison trial. Mäder et al.Reference Mäder, Fliessbach, Dubois, Gunst, Fried and Niggli5 obtained organic yields that were between 80 and 100% of conventional yields for all crops over 21 years in an organic rotation of wheat, potato and grass–clover hay. Other studies reported corn yield in an organic system reaching 92% of conventional corn yieldReference Delate and Cambardella46, taking into account yields during transition from conventional production. In the same study, organic soybean yield was the same as conventional soybean yield. Porter et al.Reference Porter, Huggins, Perillo, Quiring and Crookston47 reported organic corn yields 7–9% lower and organic soybean yields 16–19% lower than conventional crop yields. Recently, Singerman et al.Reference Singerman, Hart and Lence48 surveyed organic corn and soybean producers in three major organic soybean-producing states and also found similar results to the ARMS data. The dissimilarity between these survey data and the literature could be due to weeds being more easily managed in experimental plots than on private farms. In addition, the genetic background of the different soybean types/varieties planted in organic versus conventional farms may have impacted results: 80% of ARMS-surveyed organic farmers planted the larger-seeded, high-protein, tofu-type soybeans for the food-grade market, which traditionally have had lower yields than the smaller-seeded, herbicide-resistant feed-grade soybeans that 96% of conventional producers reported growing.
Despite lower yields and higher costs reported by organic producers, CT organic farmers had positive economic results, with an average profit of approximately $120 per planted acre (Table 1). Conventional soybean producers, on the other hand, did not derive a profit, based on their costs of production, yields and sale price, with the NT group achieving the greatest returns at a loss of approximately $6 per planted acre. Profits from organic soybean production were a consequence of the price premiums that organic producers were able to obtain in the market, which more than offset lower yields. These results correspond with those reported by Delate et al.Reference Delate, Duffy, Chase, Holste, Friederich and Wantate45, Reference Delate, Chase, Duffy and Turnbull49 in which profit from organic soybean production was significantly greater than from conventional production. Singerman et al.Reference Singerman, Lence and Kimble-Evans50 reported that organic soybean prices from 2004 to 2009 were consistently and significantly higher than conventional soybean prices with approximately the same risk as conventional production. Thus, even without the C-offset market, organic price premiums could incentivize conventional soybean producers to convert to organic practices to increase their profits. However, as ClarksonReference Clarkson51 pointed out, the 2-year period in which transitioning producers would not obtain organic price premiums; a perceived increased production risk with organic production; the different marketing structure compared to delivering the crop to the local elevator; and less governmental support, in terms of adequate crop insurance, research and extension support, discourage conventional farmers from considering organic production.
Although ‘crop rotation’ was not enumerated in the ARMS dataset, we can speculate on the effect of different crop rotations on profitability, based on data derived from Midwestern US organic systems for that periodReference Chase, Delate and Johanns52. In 2006, returns to management for organic soybeans in a corn–soybean–oat–alfalfa rotation were $231 acre−1 with a rotational average of $180 acre−1. This value compares to $67 that was returned to management for the conventional corn–soybean rotation, a difference of $113 acre−1. For the 2006–2010 time period, the average difference was $211—again favoring the organic rotation.
Fertilizer use and GHG emissions estimates
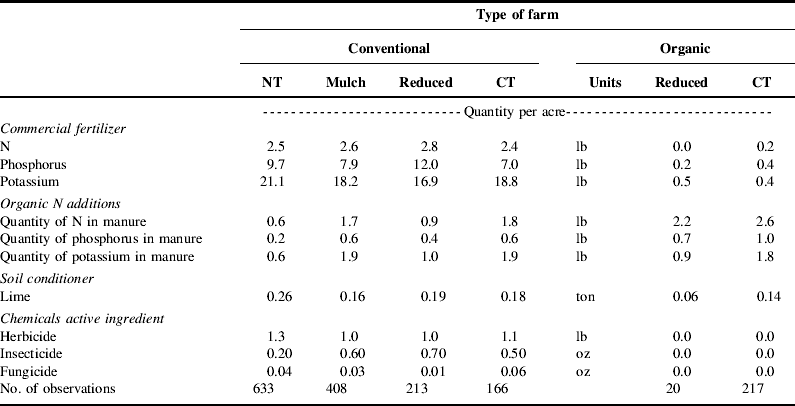
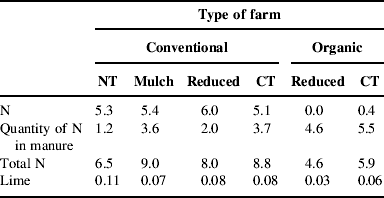
Estimates of quantities of commercial fertilizers, other organic N additions (e.g., manure), lime and active ingredients of chemicals that surveyed producers used, according to tillage practices on a per-acre basis, were less on organic than conventional farms in all categories except for manure (Table 2). According to the weighted sample, conventional soybean producers used 161,372,000 lb N for soybean production in 2006, compared to 16,532 lb N in organic systems. Using computations for N2O emissions converted into CO2 eq. (Table 3), organic producers using CT generated 9 and 33% less CO2 eq. emissions from N additions than conventional producers using NT and CT, respectively. Since no questions were asked of surveyed producers regarding the exact type of material used for liming, we assumed that all producers used limestone, a typical material used in the Midwestern US. CT organic producers generated 45 and 25% less CO2 eq. emissions from lime than conventional producers using NT and CT, respectively (Table 3).
Table 2. Commercial and organic fertilizer, soil conditioner and chemicals quantities by tillage practice1.
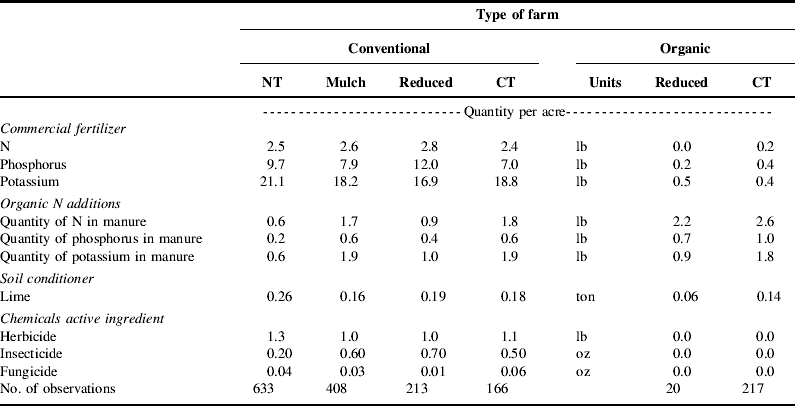
1 Calculations based on the assumption that the entire planted acreage of soybean was treated.
Table 3. CO2 eq. emissions from N and lime additions by tillage practice (kg CO2 eq. acre−1 yr−1).

Energy use between organic and conventional production
Data in the ARMS survey were limited to farm-operation activities and costs; thus, we used pesticide and fertilizer consumption as a proxy for energy inputs since energy use in on-farm operations was indirectly contained in the dataset (e.g., through fuel, electricity, fertilizer and pesticide quantities). Although there are excellent estimators of farm energy use in tools such as the USDA-Natural Resources Conservation Service (NRCS) Energy Estimator53, the NRCS calculator uses average estimates based on numerous sources, while we utilized ARMS data only in order to be consistent in our analysis. Using data from Table 1, CT organic soybean producers reported higher direct-energy consumption, as the costs of fuel, lubrication and electricity were 280 and 41% higher than from conventional producers using NT and CT, respectively. However, when one considers both direct and indirect energy use (i.e., including energy use costs of fertilizers and pesticides), average energy cost for CT organic producers was about 9% lower than that for NT conventional producers. Direct and indirect energy use costs for organic producers were $34.57 versus $37.83 per acre for conventional producers.
Additionally, there are energy costs that are unaccounted, but accrue during manufacture of petroleum-based inputs, but we only analyzed for an individual farmer's profit-maximizing decision. Thus, since the ‘positive externality’ derived from lower indirect energy consumption in organic soybean production was not internalized, we did not include the emission calculations. However, this calculation could be considered when taking into account the societal benefits and lower environmental footprint of organic agricultural practices.
As indicated in a preliminary analysis report, USDA-ERS54 estimated that the Clean Energy Bill would increase the price of petroleum, electricity and natural gas by 3.2, 7.4 and 10.7%, respectively, by 2015. The report also indicated that even though direct energy prices would rise immediately, affecting the agricultural sector, the impact of the legislation on crop producers would be minimized, due to the Bill's provisions for energy-intensive, trade-exposed entities (EITE) to be included, such as N fertilizer companies. Thus, USDA-ERS concluded that due to the EITE provisions, greater costs primarily would be a consequence of fuel costs, with greater impact on fuel-intensive crops, such as rice and sorghum. With soybean capable of fixing its own N, soybean crop producers would be minimally impacted; UDSA-ERS estimated an average increase of $0.45 per acre from 2012 to 2018.
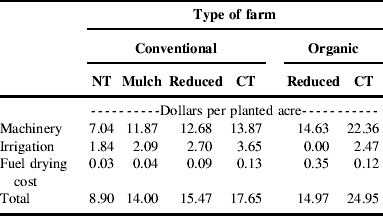
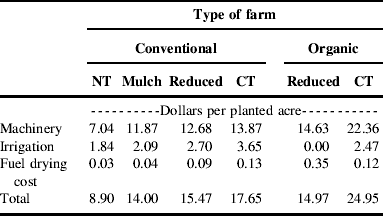
We used energy cost data to compare costs of fuel, lubrication and electricity, classified by machinery use, irrigation and drying, between organic and conventional soybean producers, which showed greater machinery costs in organic production (Table 4). We then estimated the impact of the Clean Energy Bill on energy inputs of soybean producers in our profitability analysis.
Table 4. Fuel, lubrication and electricity costs for machinery and irrigation; and fuel cost of drying, by tillage practice.
Changes in profitability derived from the C-offset market
We evaluated the impact of ‘green payments’ similar to those promulgated in the American Clean Energy and Security Act of 2009 on the profitability of soybean producers. In order to measure the differential emissions of CO2 eq. from the two most relevant methods of production (conventional NT and CT organic), we used emissions generated by CT, conventional soybean production as the baseline. We used the value of 20% greater C sequestration with the adoption of organic practices from the Soil Association33, as this was the most comprehensive review of C-sequestration comparisons between conventional and organic methods of production. The value was also very similar to that of Liebig and DoranReference Liebig and Doran36 from surveyed organic farms, and was within the range reported by Rodale Institute8 from their experiments.
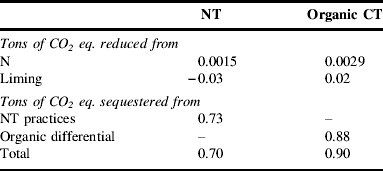
Thus, based on the literature, as well as on EPA's estimate of additional CO2 eq. sequestration from conversion to reduced tillage and information from Table 3, we constructed Table 5, which shows the differential emission reductions and sequestration rates between NT and CT organic production. Conventional NT and organic soybean production had a sequestration rate of 0.7 and 0.9 t CO2 eq. acre−1 yr−1 compared to conventional production using CT. Organic production was 28% greater in t CO2 eq. acre−1 yr−1 sequestration than NT.
The Congressional Budget Office55 estimated that the price of GHG allowances would be $16 per t CO2 eq. in 2012 and would rise to $26 per t CO2 eq. in 2019. EPA41 estimated that the allowance price would be about $13 per t CO2 eq. in 2015 and would rise to $16 by 2020. Table 6 shows the increased profitability of producers using NT and CT organic production with the introduction of C markets. Values represent sequestration rates (Table 5) multiplied by corresponding allowance price. Since we assumed that EITE provisions would prevent fertilizer and chemical prices from increasing until 2025, we computed no change in their prices until then. Other agricultural input prices would likely increase as the consequence of the rise in prices for petroleum, electricity and natural gas; therefore, we used USDA's54 estimates to compute their effect on soybean producers’ profitability. Thus, we multiplied the costs in Table 4 for machinery by the estimated increase in petroleum price for years 2012, 2020 (used as a proxy for 2019) and 2025, i.e., by 3.2, 4 and 4.7%, respectively. In the case of irrigation, we multiplied costs by the estimated increase in electricity prices for the same years, i.e., by 10.7, 12.7 and 14%, respectively. For drying costs, we multiplied costs by the estimated increase in natural gas prices, i.e., by 7.4, 8.5 and 8.6%, respectively, for each year. For the 2025 scenario, we multiplied fertilizer and chemical costs in Table 1 for each of the corresponding tillage practices by the estimated increase for natural gas in that year (8.6%).
Table 5. Differential emission reductions and sequestration rates between NT and organic practices with respect to CT (t CO2 eq. acre−1 yr−1).
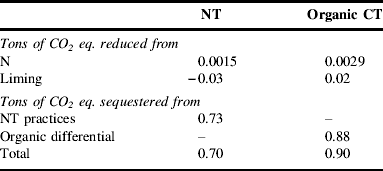
Table 6. Comparison of changes in profits among CT, NT and CT organic, derived from the implementation of the C-offset markets.
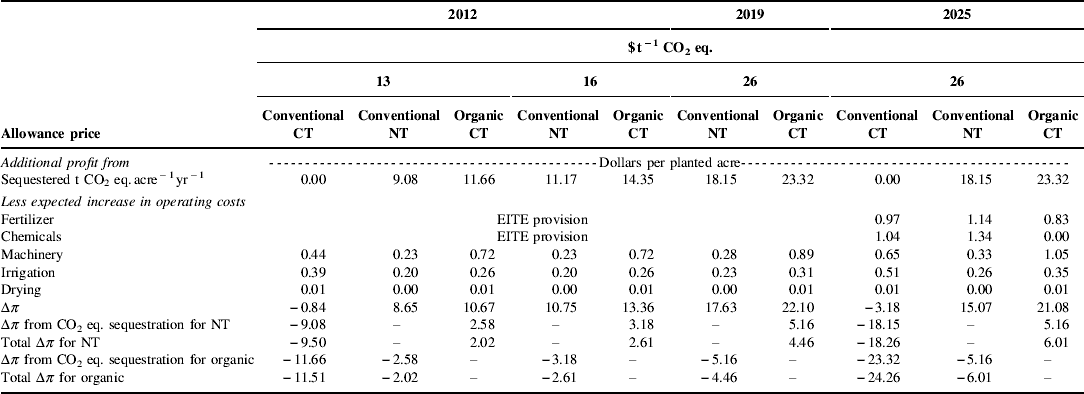
In 2012 (2025), conventional producers using CT would lose an additional $0.84 ($3.18) per planted acre, whereas NT conventional producers and CT organic producers would benefit from the creation of a cap-and-trade system. NT producers would increase their profit by $8.65 ($15.07) per planted acre, while CT organic producers would increase profit by $10.67 ($21.08) per planted acre. Thus, adopting the economic results from Table 1 as a reference, ceteris paribus, in 2012 (2025), conventional producers that use CT will have an average total loss of $37.04 ($39.38) per planted acre; NT producers would have an average profit of $2.58 ($9) per planted acre; and CT organic producers would have an average profit of $130.79 ($141.20). Due to EPA's differential sequestration rate attributed to NT, profitability per acre would increase $9.08 ($18.15) when switching from CT to NT in 2012 (2025). Similarly, profitability per acre would increase $11.51 ($24.26) when switching from conventional agriculture using CT to organic agriculture. The total differential in profitability between NT and organic CT starts at $2.02 per acre in 2012 if the price of permits would be $13 t CO2 eq.; the differential increases to $4.46 per acre in 2019 and to $6.01 per acre in 2025 when the EITE provisions would be scheduled to expire.
Conclusions
Using the USDA-NASS ARMS dataset for soybean production in 2006, we estimated changes in soybean production profitability based on surveyed producers’ management practices, incentives for the generation of GHG offset credits, and the increase in energy input prices that a cap-and-trade system would introduce in agricultural markets in the USA. Conventional producers would profit from conversion to organic agriculture, especially after the EITE provisions expire in 2025. These conclusions are particularly pertinent for conventional soybean producers that use CT, not only because the differential profit between CT with herbicides and CT organic production is the greatest but also because this group would incur the greatest losses with the introduction of the C-offset market. These conventional producers could more easily convert to NT production and realize economic benefit. Finally, given the expected increase in energy prices over the next decade and the positive externality derived from lower indirect energy consumption, organic soybean production offers significant economic benefits compared with conventional production with or without NT.
Acknowledgements
The authors wish to thank Robert Turnbull, Iowa State University, Cynthia Cambardella, USDA-ARS National Laboratory for Agriculture and the Environment, and the USDA-NASS for assistance with this study.


