


Introduction
Permaculture is recognized as a popular international sustainability movement, as an ethical design system for community development, and as a suite of agroecological management practices (Ferguson and Lovell, Reference Ferguson and Lovell2014). Fundamentally, permaculture is a decision-making framework which applies systems thinking to determine appropriate landscape designs and management techniques (Holmgren, Reference Holmgren2002, p. xix; Ferguson and Lovell, Reference Ferguson and Lovell2014). The term permaculture, a contraction of permanent culture, was first coined 40 years ago. Its authors were particularly inspired by low-energy, ecological and sustainable alternatives to industrial agriculture (Mollison and Holmgren, Reference Mollison and Holmgren1978). Permaculture predicted that an agricultural system which strategically and ethically integrated ecological principles would, relative to industrial agriculture, improve soil, water, genetic richness and wildlife conservation while reducing pollution, erosion and crop damage from pests (Mollison, Reference Mollison1988, p. 4–6). In contemporary terminology such benefits provided by agroecosystems to humans are titled ecosystem services (Costanza et al., Reference Costanza, de Groot, Braat, Kubiszewski, Fioramonti, Sutton, Farber and Grasso2017).
Co-originator Mollison perceived the academic community as resistant to his radical agricultural reform and instead targeted publications, courses and workshops at grassroots communities. Early permaculture publications (Mollison and Holmgren, Reference Mollison and Holmgren1978; Mollison, Reference Mollison1979, Reference Mollison1988) are still considered primary references for the movement. This strategy has proven reasonably successful: permaculture has become internationally recognized and adoption has been reported in at least 45 countries around the globe (Ferguson and Lovell, Reference Ferguson and Lovell2015; Guitart et al., Reference Guitart, Byrne and Pickering2015; Hathaway, Reference Hathaway2015).
The broad-scale adoption of permaculture has also been criticized as not adequately supported by empirical evidence. Peer-reviewed permaculture publications have largely focused on sustainability applications outside agroecology including social sciences, architecture and education (Ferguson and Lovell, Reference Ferguson and Lovell2014), resource management (Akhtar et al., Reference Akhtar, Lodhi, Khan and Sarwar2016), community development (Veteto and Lockyer, Reference Veteto and Lockyer2008) and labor productivity (Ferguson and Lovell, Reference Ferguson and Lovell2017a). Importantly, the credibility of permaculture as an agroecological reform is compromised by a general lack of contemporary systematic study rather than specifically negative results (Ferguson and Lovell, Reference Ferguson and Lovell2014), indicating that this is a rich deposit for future research.
Designing studies to evaluate the effects of permaculture management on ecosystem services is uniquely challenging because there is no strong consensus on what characterizes or counts as an applied permaculture. In contrast to organic agriculture (e.g. Government of Canada, 2016), there are no legislated standards or accredited certification bodies regulating permaculture. While permaculture literature dedicates considerable attention to practical design strategies for site planning, system establishment, soil improvement and water management (Mollison and Holmgren, Reference Mollison and Holmgren1978; Mollison, Reference Mollison1979), co-originator Holmgren emphasizes that none of the individual techniques or species described are unique to nor required for its application (Holmgren, Reference Holmgren and Holmgren1991).
Despite this complexity, steps have been made towards developing a universal description of applied permaculture. In the permaculture homelands of Australia, Guitart et al. (Reference Guitart, Byrne and Pickering2015) surveyed 50 permaculture and non-permaculture identifying community gardens to compare the adoption rates of nine categories of management practices. This study established that permaculture philosophy could be correlated to management practices: when practices were indexed according to permaculture values, permaculture gardeners scored significantly higher than non-permaculture gardeners. The authors further concluded that permaculture gardeners employed lower-impact practices than non-permaculture gardeners. Compared with their non-permaculture counterparts, permaculture gardeners were universally ‘organic/chemical-free’, more often applied homemade fertilizers to address soil quality, and used plant diversity to control pests, weeds and diseases (i.e. biocontrol).
Building on this foundation, we propose that while permaculture promotes flexibility and locally-adapted solutions, the curriculum specifically emphasizes three key management practices: perennial species, polycultures and zone design (Mollison and Holmgren, Reference Mollison and Holmgren1978; Mollison, Reference Mollison1979, Reference Mollison1988). Permaculture was initially introduced as a pioneering effort into perennial agriculture and largely informed by observations of ecological succession in natural ecosystems (Mollison and Holmgren, Reference Mollison and Holmgren1978). Early permaculture literature predicted that agroecosystems dominated by perennial species would reduce compaction, erosion and disruption of soil biota (Mollison, Reference Mollison1988, p. 215). Diversity in ‘plant species, varieties, yields, microclimates, and habitat’ is outlined as a basic characteristic of permaculture (Mollison and Holmgren, Reference Mollison and Holmgren1978, p.6) and it is strongly recommended that polycultured species be arranged to optimize beneficial interactions (Mollison, Reference Mollison1988, p.60). Finally zone design, perhaps one of the few truly unique features of permaculture, offers rigorous prescriptions for the functional configuration of landscape diversity. Five zones partition crop species based on cultivation intensity where most intensively cultivated gardens (zone 1) are closest to the center of human activity, followed consecutively by less intensively managed gardens and orchards (2 and 3), extensive pasture or wood lots (4) and finally uncultivated natural areas (5) at the periphery (Mollison and Holmgren, Reference Mollison and Holmgren1978, p.53–56). Zone design is intended to optimize labor efficiency on highly diverse farms and is often visualized as concentric circles.
The consistent and emphatic recommendations by the permaculture curriculum for perennials, polycultures and zone design could logically be interpreted by grassroots adopters as compulsory characteristics and are therefore promising baselines for defining applied permacultures (Ferguson and Lovell, Reference Ferguson and Lovell2014). Furthermore, these practices strongly deviate from the conventional approach of annual monocultures in simplified landscapes thus providing an opportunity for comparison. Parallel agronomic and ecological research on perennialization, species diversity and landscape heterogeneity provide compelling support for claims that an agricultural system including these elements would enhance provisioning, supporting and regulating ecosystem services (Hooper et al., Reference Hooper, Chapin, Ewel, Hector, Inchausti, Lavorel, Lawton, Lodge, Loreau, Naeem, Schmid, Setala, Symstad, Vandermeer and Wardle2005; Asbjornsen et al., Reference Asbjornsen, Hernandez-Santana, Liebman, Bayala, Chen, Helmers, Ong and Schulte2013; Kremen, Reference Kremen2015). As such, establishing the prevalence of these traits among applied permaculture farms may provide direction in designing future studies aimed at evaluating ecosystem function.
Despite permaculture's ‘general isolation from science’ (Ferguson and Lovell, Reference Ferguson and Lovell2014), the persistence of grassroots enthusiasts in disseminating the permaculture curriculum over the last 40 years has created a unique opportunity for observational research (Veteto and Lockyer, Reference Veteto and Lockyer2008). By completing multi-site systematic vegetation surveys on operating permaculture farms this study aims to use plant community characterizations to evaluate how consistently independent adopters interpret and apply permaculture theory. Features which are consistently adopted may be used as a baseline for designing future comparative studies. It is predicted that independent permaculture farmers will consistently emphasize perennial species, polycultures and zone design resulting in farms characterized by perennialization, and high plant species diversity divided among multiple, compositionally-distinct plant assemblages.
Methods
Study area and site selection
This study was completed in August 2016 in the Vancouver Island-Coast region of British Columbia, Canada. The study area is characterized by a mild, coastal and Mediterranean-like climate permitting some of the longest growing seasons (185 frost-free days is typical) in Canada (Government of Canada, 2017). The plant hardiness zones here are 8a and 8b (Natural Resources Canada, 2017).
Ten sites were selected from the study area. All sites were commercially operating farms and self-identified as currently applying permaculture management. Informal interviews with farmers verified familiarity with fundamental permaculture theory. Site areas were less than 10 acres (n = 6) or 10–40 acres (n = 4). This is smaller than average for Canada overall, but is consistent with other farms in the study region (Statistics Canada, 2017) and permaculture farms in the USA (Ferguson and Lovell, Reference Ferguson and Lovell2017a).
Vegetation surveys
Vegetation surveys were observational and non-destructive. Each sample recorded the identity and abundance, as the number of individuals, for all species present within a 1-meter-wide strip transect. Ten samples were collected from each of the ten sites for a total of 100 samples. Farm managers at each site identified management zones and assigned them 1–5 based on their interpretation and application of permaculture zone design. Of the ten samples collected per farm, two were taken from each of the five zones, resulting in a total of 20 samples per zone category (1–5). Outer zones (4–5) contained noticeably lower planting densities and larger individuals than inner zones (1–3). To accommodate this, strip transects were 5 m long for zones 1–3 but extended to 10 m long for zones 4–5. Crops were typically planted in beds or rows resulting in a patchy distribution. When possible transects were positioned centrally within patches, away from edges and perpendicular to rows. Non-random placement will positively bias our diversity scores but allowed for a more complete characterization of species identities and richness, which was our primary objective.
Life history and growth habit were assigned to each observed species. Life history was categorized as annual or perennial based on harvesting period. Growth habit was categorized as herbaceous, shrub, or tree, in accordance with USDA conventions (United States Department of Agriculture, n.d.). Species were further distinguished as cultivated if intentionally grown by the farmer or non-cultivated if a volunteer, native or naturalized within the site.
Community composition
Species diversity indices were calculated using TrueDiversity-18.12.12 (Goepel, Reference Goepel2012). Species richness (R) counts the total number of species observed and should be well above one in a polyculture. Species richness does not however account for evenness, which measures the relative abundance of each species, such that a monoculture can have an inflated species richness if even a few individuals of other species are present. Shannon index and Simpson's dominance are diversity calculations which include both species richness and evenness. Shannon entropy is a popular diversity measure, where higher values correspond with greater diversity. Simpson's dominance ranges from 0 to 1 where values approaching 1 indicate that, as in a monoculture, a select number of species are dominating the community. Alternately, values approaching 0 indicate more even species ratios and higher diversity. Species richness density (R/m2) and abundance density were calculated per zone by dividing species richness and abundance, respectively, by sampling area (zones 1–3: 5 m2, zones 4–5: 10 m2) to acknowledge uneven sample areas. Species frequency was calculated as the percentage of sites observing a given species.
Data analysis
Farm-scale effects were analyzed using sites (n = 10) as replicates and pooling all within-site samples regardless of zone. Multiple observations of the same species within a given site are counted once, such that species richness reflects the total number of unique species observed for that site. Management zone effects were analyzed separately by treating zone as a factor with five levels and sites as replicates.
Means and standard deviations for species diversity indices were calculated in MS Excel. All other statistical analyses were completed using R (version i386 3.3.2). One-way ANOVAs analyzed species richness, abundance and diversity indices by life history, growth habit and cultivation practices at the farm-scale. Two-way factorial ANOVAs further analyzed species richness by zone and life history or growth habit. Groups were determined as significantly different by Tukey HSD with a critical value of P < 0.05. Where parametric ANOVA assumptions for normality and homogeneity of variance were not met, as measured by Shapiro–Wilks and Levene's tests respectively, non-parametric Kruskal–Wallis rank sum tests were also considered. Results which were significant for both parametric and non-parametric ANOVAs were considered robust. Community composition (species-site incidence frequency) was analyzed using Morisita-Horn estimated pairwise similarity in the SpadeR package (Chao et al., Reference Chao, Ma and Hsieh2015). Sample-based species accumulation curves were calculated per zone using the vegan package, where samples were area-adjusted to 10 m each by combining sub-site samples (two 5-m transects per site) for zones 1–3.
Results
Perennialization
At the farm-scale permacultures were dominated by perennials (Fig. 1). Perennials accounted for 73% mean richness and 61% mean abundance (Table 1). ANOVAs found a significant difference in favor of perennial species richness, but not for abundance (Table 3).

Fig. 1. Plant species richness by life history on permaculture farms. Vegetation surveys completed in August 2016 in British Columbia, Canada analyzed using a one-way ANOVA (n = 10 sites). Means not sharing the same letter are significantly different (Tukey HSD, P < 0.05). Boxplots demonstrate species richness (the number of plant species) ranges including medians (thick center line), upper and lower quartiles (top and bottom line), range values (dashed umbrella), and outliers (empty circle).
Table 1. Permaculture farm-scale summary statistics for species and functional diversity

Vegetation surveys were completed for ten permaculture farms in the Vancouver Island-Coast region of Canada. Permaculture farms demonstrate high species diversity as indicated by high species richness (R), high Shannon entropy (H’), and low Simpson Dominance (ʎ). Permaculture plant diversity is functionally diverse, including a mix of growth habits, but is dominated by perennial species and individuals.
Table 2. Species and functional diversity summary statistics by permaculture zone

Vegetation surveys were completed for ten permaculture farms in the Vancouver Island-Coast region of Canada. Species diversity includes species richness (R), Shannon entropy (H’), and Simpson Dominance (ʎ). Functional diversity considers life history and growth habit.
Table 3. One-way Analysis of Variance (ANOVA) for permaculture's functional and spatial diversity at the farm-scale

Parametric one-way ANOVAs were used to compare the effects of several factors on species richness, richness density, abundance and diversity. The non-parametric ANOVA Kruskal–Wallis rank sum test was additionally considered when parametric ANOVA assumptions were not met. P-values were considered significant at P = 0.05 and are indicated with *. Deviations from normality (Shapiro–Wilk test) and homogeneity of variance (Levene's Test) are indicated with * where respective P-values were <0.05. Significant values for parametric ANOVAs were supported by non-parametric tests indicating robust results.
Species diversity
Permaculture farms were characterized by high plant species diversity as evidenced by mean species richness (59), mean Shannon entropy (3.4), and mean Simpson's dominance (0.06) (Table 1). Total richness was dominated by rare species: of the 255-species observed across ten surveyed sites 71% were observed at only one or two sites. Individual sites ranged from a minimum richness of 41 species to a maximum of 99 (Table 1) and exhibited high compositional overlap with an average estimated pairwise similarity of 0.92. All sites included uncultivated species, however observed farm-scale richness was significantly higher for cultivated species with a mean of 42 crop species per site (Fig. 2, Table 3). Vegetation stands consistently included multiple species arranged in intercropped rows or as permaculture ‘guilds’ consisting of a central element surrounded by supporting species (personal observation).

Fig. 2. Plant species richness by cultivation practice on permaculture farms. Vegetation surveys completed in British Columbia, Canada analyzed using a one-way ANOVA (n = 10 sites). Boxplots demonstrate species richness ranges (dashed umbrella) and medians (thick center line). The number of cultivated species (includes crops and support plants) exceeded the number of uncultivated species (includes native, naturalized, volunteer and weed species) given a Tukey HSD of P < 0.05 (means not sharing the same letter are significantly different).
Landscape configuration
Zone design was implemented on all surveyed sites and resulted in consistently segregated and ordered plant assemblages on permaculture landscapes (Figs. 3–5). One-way ANOVAs at the farm-scale detected significant zone effects on species richness and diversity (Table 3). Two-way ANOVA results were less conclusive but suggest interactions between zone and life history or growth habit, respectively, affect species richness (Table 4).
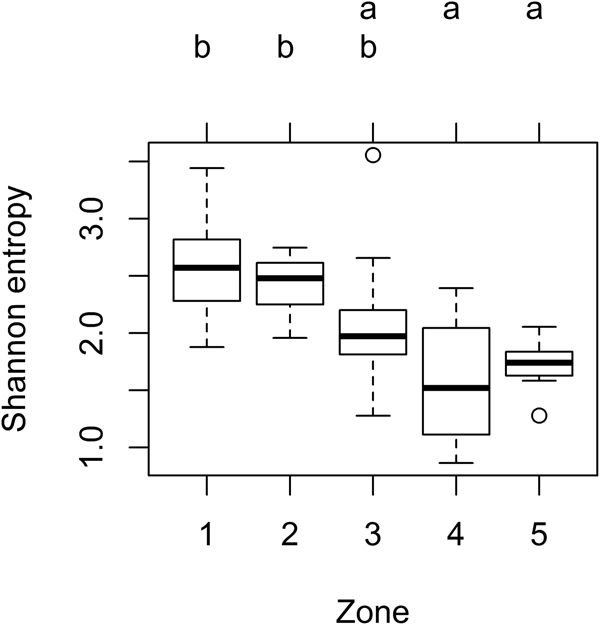
Fig. 3. Distribution of plant diversity among zones on permaculture farms. Shannon entropy was calculated from vegetation surveys completed in British Columbia, Canada and analyzed using a one-way ANOVA (n = 10 sites). Inner zones (1 and 2) exhibited higher Shannon entropy and thus greater plant species diversity than outer zones (4 and 5), where means not sharing the same letter are significantly different (Tukey HSD, P < 0.05). Boxplots demonstrate Shannon entropy medians (thick center line), range values (dashed umbrella), and outliers (empty circle) per zone.

Fig. 4. Distribution of plant species richness by zone and growth habit on permaculture farms. Vegetation surveys were completed in British Columbia, Canada and analyzed using a two-way factorial ANOVA (n = 10 sites). Boxplots demonstrate the significant interaction effect (P < 0.05) of growth habit and zone on species richness: herbaceous species are more numerous in inner zones (1 and 2) but infrequent in outer zones (4 and 5).

Fig. 5. Sample-based species accumulation curves by permaculture zone. Vegetation surveys were completed in British Columbia, Canada. Samples were area-adjusted to 10 m each by combining within-site samples for zones 1–3 (two transects at 5 m each, n = 10 sites). Plateauing curves indicate that species compositions in zones 4 and 5 were adequately reported, however, the rising curves in zones 1–3 indicate that sampling effort was insufficient here and that actual species richness exceeds that surveyed.
Table 4. Two-way Analysis of Variance (ANOVA) of species richness by zone and life history or growth habit on Canadian permaculture farms

P-values were considered significant at P = 0.05 and are indicated with *. Non-parametric ANOVA Kruskal–Wallis rank sum test was additionally considered when parametric ANOVA assumptions were not met. Deviations from normality (Shapiro–Wilk test) and homogeneity of variance (Levene's Test) are indicated with * where respective P-values were <0.05.
Most diversity analyses grouped zones into only two significantly distinct clusters, typically segregating inner zones (1–2) from outer zones (4–5) with zone 3 consistently intermediate (Figs. 3–5). Perennial species were dominant in all zones, but perennial richness and abundance were lower in inner zones (Table 2), reflecting a combination of annual and perennial herbaceous species. Inner zones were thus characterized by higher species richness density, abundance density and Shannon entropy (Fig. 3), and were dominated by herbaceous species richness (Fig. 4) and abundance (Table 2). By contrast, outer zones had relatively lower species diversity (Shannon entropy, Fig. 3), lower species richness and abundance densities, and were dominated by shrubs and trees (Fig. 4, Table 2). Species accumulation curves in inner zones did not plateau, indicating that sampling underestimated species richness (Fig. 5).
While zone names (1–5) did not necessarily reflect spatial arrangement on the actual landscape, nominally adjacent zones consistently shared a greater overlap in species composition (as incidence frequency) than nominally distanced zones. Community compositions were most similar among inner zones: zones 1 and 2 shared 65 species (n = 10 sites) and demonstrated high estimated pairwise similarities (1.00 ± 0.14). By contrast, zones 1 and 5 shared only nine species with an estimated pairwise similarity of 0.03 ± 0.06.
Plant compositions were strongly consistent with permaculture literature prescriptions (Table 5): zones 1 and 2 were most frequently characterized by annual herbaceous vegetables and supporting companion plants; zone 3 by perennial berries and fruits; zone 4 by perennial fruits and some native species; and zone 5 exclusively by uncultivated native and naturalized species.
Table 5. Predicted versus applied permaculture zone plant community compositions

Sources: Mollison and Holmgren, Reference Mollison and Holmgren1978, p.53–56; Mollison, Reference Mollison1979, p. 10.
Common species: the ten most frequently observed plant species per zone based on permaculture farm vegetation surveys. SF: abundance-ranked site frequencies for each species (n = 10 sites). Life history (LH) includes annuals (A) and perennials (P). Growth habit (GH) includes herbaceous (H), shrubs (S) and trees (T).
Discussion
Consistency in grassroots adoption of permaculture practices
Grassroots networks and social movements have been recognized as uniquely positioned to influence agroecological transitions and have been instrumental in publicizing the permaculture approach (Ferguson and Lovell, Reference Ferguson and Lovell2015). This study characterized plant communities for ten Canadian grassroots permaculture farms in order to evaluate the adoption rate and intensity of popular permaculture practices, namely perennialization, polycultures and zone design. This multi-site quantitative characterization bridges the gap between theory and practice and builds on presence-absence observations made by previous surveys (Guitart et al., Reference Guitart, Byrne and Pickering2015; Ferguson and Lovell, Reference Ferguson and Lovell2017b) to provide greater insight into what constitutes an applied permaculture.
Independent adopters in the Vancouver Island – Coast region were remarkably consistent in their interpretation and application of permaculture theory: the three management practices investigated were universally adopted on all surveyed sites. Permaculture management in Canada is therefore, and despite lacking formal regulations, characterized by perennial species, polycultures and zone design. Additionally, and consistent with previous studies (Guitart et al., Reference Guitart, Byrne and Pickering2015), Canadian permaculture farms adhered to organic or chemical-free practices (personal communications). These results demonstrate the extent and depth of the permaculture movement's dissemination to Canada from its origin across the Pacific.
From permaculture practices to agroecosystem properties
Grassroots adoption of perennials, polycultures and zone design combined to produce the corresponding agroecosystem properties of farm-scale perennialization, landscape heterogeneity and species diversity.
As predicted, permaculture farms were characterized primarily by perennial species and individuals growing together in polycultures. The distribution of species was however noticeably influenced by zone design: inner zones permitted many annual and herbaceous species, especially common crops such as salad species, brassicas, tomatoes and legumes (Table 5). By contrast, outer zones were characterized almost exclusively by perennial shrub and tree species (Table 2). As such, zone design contributed to landscape heterogeneity by partitioning certain functional traits, particularly life history and growth habit, among zones. Permaculture farms were therefore more precisely characterized by the presence of multiple, compositionally-distinct and largely perennialized polycultures. Further contributing to landscape heterogeneity, farmers consistently honored permaculture theory by dedicating zone 5 to natural or semi-natural space and species.
Permaculture management is expected to enhance local crop diversification. Previous surveys reported a mean of only seven crop species per farm in the Vancouver Island region and rarely greater than 13 crops per farm across the province of British Columbia (MacNair and Dobb, 2014). Census data for over 20 000 farms in Canada's western prairies demonstrated even lower crop diversification with an average of 4.12 crops per farm in 2002 (Bradshaw et al., Reference Bradshaw, Dolan and Smit2004). By contrast, permaculture farms cultivated a mean of 42 crop species. While our study did not differentiate between marketed and household subsistence crops, permaculture farms contained true polycultures with high diversity and low dominance values. This distinguishes permaculture from farms with only 4–13 commercial crops, as per the above surveys, and a household garden. Such farms may achieve similar farm-scale species richness to a permaculture but not evenness or diversity. Crop diversity among permaculture farms is therefore estimated to be 5–10 times greater than average for the study region and especially for typical farms in western Canada. This trend is consistent with permaculture theory, which encourages a diversity of food, fuel and fiber producing species (Mollison, Reference Mollison1979). Permaculture farmers also contributed many unusual crops for Canada such as kiwis, lemons, oranges, persimmons and goji berries.
Observed diversity is primarily attributed to vegetable and fruit crops: 100% of surveyed permaculture sites cultivated vegetables and fruit, berries, or nuts. This compares to only 26% of farms in the region growing vegetables and 31% growing fruits, berries, or nuts as reported by the 2016 census (Statistics Canada, 2017). When the focus was narrowed to include only regional vegetable or fruit producing farms, 100% of fruit and berry crops and 70% of vegetable crops reported by the census were proportionately more frequent among permaculture farms (Table 6). Hay and field crops are far less common in the study area than in greater British Columbia or Canada (Statistics Canada, 2017), so the low incidence among permaculture farms follows the regional trend.
Table 6. Incidence frequency of crop types among Vancouver Island – Coast farms

Sources: Statistics Canada, 2017.
PC: permaculture farms (this study); VIC: all Vancouver Island – Coast farms; VIC-F: Vancouver Island – Coast farms reporting fruit, berry or nut production; VIC-V: Vancouver Island – Coast farms reporting vegetable production. Values represent the ratio of farms producing the crop by the number of farms sampled (n = sample size).
From agroecosystem properties to ecosystem services
The combination of management practices and resulting agroecosystem properties observed on permaculture farms are associated with a range of ecosystem functions and services (Hathaway, Reference Hathaway2015; Krebs and Bach, Reference Krebs and Bach2018). Firstly, contemporary perennialization research supports that the strategic inclusion of perennial species benefits provisioning (agricultural yields), regulating (pest control, hydrological cycles, water quality, carbon sequestration and storage) and supporting (soil quality, pollination) ecosystem services (Asbjornsen et al., Reference Asbjornsen, Hernandez-Santana, Liebman, Bayala, Chen, Helmers, Ong and Schulte2013; Corry, Reference Corry2016). Secondly, the emphasis in permaculture not only on biodiversity but on enhancing yield via beneficial interactions may have premeditated the growing field of functional diversity; contemporary ecologists describe this as overyielding driven by complementarity or facilitation (Hooper et al., Reference Hooper, Chapin, Ewel, Hector, Inchausti, Lavorel, Lawton, Lodge, Loreau, Naeem, Schmid, Setala, Symstad, Vandermeer and Wardle2005; Szumigalski and Van Acker, Reference Szumigalski and Van Acker2005). Finally, permaculture's revolutionary notion that agricultural landscapes should seek to be multifunctional, heterogeneous and include natural conservation areas (Mollison and Holmgren, Reference Mollison and Holmgren1978, p.41) foreshadows modern wild-life friendly matrix and agricultural mosaic models (Tscharntke et al., Reference Tscharntke, Klein, Kruess, Steffan-Dewenter and Thies2005; Kremen, Reference Kremen2015).
Given the consistent interpretation and application of permaculture theory among independent adopters, combined with the extent of international recognition, permaculture may be well situated to influence the delivery of multiple agroecosystem services.
Limitations and future research
We acknowledge that plant diversity on permaculture farms was underrepresented by this study. Further sampling was needed to capture total species richness (as evidenced by Fig. 5) and seasonal variation. Measuring diversity at the species level also overlooked the frequent inclusion of multiple varietals per crop. As such, diversity values provided by this study should be interpreted as a minimum rather than representative estimates. Future research could also measure the relative proportions of each zone to better estimate the evenness component of diversity.
The characterizations described here are limited in that only one region, with a uniquely moderate climate by Canadian standards, was considered. Given popular claims that permaculture has spread to ‘every inhabited continent’ (Ferguson and Lovell, Reference Ferguson and Lovell2014) multisite surveys directly comparing plant communities between permaculture and non-permaculture farms in multiple regions is needed to compare the outcomes of permaculture movements internationally.
Interest in permaculture as an agricultural management system stems primarily from early and sustained claims that this framework contributes to improved ecosystem functioning and the delivery of multiple ecosystem services (Mollison, Reference Mollison1988). We recommend that future research focus on quantifying the delivery of provisioning, supporting and regulating services on permaculture farms, with particular attention to production yields, pollination, biocontrol, hydrological cycles and soil properties. Such data are necessary to evaluate permaculture's potential contributions towards an agroecological transition and sustainable agriculture.
Conclusion
This study successfully demonstrated that unregulated farmers consistently interpreted and applied the permaculture practices of perennials, polycultures and zone design. As predicted, independent permaculture farms within the region were unanimously characterized by perennialization, species and crop diversity, landscape heterogeneity and dedicated natural areas. These traits demonstrate how grassroots adopters are contributing locally towards an agroecological transition. While this characterization does not represent an exhaustive depiction of applied permaculture, it is recommended that future research acknowledge these qualities as a minimum for study designs and models.
Acknowledgements
We thank all the permaculture farmers and enthusiasts who contributed to this study. This study was funded by the Ontario Ministry of Agriculture, Food, and Rural Affairs and University of Guelph Partnership – Highly Qualified Personnel Scholarship.
Conflict of interest
None.


