Introduction
Long-term agroecological experiments provide insights regarding the sustainability of agricultural practices and biogeochemical processes related to those practicesReference Blake, Mercik, Koerschens, Moskal, Poulton, Goulding, Weigel and Powlson1–Reference Wortman, Galusha, Mason and Francis4. Plant diversity has been shown to influence soil properties, with specific plant families having a marked influence on soil nitrogen poolsReference Drinkwater and Snapp5. Emerging evidence points to many legume species influencing soil phosphorus (P) pools as wellReference Li, Li, Sun, Zhou, Bao, Zhang and Zhang6. Indeed, the specific legume species have been shown to uniquely access sparingly soluble soil P storesReference Li, Li, Sun, Zhou, Bao, Zhang and Zhang6–Reference Masaoka, Kojima, Sugihara, Yoshihara, Koshino and Ichihara8. However, the vast majority of studies examining legume interactions with P bioavailability have been performed over a short time span, and little is known about the consequences for P cycling over a decade or more.
Management of P presents unique challenges, because although the concentration of total P in soil is large (300–5000 mg kg−1), it is difficult for plants to accessReference Hinsinger9. Available P concentrations in soil solution are often extremely low, and P applied as fertilizer can be rapidly fixed or transformed into sparingly soluble poolsReference Walker and Syers10. Phosphorus complexes with aluminum (Al) and iron (Fe) in acidic soils, and with calcium (Ca) in alkaline soil; over 90% of fertilizer added to an acid soil may be complexed with mineralsReference Bundy and Sturgul11.
In organic farming systems, maintenance of soil P sufficient to support crop yields can be problematic, and soils often show decreased plant available P over timeReference Gosling and Shepherd12, Reference Oberson, Fardeau, Besson and Sticher13. However, declines in soil-available P in organic farming systems do not appear to be universal. For instance, soil P accumulated in organically managed crops using both a manure-based cropping system and an alfalfa-based rotation system relative to conventionally managed crops in a Nebraska cropping systems experimentReference Wortman, Galusha, Mason and Francis4. Varied results highlight the importance of understanding soil P biogeochemistry, and how crop diversity along with organic and inorganic sources of fertility influence plant available nutrientsReference Drinkwater and Snapp5, Reference Hinsinger9.
Plant mechanisms that help facilitate access to soil P, such as release of organic acids to alter rhizosphere pH and enhance P availability, have begun to be elucidatedReference Gahoonia and Nielsen14, Reference Riley and Barber15. One notable example is pigeonpea (Cajanus cajan L.), where siderophores can be excreted in sufficient quantities to mobilize sparingly soluble soil PReference Li, Li, Sun, Zhou, Bao, Zhang and Zhang6. In P-limited environments, alfalfa (Medicago sativa L.) has been shown to acidify the rhizosphere by excreting malic, citric and succinic acids that solubilize iron-bound PReference Masaoka, Kojima, Sugihara, Yoshihara, Koshino and Ichihara8, Reference Lipton, Blanchar and Blevins16. Substantial increases in P-availability have been found for soil amended with alfalfa tissuesReference Cavigelli and Thien17. Red clover (Trifolium pratense L.) roots may also have similar mechanisms, as the species has been shown to acquire P almost as effectively as alfalfaReference Cavigelli and Thien17. In addition, soybean (Glycine max L.) has a fibrous root system that can exude trace levels of organic ions in response to P-limited conditionsReference Ohwaki and Hirata18, and nitrogen fixation of soybean is often limited by P nutritionReference Cassman, Whitney and Stockinger19.
Phosphorus in the soil can be conceptualized as stored in three pools, designated as the primary inorganic, secondary inorganic and organic poolsReference Walker and Syers10. Rates at which these pools release biologically available P to the soil solution vary depending on soil conditions such as texture, pH, moisture content, plant and microbial activityReference Sanyl and De Datta20. Extractable Pi is a measure of plant-available P, which consists of easily exchangeable iron and aluminum phosphates, and is quantified in acidic to neutral soils using the Bray-1 or Melich-3 extraction methodsReference Bray21, Reference Mehlich22. Particulate organic matter (POM) is an indicator of labile soil organic matter, commonly measured using size and density fractionation methodsReference Beedy, Snapp, Akinnifesi and Sileshi23; and POM has been shown to respond rapidly to changes in management practices compared to other fractionsReference Conteh, Blair and Rochester24–Reference Franzluebbers and Stuedemann26. Although very few studies have been published relating total P in POM to P nutrient cycling, particulate organic matter phosphorus (POM-P) could be a useful indicator of labile soil PReference Salas, Elliott, Westfall, Cole and Six27.
The Long-Term Ecological Research (LTER) row-crop trial located at the W.K. Kellogg Biological Station (KBS) of Michigan State University (MSU) provides an excellent system to investigate how cropping systems influence soil P. Four treatments have been maintained in the LTER since 1989 with varying management intensity, and legume cover crops. Treatments examined here include: (1) a conventionally managed corn–soybean–wheat (C–S–W) rotation (CON); (2) an organic C–S–W rotation with red clover as a cover crop (ORG); (3) a continuous, conventionally managed alfalfa system (ALF); and (4) a successional system where old farmland was allowed to return to semi-natural grassland (SUC). In order to separate short-term versus long-term management effects, subplots were initiated where 0 or 30 kg P ha−1 fertilizer was applied, and soybeans were planted as a bioassay. The objectives of this study were to: (1) examine the bioavailability of P in CON, ORG and ALF cropping systems; (2) characterize movement of P among soil pools along a gradient of management intensity that ranged from field crops to a successional grassland; and (3) quantify changes in the P pool over time in a long-term field crop experiment.
Materials and Methods
Site description
Our study, using LTER research plots, was conducted at KBS in southwest Michigan (42°24′N, 85°24′W, elevation 288 m). Soils at the site developed on glacial outwash, and are a mixture of the Kalamazoo (fine-loamy, mixed, mesic Typic Hapludalfs) and Oshtemo (coarse-loamy, mixed, mesic Typic Hapludalfs) seriesReference Crum and Collins28. Average soil pH is 5.6, with a C concentration of 11.26 g kg−1, and a CEC of 7.75 cmol (+) kg−1. Average annual rainfall is 890 mm yr−1 with approximately half falling as snow, and the mean annual temperature is 9.7°C29.
Established in 1989, the LTER is a randomized complete block design trial (six replicate 1 ha plots per cropping-system treatment) testing agricultural systems that vary in management intensity from conventional to organic production practices applied to a C–S–W rotation (CON and ORG), conventional management of ALF, and the early successional ecosystem (SUC) that is burned on a biannual basis. The SUC treatment is dominated by perennial grasses, with a minority of forbs and approximately 20% perennial legumes29. The C–S–W rotation under ORG management has a red clover cover crop integrated as follows: it is interseeded in March or April as an understory in the wheat phase of the rotation, grown for about a year and then incorporated in the spring before corn is planted. One crop phase of the C–S–W rotation is represented each year. In CON, the initial 4 years (1989–1992) consisted of a C–S rotation, which was altered in 1993 to match the C–S–W rotation in ORG. We sampled soil in the soybean phase, thus a year after red clover was incorporated.
Agronomic protocols
Recommended practices are followed for crop system management and detailed information regarding annual applications of agricultural inputs can be found on the KBS LTER website29. Primary chemicals used under conventional management include fertilizer applied to the corn and wheat crops as an N–P compound at planting (broadcast and incorporated), one side-dress application of N-fertilizer and herbicides. Nitrogen fertilizer application averaged 155 kg N ha−1 in corn and 75 kg N ha−1 in wheat, as urea ammonium nitrate (28%) or NH4NO3. The amount of P applied depended on soil P status, and P fertilizer was not initially applied from 1989 to 1997 due to historical fertilizer management. Commencing in 1997, and based on soil Bray-Pi level, P fertilizer was applied following MSU recommendations for the CON C–S–W and ALF systems at the rates shown in Table 1. There was limited insecticide use, and almost no fungicide applicationReference Gelfand, Snapp and Robertson30. Organic management does not involve any fertilizer or manure inputs. Weed control in ORG is through primary disc tillage and supplemental rotary hoe tillage. The primary N source for ORG is N fixation, from the soybean phase of the rotation and a red clover cover crop that is established as an intercrop in the wheat phase of the rotation.
Table 1. Phosphorus budget using average (±1 SD) outputs and inputs for conventional, organic and alfalfa cropping system treatments from 1997 to 2005 at the LTER site, W.K. Kellogg Biological Station, southwest Michigan, USA.

1 Wheat planted as a break crop between alfalfa crops.
Historical versus short-term management effects
Subplots (10×15 m) were established at the north end of each 1 ha cropping system replicate of the CON, ORG and ALF treatments. These three subplots (Fig. 1) were initiated to test the effects of long-term versus recent management, by evaluating the effect of recent soybean residue and zero or 30 kg P ha−1 fertilizer. In subplot A, soybeans were planted both years, whereas the long-term management system was planted in subplots B and C. Recent fertilizer effects were tested by applying to subplot B 30 kg P ha−1 as triple super phosphate fertilizer in June, and subplot C received no P fertilizer (location of subplots relative to each other was randomly assigned in 2005 and locations maintained in 2006). Comparing plant and soil P pools from measurements made in subplots A and B in 2006 allowed evaluation of recent crop residues effects. A soybean bioassay was imposed in 2006 across all subplots, and soybean was the crop in the rotation of the main plots in 2006. Alfalfa in subplots was killed using glyphosate and incorporated 3 weeks prior to planting soybeans in 2005 and 2006. Soybeans were planted in subplots on June 15, 2005, and June 19 and 20, 2006. Subplots in CON and ORG were tilled in the spring and received fertilizer in accordance with overall agronomic protocols for the LTER (e.g., no P fertilizer in organic and P fertilizer in 2005 for conventional management, see Figure 1).

Figure 1. In 2005, to test for residue effects in 2006, soybeans were planted into subplot A in the conventional, organic and alfalfa treatments, and to test for fertilizer effects 30 kg P ha−1 was applied to subplots A and B, while a check plot subplot C had no P fertilizer. The location of the subplots was randomly assigned along the northern edge of the hectare-sized main treatment plots in the LTER. In 2006, the A, B, C subplots were planted into soybean to provide a bioassay and compare to the long-term treatments of field crops (e.g., corn or alfalfa as shown for 2005 and soybean or alfalfa as shown for 2006).
Precipitation in 2006 was 52.0 cm, distributed as follows over the months of the growing season; 14.1 cm in May, 5.1 cm in June, 7.9 cm in July, 14.9 cm in August, and 10.0 cm in September. Rainfall over the 2006 growing season was within the range of the 10-year average 50.3±13 cm (mean±SD), whereas 2005 growing season precipitation was low at 37.8 cm; data from the KBS LTER website29.
Soybean biomass was not harvested in 2005 due to deer grazing damage (despite efforts to protect the plants) in a dry year where limited vegetation was available to deer; remaining soybean residues were incorporated to assess impact of soybean residues on soil and subsequent soybean crop, per the experimental design. No detectable deer damage occurred in 2006 and soybean plants were harvested on September 8, 2006, at physiological maturity from three 0.5 m row-lengths in each subplot. Each row-length contained five to eight plants which were composited and dried as one sample. Soybean biomass was dried at 60°C for a minimum of 72 h, weighed, ground to pass through a 1 mm sieve, thoroughly mixed, and analyzed using a cold digestion process for total tissue PReference Kuo and Sparks31. Approximately 2 g of sample was placed into a digestion vessel, and digested in a microwave with hydrogen peroxide and concentrated HCl. The digests were diluted to 20 ml (1:100 digestion), then transferred to an inductively coupled plasma spectrometer for mineral analysis.
Soil sampling and phosphorus analysis
Composite soil samples, that consisted of five cores (2 cm diameter), were collected June 5 and 6, 2006, from main plot and each subplot at depths of 0–20 cm and 20–50 cm. All subplots had been tilled at the time of sampling. Bulk density measurements conducted by Grandy and RobertsonReference Grandy and Robertson32 were used, CON=1.37, ORG=1.36, ALF=1.35 and SUC=1.21 Mg m−3. Soil samples from 1992 and 2000 were obtained from LTER archives, and consisted of unground samples that were collected at a depth of 0–20 cm (five cores, composited). The year 2000 was chosen as a Soybean year in the C–S–W rotation sequence, to match the crop grown in 2006 (Table 1). Archived soil samples from 1992 were collected in the Soybean phase in conventionally managed plots, and the Wheat phase in the organic-managed plots. This mismatch occurred because a 2-year rotation sequence was followed in conventional plots through 1992, which was then altered to a 3-year sequence to match the organic-managed plotsReference Gelfand, Snapp and Robertson30.
Soil samples from 2006 were air dried, then all samples (archive and collected) were ground (2 mm) and analyzed for total P using the Kjeldahl total P method, by the Central Analytical Laboratory at Oregon State UniversityReference Taylor33. Extractable Pi as Bray-Pi was determined by A&L Great Lakes laboratories in Fort Wayne, IN using the method described in NCR-13Reference Bray21. Soil carbon was determined by dry combustion on a Carlo-Erba NA 1500 CNS (Carlo-Erba™, Milan, Italy).
Phosphorus balance
A phosphorus mass balance was assembled for the three agricultural systems examined for the years 1993–2005, following Vitousek et al.Reference Vitousek, Naylor, Crews, David, Drinkwater, Holland, Johnes, Katzenberger, Martinelli, Matson, Nziguheba, Ojima, Palm, Robertson, Sanchez, Townsend and Zhang34. Phosphorus (P) inputs, in the form of P fertilizer, were calculated based on fertilizer application records in the LTER field log data archives29. Exports from the system were calculated based on P removed in harvested plant biomass. Erosion P exports were not included in this study, but were expected to be almost nil at this siteReference Daroub, Ellis and Robertson2. Calculations for P removed with crop grain in the CON and ORG systems were based on grain yield data for the years 1993–2005, available through the LTER data archives29. The amount of P removed in alfalfa cuttings was calculated based on biomass data available also from the LTER data archives29. Phosphorus (P) tissue and grain concentrations for alfalfa and soybean were based on analysis of total tissue P in eight composite samples from the LTER in 2005 and 2006, 2.54 g P kg−1 alfalfa biomass and 4.37 g P kg−1 soybean grain, respectively. Grain phosphorus concentrations for corn (2.1 g P kg−1) and soft winter wheat (2.9 g P kg−1) were based on mean values derived from the literatureReference Daroub, Ellis and Robertson2, Reference Heckman, Sims, Beegle, Coale, Herbert, Bruulsema and Bamka35, Reference Takahashi and Anwar36, and were in the range observed for Michigan corn and wheat samples according to the MSU soil fertility management specialist (K. Steinke, personal communication).
Particulate organic matter
POM was analyzed using un-ground soil samples (0–20 cm) and a modification of methods by Salas et al.Reference Salas, Elliott, Westfall, Cole and Six27. First, sand and organic matter were separated based on size, then density separation was used to isolate POM. For size separation, 25 g of soil were shaken with 30 ml of 0.05 M NaCl in 50 ml centrifuge tubes for 2 h. Samples were passed through a 53 μm sieve and rinsed with distilled water until a clear solution was obtained. Materials retained on the sieve (sand and POM) were transferred, using distilled water, into a glass container and dried overnight at 60°CReference Beedy, Snapp, Akinnifesi and Sileshi23. Density separation was carried out on the dried sand and POM mixture by transferring to 50-ml conical centrifuge tubes containing 35 ml of sodium polytungstate of density 1.85 Mg m−3. Suspended material was mixed by slow reciprocal shaking by hand (10 strokes), and centrifuged at 2500 g for 30 min. The POM floating at the top of the tube was poured onto a 20 μm mesh nylon filter using a vacuum filtration system, and rinsed thoroughly with water to remove excess sodium polytungstate. Materials retained on the 20 μm filter were washed, using distilled water, into a pre-weighed aluminum weighing pan and dried for 24 h at 60°C. Once dry, pans were weighed and POM was ground by hand using a porcelain mortar and pestle. Sodium polytungstate was recycled as described by Six et al.Reference Six, Schultz, Jastrow and Merckx37. Ground POM (1 mm) was analyzed for P concentration as described for soybean tissue.
Data analysis
A general linear model (PROCGLM)Reference Daroub, Ellis and Robertson38 was used to test the long-term impact of management systems on soil properties in main plot soil samples from 1992, 2000 and 2006, where the main effect was management system (only the surface depth was available for main plots). To test the short-term impact of cropping systems (residues or P fertilizer additions) on 2006 Bray-Pi and soybean P, a general linear model was used, with management system and depth being main effects. A third generalized linear model was used to test the impact of cropping system on soybean tissue P. Main effects included cropping system residue, fertilizer application and tissue types. Replicate was included in all models as a random factor. All relevant (P<0.05) one and two-way interactions were included in the analysis for the following dependent variables: soil C, total soil P (Pt), Bray-Pi, soybean tissue biomass, soybean tissue P, POM weight and POM-P to test for significant treatment effects. Dependent variables were verified to be normally and independently distributed. An LSD post-hoc test was used to mean ascertain differences at α = 0.05, e.g., effects of crop residues using subplots A versus B, and P effects using subplots B versus C. Responses of the ORG and ALF systems relative to CON are presented using radial graphs of soil properties (i.e., POM-P, Pi and soil C) and soybean bioassay values (i.e., grain yield and soybean biomass P) where CON values are presented as 100%. The successional cropping system treatment (SUC) was not included in the radial graphs due to insufficient bioassay data.
Results
Total and extractable inorganic soil phosphorus
Total soil phosphorus (Pt) was measured to provide a baseline to evaluate cropping system treatment effects over time, from 1992 to 2006 (Fig. 2). Soil Pt ranged from 210 to 382 mg P kg−1 soil, with an average value of 348 mg kg−1. There were no differences in Pt that could be attributed to differences in long-term management (P=0.68). In addition, Pt did not respond to short-term management, from growing and leaving soybean residues or application of P fertilizer (P=0.98).

Figure 2. Averages are presented (+1 SD) for total P and extractable Bray inorganic phosphorus (Pi) concentration for soil (0–20 cm) collected in 1992, 2000 and 2006 from cropping system treatments in the LTER site, W.K. Kellogg Biological Station in southwest Michigan, USA.
Extractable Bray-Pi declined in all treatments from 1992 levels (Fig. 2), which were anthropogenically high due to historical application of P fertilizer when the LTER farmland was in a conventionally managed corn–soybean rotationReference Daroub, Ellis and Robertson2. Bray-Pi changed over time in soils sampled at 0–20 cm, with decreases in this plant-available P occurring in all long-term cropping system treatments between 1992 and 2000 (P=0.03). Interestingly, subplot treatments with and without P-fertilizer (30 kg P ha−1) showed no short-term effects of fertilizer on Bray-Pi (P=0.80).
Bray-Pi from 2006 soil samples demonstrated marked differences in the amount of available phosphorus among cropping-system treatments at the topsoil depth of 0–20 cm (P=0.0002), with more Bray-Pi in SUC (90% higher) relative to CON (Fig. 2). We note here that concentration values are presented for Bray-Pi, and SUC is associated with lower bulk density than other management systems. There was no effect of cropping system residues or P-fertilizer subtreatments on Pi in samples from depths of 20–50 cm.
Phosphorus balance
Based on a 13-year P mass balance (Table 1) calculated using grain and forage removal of P, and recorded P fertilizer inputs, there was a cumulative net P deficit for all cropping system treatments. The net deficit was highest in ORG (129 kg P ha−1), intermediate in ALF (82 kg P ha−1) and the least in CON (56 kg P ha−1) (Table 1). Decisions about P fertilizer application in the CON and ALF systems are based on Bray-Pi soil test levels, which have been slow to change over time. They have reflected a decline since 1993, but have generally remaining above recommended levels; thus P fertilizer application doses in CON and ALF have remained moderate. Interestingly, Bray-Pi levels in ORG remain similar to CON; this does not reflect calculated P balances (Table 1).
Particulate organic matter
POM was highly responsive to cropping system treatment in our study, and increased over time in ORG, ALF and SUC, but remained nearly constant in the CON treatment (Fig. 3). Cropping system differences in POM concentration were noticeable as early as 1992, and this trend continued through 2006. In soil samples from 1992, 3 years after the experiment was initiated, we observed a 53% increase in POM in the SUC system relative to the field crop systems. In addition, starting in 1992, the ORG and ALF systems had elevated quantities of POM compared to the CON system, and this trend grew more pronounced over time (Fig. 3).

Figure 3. Average (+1 SD) POM and POM-P (0–20 cm) collected in 1992, 2000 and 2006 from cropping system treatments in the LTER site, W.K. Kellogg Biological Station in southwest Michigan, USA. Average presented with standard deviation as bars.
POM-P increased in the CON, ORG and ALF systems from 1992 to 2006, while it decreased from 1992–2000 then increased from 2000 to 2006 in SUC (Fig. 3). Application of fertilizer in 2005 did not influence 2006 POM-P (P=0.14). Quantity of POM has increased over time in ORG and ALF, which explains in part why more soil P is stored in POM for these systems. In 2006, 45 and 90% higher POM-P content was observed in the ORG and ALF systems, respectively, relative to the CON system (Fig. 4). A marked increase in POM-P concentration in 2006 was also observed in ORG and ALF compared to the CON system (Fig. 3). This is a similar pattern to that observed for Bray-Pi (Fig. 2).

Figure 4. Radial graphs for soil properties (POM-P content, soil organic C, inorganic P) and crop bioassay (soybean grain yield and shoot-P content), where: (A) organic (light gray circle) and (B) alfalfa (light gray square) cropping systems are presented as a percentage for each property relative to the conventional treatment (i.e., 100%; dark gray diamond). Measurements from 2006, 0–20 cm depth in the LTER site, W.K. Kellogg Biological Station, southwest Michigan, USA.
Soybean bioassay
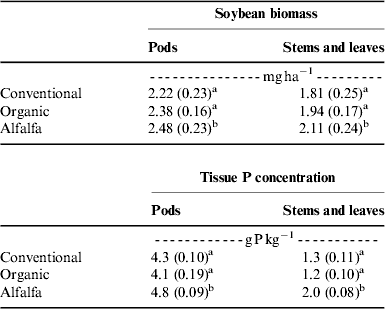
Biomass of soybeans in the subplot bioassay ranged from 4.0 to 4.5 Mg ha−1, and was not influenced by historical management system (P=0.31) or subplot application of P fertilizer (P=0.32) (Table 2). However, soybean grain yield was higher in the ALF system compared to the other systems (Fig. 4; P=0.05). Phosphorus fertilizer treatment did not influence soybean P uptake; whereas cropping system history did influence bioavailability of P, as shown by soybean P uptake. Soybean pod P concentration ranged from 4.1 to 4.8 g P kg−1, stem and leaf concentrations ranged from 1.3 to 2 g P kg−1, and soybean P concentration was highest in ALF (Table 2).
Table 2. Average (±1 SD) biomass and P concentration of soybean tissues harvested in 2006 from soybean grown to assess bioavailability of P in three cropping systems of at the LTER site, W.K. Kellogg Biological Station, southwest Michigan, USA.

Different letters within the same column indicate a significant difference between cropping systems (P≤0.05).
We also examined soybean plant tissue types to illustrate allocation of P within the plant. As expected, P concentration of soybean pods was much higher than in stems and leaves (P<0.001), and P concentration of all tissue types followed the same overall trend in terms of treatment effects. Increased P concentration was the primary contributing factor to a 40% increase in soybean P content in the ALF system relative to CON (Fig. 4). This bioassay result indicated high bioavailability of P associated with a history of ALF, and was consistent with the soil POM-P observed in this system.
System sustainability
Sustainability of alfalfa and organic managed row crops was explored by evaluating five soil and agronomic properties simultaneously in a radial graph, relative to the base system CON with conventionally managed row crops (Fig. 4). Soil C in the 0–20 cm depth increased by ~30% in the ORG system (Fig. 4A) and 45% in the ALF system (Fig. 4B) compared to the CON system where total soil C was 0.85%. Soybean grain yield was increased by 12% when grown following alfalfa (Fig. 4B), but not in the ORG system (Fig. 4A) compared to the CON system. Although organic management of C–S–W was associated with increased Bray-Pi and POM-P compared to CON, the ALF system only had increased POM-P.
Discussion
Temporal phosphorus trends
Declines in Pt have been shown in previous long-term studies of cropping systemsReference Oehl, Oberson, Tagmann, Besson, Dubois, Mäder, Roth and Frossard3, Reference Richards, Bates and Sheppard39. However, Pt in our study remained relatively constant for all treatments from 1992 to 2006, and this was despite a large calculated P deficiency in the agricultural systems (Table 1). Bray-Pi was expected to reflect management more closely than Pt, and indeed we found that Pi declined over time in all systems. We note here that Pt and Pi are presented on a concentration basis, rather than content. This was to avoid the potential for short-term fluctuations in bulk density due to spring tillage just before sampling in some management systems. As noted in the methods section, 2000 bulk density was measured in all LTER treatments and found to be 1.34–1.36 g cm3 for ORG, CON and ALFReference Grandy and Robertson32.
As assessed by a 1-year treatment using subplots of 0 versus 30 kg P fertilizer, Bray-Pi did not reflect recent P fertilizer addition; we note that we only used soil samples from 2006 to test this hypothesis so changes over 1 year were not assessed. Bray-Pi pool measurements over time from the main plots did not indicate P deficiency in ORG, which stands in contrast to the P mass balance approach presented in Table 1. The long-term net P balance was twice as negative for ORG compared to CON, whereas Bray-Pi was similar for these two management systems (Fig. 2). Mäder et al.Reference Mäder, Fliessbach, Dubois, Gunst, Fried and Niggli40 reported on a 21-year-old row crop trial in Central Europe where soluble soil P was not maintained under organic management relative to conventional, although microbial P pool size and flux were enriched under organic management. A 7-year field experiment in the Eastern USA showed no management effects on labile P extracted using water and EDTAReference Green, Dao, Stone, Cavigelli, Baumhardt and Devine41. In contrast, a recent publication on a long-term field study in Nebraska showed marked accumulation of soil Pi; however, this was associated with management systems that included manure amendmentReference Wortman, Galusha, Mason and Francis4.
In our study, POM-P increased under the ORG system relative to the CON system. This increase was in the absence of manure amendments as our organic management system relies on internal nutrient cycling. We note that effects on soil P pools are not directly attributable to any one management practice; as the ORG system involved a number of differences from CON, including no chemical inputs, a legume cover crop, and multiple cultivations for weed control. Overall, data were consistent with reports in the literature that management and some legumes can promote mobilization of sparingly soluble P, and transfer of P to plant-available poolsReference Cavigelli and Thien17, Reference Li, Shen, Zhang, Clairotte, Drevon, Cadre and Hinsinger42. Greater legume presence in the ORG system (a red clover cover crop) may be a factor responsible for enhanced presence of P in Bray inorganic and POM pools relative to the conventional system.
Taken together, our study illustrates potential problems with constructing nutrient balances, and it is thought that these monitoring methods may not necessarily fully reflect transfers among soil nutrient pools or biocycling of P from deep in the soil profileReference Oberson, Friesen, Tiessen, Morel and Stahel43. We found no evidence that cropping system influenced subsoil Bray-Pi; however, longer-term studies or deeper profile measurements may be needed.
Particulate organic matter phosphorus
In agreement with previous authorsReference Alvarez and Alvarez25, Reference Carter44, we found that POM was highly responsive to changes in management (Fig. 3). Although not all aggregate-associated soil C pools increased, combined measures of soil C pools showed consistent gains in ORG, ALF and SUC relative to CON in a comprehensive soil C study by Grandy and Robertson of the LTER main system treatments studied hereReference Grandy and Robertson32. The POM-P pool size followed this sequence: SUC>ALF≥ORG>CON (Fig. 3). This pattern was a trend in 2000 and became more pronounced in 2006. Hernandez-Ramirez et al.Reference Hernandez-Ramirez, Brouder, Smith and Van Scoyoc45 demonstrated that POM and POM-C pools were responsive to management, and rapidly enhanced in a Midwest restored prairie grass system. In a pioneering study of residue decomposition conducted on soil types similar to our site (e.g., well-drained, low soil C Alfisol), POM-P was also shown to be a sensitive indicator of P cyclingReference Salas, Elliott, Westfall, Cole and Six27. Overall, our data were consistent with POM-P providing a reliable, early indicator of residue P pools available for plant uptake.
System sustainability
Soil organic matter and P are key supporting services in agroecosystems, critical to long-term productivity and function. Our results were consistent with long-term management legacy effects, rather than recent fertilizer inputs, as key determinants of soil C, Pi, POM-P, soybean P and grain yield (Fig. 4). The SUC and ORG systems, with no P fertilizer additions, maintained or enhanced soil-P as measured by POM-P. In contrast, recent fertilizer P applications in subplots had no discernible influence on soil P, soybean yield or soybean P uptake. Further, long-term P fertilizer use in the CON system was not associated with enhanced soil P availability, as reflected in POM-P or Bray-Pi pools.
A surprising result was that Pi was maintained under ORG management relative to the CON and ALF systems, despite the lack of external P inputs in ORG (no manure or fertilizer inputs are used in this management system) (Fig. 2). This could be attributed to low harvestable yield (thus low P removal) in the ORG system, to transfer of P among pools, or to transfer from lower in the soil profile to enhance the Pi at the surface. Corn and wheat yields under the ORG system have generally been 30% lower than CON, whereas soybean yields have been comparable across management systems [(Table 1) and see Smith et al., 2007Reference Smith, Menalled and Robertson46].
Taking the long-term view, sustainable production requires that solubilization from P-bearing materials or P inputs from external sources must balance the export of P from crop productsReference Drinkwater and Snapp5. However, it has been shown at other sites that cultivation of soils with no fertilizer inputs can be maintained for a century or more based on cycling of P through organic and inorganic pools; this could in part explain our observationsReference Crews47.
Soil organic C, POM and POM-P were all enhanced in the ORG and ALF systems relative to the CON system, indicating that an overlooked benefit of building soil organic matter may be movement of P from sparingly soluble to crop-available pools. The ALF system had the greatest legume presence among the systems studied. Although Pi was not increased in ALF relative to CON, the bioavailability of P to a soybean crop was markedly higher after ALF (Fig. 4B). Further, ALF was associated with marked gains (70%) in POM-P relative to CON managed C–S–W (Fig. 4B). This may in part be due to recent P fertilization of ALF as part of recommended management (Table 1). Overall, our findings are consistent with previous research by Cavigelli and ThienReference Cavigelli and Thien17 who showed that alfalfa was effective at P uptake, and supported the highest yields in a subsequent sorghum crop relative to other P-solubilizing legumes, suggesting that alfalfa was valuable for facilitating movement of P into the soil organic pool. An earlier study found, in the initial years of the LTER ALF system (before P-fertilizer was applied to ALF), gains in the soil organic P fraction which were attributable to the turnover of the extensive alfalfa root systemReference Daroub, Ellis and Robertson2. The ability of legumes and management practices to enhance bioavailability of phosphorus to a subsequent crop has been demonstrated in previous greenhouse studiesReference Cavigelli and Thien17, Reference Kamh, Abdou, Chude, Wiesler and Horst48, Reference Nuruzzaman, Lambers, Bolland and Veneklaas49, but this is one of the first reports from a field environment.
Long-term sustainability requires attention to mass nutrient flows. Our study that used plots from a 17-year agroecosystem experiment highlights the value of long-term data sets. However, we note the difficulty of a nutrient balance approach to predict plant-available P, particularly for treatments with a high legume presence. This indicates the importance of considering P dynamics as well as P stocksReference Oehl, Oberson, Tagmann, Besson, Dubois, Mäder, Roth and Frossard3, Reference Bundy and Sturgul11, Reference Vitousek, Naylor, Crews, David, Drinkwater, Holland, Johnes, Katzenberger, Martinelli, Matson, Nziguheba, Ojima, Palm, Robertson, Sanchez, Townsend and Zhang34.
Conclusions
Multiple lines of evidence were consistent with historical cropping system management influencing soil C and P pools, and bioavailability of P to a subsequent crop. Soil Pi and POM-P reflected long-term management and legume presence (i.e., cropping system treatment) rather than recent P fertilizer or residue inputs. Overall, POM-P and soybean bioavailability of P was highest in ALF, and similar for ORG and CON. The increase of POM-P and Pi in ORG relative to the CON system was remarkable given the absence of inorganic P fertilizer inputs, and it is plausible that maintenance of P availability was aided by the presence of a red clover cover crop in this system, and transfer of P from deeper in the profile may have assisted as well. These findings are important for developing sustainable nutrient management strategies in organic and reduced-chemical use agricultural systems.
Acknowledgements
This research was partially funded by National Science Foundation (NSF) support for Long-Term Ecological Research at the W.K. Kellogg Biological Station, and a NSF graduate fellowship to the first author. Kitty O'Neil, Lowell Gentry and Samantha Taffner are acknowledged for their help in data collection. The field assistance of Drew Corbin and Joe Simmons was greatly appreciated. Finally, we are grateful for editorial input by Danielle Zoellner-Kelly that improved this manuscript.