Introduction
A common critique of organic farming is that it is very tillage intensive. Frequent and intensive tillage disrupts soil aggregates and macropores, resulting in increased carbon dioxide emissions (Grandy and Robertson, Reference Grandy and Robertson2006; Grandy et al., Reference Grandy, Robertson and Thelen2006), reduced infiltration rates (Franzluebbers, Reference Franzluebbers2002), soil crusting (Awadhwal and Thierstein, Reference Awadhwal and Thierstein1985) and increased risk of erosion (Karlen et al., Reference Karlen, Wollenhaupt, Erbach, Berry, Swan, Eash and Jordahl1994; Triplett and Dick, Reference Triplett and Dick2008). Several long-term studies comparing agricultural management systems have found that organic production may improve soil quality indicators compared with conventional systems (Pimentel et al., Reference Pimentel, Hepperly, Hanson, Douds and Seidel2005; Teasdale et al., Reference Teasdale, Coffman and Mangum2007), but organic practices have sometimes failed to provide soil quality improvements equal to no-till. For example, a long-term study in Michigan found that organically managed soils had a lower soil stability ratio and reduced volume of drainable pores compared with no-till (Bhardwaj et al., Reference Bhardwaj, Jasrotia, Hamilton and Robertson2011).
Although excessive tillage can be detrimental to soil health, tillage performs several important functions on organic farms. Primary tillage incorporates cover crop residues to stimulate decomposition and facilitate mechanical cultivation (Peigné et al., Reference Peigné, Ball, Roger-Estrade and David2007). When left on the soil surface rather than incorporated, organic amendments have a slower rate of decomposition and mineralization, leading to reduced nitrogen (N) availability (Dou et al., Reference Dou, Fox and Toth1994). Without the use of herbicides, tillage is the dominant form of weed control in organic systems (Peigné et al., Reference Peigné, Ball, Roger-Estrade and David2007; Jabbour et al., Reference Jabbour, Zwickle, Gallandt, McPhee, Wilson and Doohan2013; DeDecker et al., Reference DeDecker, Masiunas, Davis and Flint2014). Tillage is also an important tool for disease management because incorporating crop residues can increase the mortality of disease propagules (Bailey and Lazarovits, Reference Bailey and Lazarovits2003).
Despite the important role of tillage for organic production, little information is available on the frequency, intensity or variability in tillage operations utilized on organic farms. The number of tillage operations performed at any one time and across the growing season likely differs between organic farms, as well as between years on any given farm. In certain years, limited time or wet soil conditions may prohibit the ideal number of tillage operations for optimum planting conditions and effective weed control (Posner et al., Reference Posner, Baldock and Hedtcke2008). Tillage practices may also vary by farm due to soil type, crop rotation or farmer preferences with respect to the soil seedbed and acceptable level of weed control.
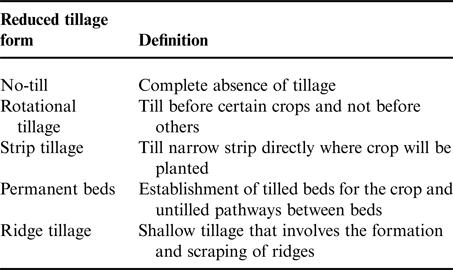
‘Reduced tillage’ (RT) is an ambiguous term (Reicosky, Reference Reicosky2015), but may refer to any decrease in soil disturbance intensity from current tillage levels, and thus may occur through various forms (see Table 1). Current research efforts are striving to adapt RT practices for organic production (Carr, et al., Reference Carr, Anderson, Lawley, Miller and Zwinger2012; Luna et al., Reference Luna, Mitchell and Shrestha2012; Mirsky et al., Reference Mirsky, Ryan, Curran, Teasdale, Maul, Spargo, Moyer, Grantham, Weber, Way and Camargo2012; Brainard et al., Reference Brainard, Haramoto, Williams and Mirsky2013). However, without adequate information regarding farmers’ current tillage practices, as well as their perceptions of the barriers to and benefits of RT adoption, this research may not provide organic farmers with the most relevant and useful information. Research is unlikely to be effective or useful unless it provides information that is locally adapted and not already well known (Llewellyn, Reference Llewellyn2007; Baumgart-Getz et al., Reference Baumgart-Getz, Prokopy and Floress2012). It is not yet known to what extent organic farmers are aware of the potential benefits that may result from RT adoption. For example, soil carbon sequestration is a highly publicized benefit of RT adoption (Phillips et al., Reference Phillips, Blevins, Thomas, Frye and Phillips1980; Triplett and Dick, Reference Triplett and Dick2008). However, common organic practices, such as cover cropping and additions of manures and compost, may already meet many of the same ecological objectives of no-till by building soil organic matter (Fleiβach et al., Reference Fleiβach, Oberholzer, Gunst and Mäder2007). Research and education on other benefits to RT adoption, such as increasing water infiltration and soil water holding capacity, could provide incentives to encourage organic farmer adoption of RT (Malhi and O'Sullivan, Reference Malhi and O'Sullivan1990; Franzluebbers, Reference Franzluebbers2002).
Table 1. Definitions for specified forms of reduced tillage.

Finally, farmer perceptions of the costs and benefits of RT adoption may be influenced by internal characteristics of the farm including farm scale, diversity and soil type, as well as socio-economic factors such as farmer experience and access to information (Saltiel et al., Reference Saltiel, Bauder and Palakovich1994; Knowler and Bradshaw, Reference Knowler and Bradshaw2007; Prokopy et al., Reference Prokopy, Floress, Klotthor-Weinkauf and Baumgart-Getz2008). Smaller farms generally have less capital to invest in RT machinery (Rahm and Huffman, Reference Rahm and Huffman1984; Fuglie, Reference Fuglie1999), such as ridge tiller, strip tiller or high-residue cultivators. The return on investment in RT machinery may be low for diversified farms for which specific RT equipment may only be suitable for a small portion of all crops produced. Similarly, since RT practices may only be beneficial in certain crops, the crop diversity and rotation on a farm may greatly influence interest in RT. For example, the performance of field corn in organic no-till is often more variable than soybean (Mirsky et al., Reference Mirsky, Ryan, Teasdale, Curran, Reberg-Horton, Spargo, Wells, Keene and Moyer2013), and large-seeded vegetable crops like winter squash are more conducive to RT practices compared with small-seeded narrowly spaced vegetables, such as lettuce (Hoyt et al., Reference Hoyt, Monks and Monaco1994).
The overall goals of this study were to document current organic farmer practices and attitudes regarding RT to guide future research and education. Specific study objectives were to: (1) document the type, frequency and intensity of tillage practices currently employed by organic field crop and vegetable farmers in MI, as well as their access to tillage equipment; (2) determine the forms of RT that organic farmers are currently most interested in adopting or learning more about; (3) examine perceptions among organic farmers regarding the barriers to and benefits of RT practices; (4) determine how farm and farmer characteristics influence their expressed interest in RT; (5) identify research priorities for organic RT systems.
Study system: Organic agriculture in Michigan
We conducted a survey of organic farmers in Michigan. Michigan has a diversity of soil, topography and climate due to its unique geographical position within the Great Lakes region (MDARD, 2012). Due in part to proximity to major cities and vegetable and fruit processing plants, Michigan farmers have a diversity of markets. These factors contribute to Michigan being the second most agriculturally diverse US state (MDARD, 2012; USDA-NASS, 2012). Michigan contains 332 organically certified or exempt farms (USDA-NASS, 2014), up 62% from 2005 (Bingen et al., Reference Bingen, Osborne and Reardon2007). In 2012, Michigan had over 58,000 acres of organic production, and organic sales totaled $124 million (USDA-NASS, 2014). Michigan is an important contributor in organic production of fruit, vegetable and field crops. Michigan ranks number 1 in the country in organic production of dry beans and tart cherry, and is a major organic producer of soybean (#3), grain corn (#7) and snap beans (#10) (USDA-NASS, 2012).
Materials and Methods
Survey development
In 2014, we conducted a written survey of field crop and vegetable growers in Michigan who follow organic production guidelines. Because a large portion of small farmers that follow organic guidelines are not certified, we did not make certification a pre-requisite for survey completion. Respondents were asked to verify that they meet the United States Department of Agriculture's (USDA) National Organic Program (NOP) guidelines on the survey waiver form with return of the survey instrument. In fall 2013, survey participants were identified through the NOP. The Local Harvest (http://www.localharvest.org) farm database, a commonly used website to identify sources of local food, was utilized to identify Michigan farmers that were not certified but self-identified as using organic practices. We separated all farm participants into either field crop or vegetable producers by their designated primary crops.
Prior to survey administration, we obtained feedback on the survey instrument through an advisory group of farmers, researchers and extension personnel. Once the survey was developed, it was tested on a subgroup of five organic farmers to check reliability of responses, and feedback was incorporated. This research was conducted in accordance with the Michigan State University Human Research Protection Program and was deemed exempt (IRB# x14-041e).
Survey content
Two forms of the survey instrument were created: one for field crop growers and one for vegetable growers (see Supplemental File for survey example). The survey was organized into three sections, and included questions on demographic and farm characteristics (Section 1); crop-specific questions (Section 2); and attitudes toward RT (Section 3) . Section 2 was the only section that differed between field crop and vegetable producers.
Section 1 included questions on respondent demographics and characteristics of the farm, as well as access to equipment. Demographic questions included information on years farming, years farming organic, percent of the workweek spent farming and percent of family income from farming. Farm characteristics included questions on primary crops, acreage, land tenure, soil texture classes on their farm, organic certification and farm access to equipment. We coded the soil texture classes from 1 to 12 based on the percent clay and percent silt according to the soil texture triangle (see Table S1).
Within Section 2, we gathered specific information from each respondent on the practices employed to produce a specific crop on their farm. Production practices vary considerably by crop, therefore requiring respondents to answer questions targeted to a specific crop helped to control for crop-specific variability. Field crop producers were asked to choose either field corn, soybeans or dry beans. Vegetable producers were asked to select either winter squash or broccoli; but if neither of these crops were grown, they could select tomato (tomato data not shown). We selected these crops because they were widely grown in the region, and because they represented crops known from previous research to be relatively amenable to RT practices (Hoyt et al., Reference Hoyt, Monks and Monaco1994; Mirsky et al., Reference Mirsky, Ryan, Teasdale, Curran, Reberg-Horton, Spargo, Wells, Keene and Moyer2013). Respondents were asked to specify the type and frequency of tillage used for soil preparation and weed cultivation, type and quantity of soil amendments, organic herbicide or pesticide applications, cover crop species, and crop rotation (not all data shown). Surveys included figures illustrating different types of tillage equipment in order to minimize errors associated with equipment terminology (figures obtained from Grubinger, Reference Grubinger1999 and Bowman, Reference Bowman1997).
Section 3 consisted of a series of 0–7 Likert scales asking respondents to rank their interest in adoption of specific RT practices, knowledge of RT practices, as well as their perceptions of potential benefits and barriers to RT adoption. For Likert scales, 0 represented no interest or knowledge of RT, or not a potential benefit or barrier to RT adoption; and 7 represented extremely interested in or knowledgeable about RT adoption, or extremely likely to be a potential barrier or benefit to RT adoption.
Survey implementation
Survey packets were mailed in February 2014 following an initial announcement stating the purpose of the survey (January 2014). Survey packets included an explanatory cover letter, instructions, waiver and pre-paid return envelope. Reminder postcards were mailed 4 weeks after the survey packet, encouraging recipients to complete the survey. To increase survey publicity, we advertized in local Michigan organic agriculture email list-serves. Survey respondents all received $15 compensation following receipt of the survey. Responses were coded, and identifiers were completely separated from the returned and completed surveys to ensure anonymity.
The survey was sent to 337 Michigan farmers (178 field crop producers, and 159 vegetable producers); 12 surveys were returned unopened because they were no longer operating farms. A total of 119 completed surveys were returned. The response rate by region varied between 29 and 38% (Fig. S1).
Survey respondents were classified as being either field crop or vegetable producers if they had >20% of their farm sales from field crops or vegetables. If a respondent had >20% of their operation in both field crops and vegetables, then the respondent was classified based on whether field crops or vegetables made up a larger percentage of their farm sales. Forty percent of respondents were classified as field crop producers, and 40% were classified as vegetable producers. The remaining respondents were classified as other (e.g., fruit, livestock and dairy) and because the primary focus of the survey was to collect data on field crop and vegetable producers, they were excluded. A total of 96 surveys were included in analyses.
Characterization of soil disturbance
To quantify the soil disturbance intensity of the varying tillage practices reported by survey respondents, we calculated cumulative soil tillage intensity rating (STIR) values for the tillage operations reported for the production of a specific crop (USDA-NRCS, 2008). STIR values are numerical values for specific farming operations used to estimate erosion potential in RUSLE2 (Revised Universal Soil Loss Equation Version 2) calculated based on tillage type, depth and percent of soil surface area disturbed. STIR values enable the integration of both tillage frequency and intensity, which is essential to get a more accurate estimate of the volume and area of soil disturbed (Reicosky, Reference Reicosky2015). For each respondent, we multiplied the number of operations for each tillage implement by its specific STIR value (Table S2), and then summed across tillage types to get a cumulative STIR value according to:
Statistical analyses
Survey data were analyzed using SPSS (Windows version 22). Descriptive statistics (means, medians, frequencies) were calculated for demographic data and summaries of tillage practices, as well as Likert responses. Because Likert responses did not follow a normal distribution, we reported the median, and non-parametric tests (Mann–Whitney U test) were used for group comparisons. Spearman correlation coefficients were used to evaluate the relationship between farm and farmer characteristics and Likert responses. All figures were made using the GGPLOT2 package in R (Wickham, Reference Wickham2009).
Factor analysis was used to evaluate the underlying relationships between perceived barriers and benefits to RT adoption. The Kaiser–Meyer–Olkin measure of sampling adequacy and Bartlett's test of sphericity were used to determine whether the original measured data variables could be reduced into a smaller number of factors (Leech et al., Reference Leech, Barrett and Morgan2005; Johnson and Wichern, Reference Johnson and Wichern2007). We used a principal component extraction method, with list-wise deletion of missing data, Varimax rotation and a Kaiser normalization. To determine the appropriate number of factors, we used the following criteria: (1) theoretical meaningfulness of appropriate factors, (2) scree plots, (3) total percent variance explained and (4) eigenvalues that are close to 1 or greater. We selected a 0.6 cutoff for rotated factor loadings onto factor constructs.
Results
Demographics
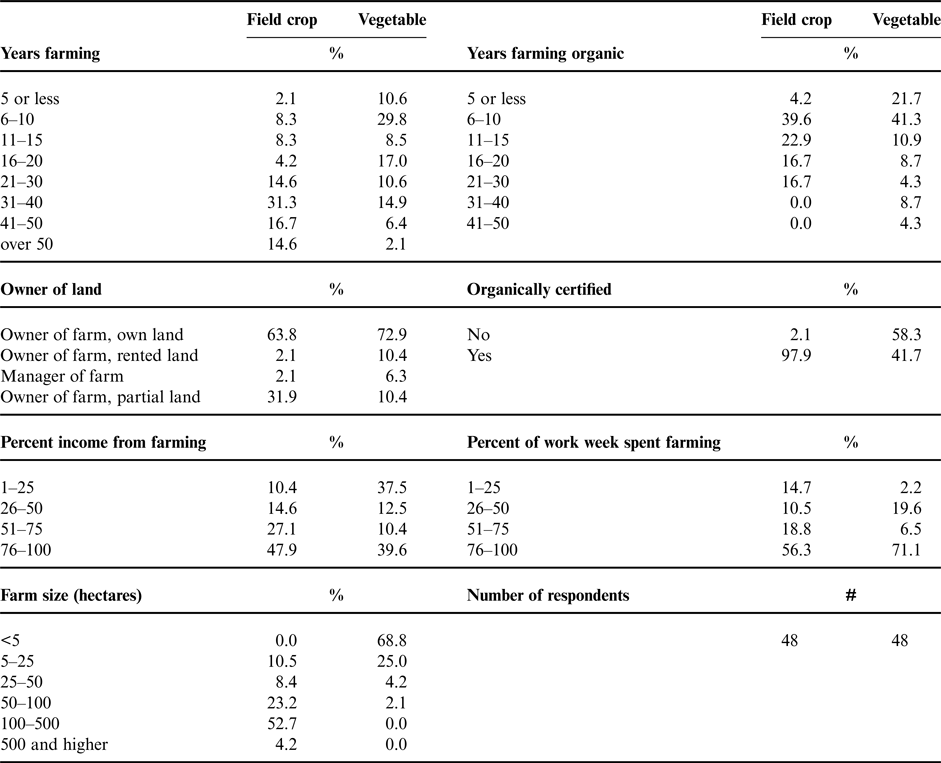
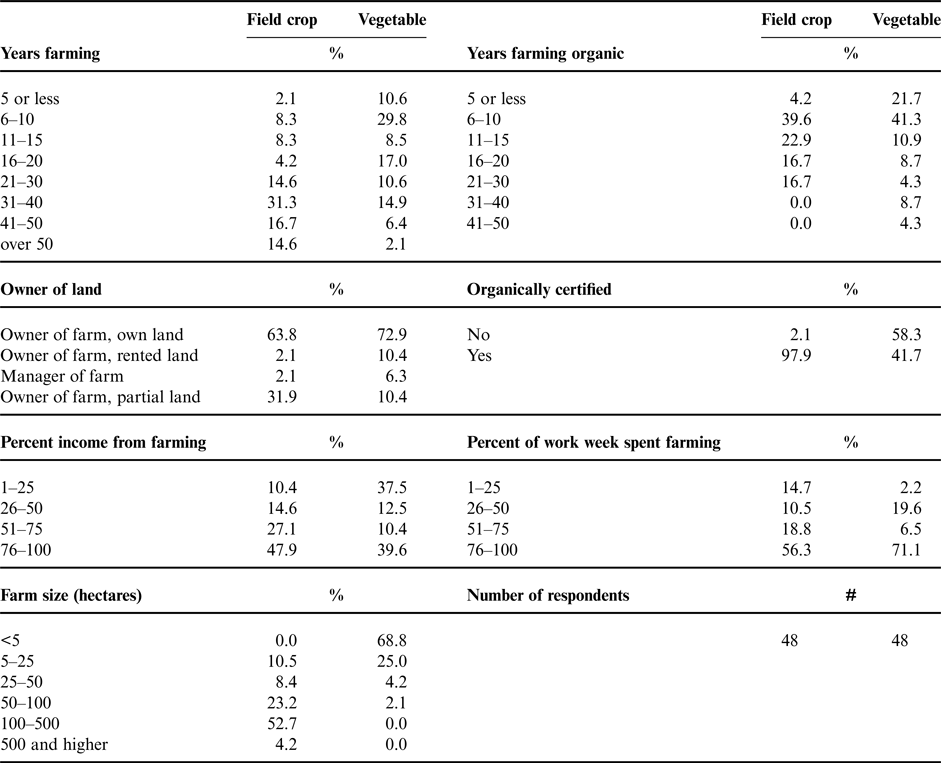
Field crop and vegetable growers differed in several, but not all, demographic and farm characteristics (Table 2). Field crop respondents reported having farmed for a greater total number of years compared with vegetable producers (t = 4.7, P < 0.001), but they differed less in their experience with organic practices (Table 2). Field crop respondents also earned a higher proportion of their income from farming (t = 2.5, P = 0.016). As expected, organic field crop respondents farmed greater land area (t = 6.5, P < 0.001), and were more likely to be organically certified (t = 7.5, P < 0.001). The majority of vegetable farms were under 5 hectares, and only 42% of vegetable farm respondents were organically certified. However, organically certified versus not certified vegetable producers rarely differed in demographics, with the one exception being the percent of total income from farming: certified vegetable producers had a greater percentage of their income from farming compared with non-certified (t = 2.9, P = 0.005). In terms of land ownership and time dedicated to farming, field and vegetable crop growers were similar. The majority of both field crop and vegetable producers owned both their land and farm, as well as spent over 75% of their workweek farming. Field crop farms were largely located in regions of Michigan dominated by soils with a higher clay content, while vegetable farms tended to be located in regions that have sandier soils (Fig. S1).
Table 2. Survey respondent demographics and farm characteristics broken down by farm type.
Tillage and cultivation practices
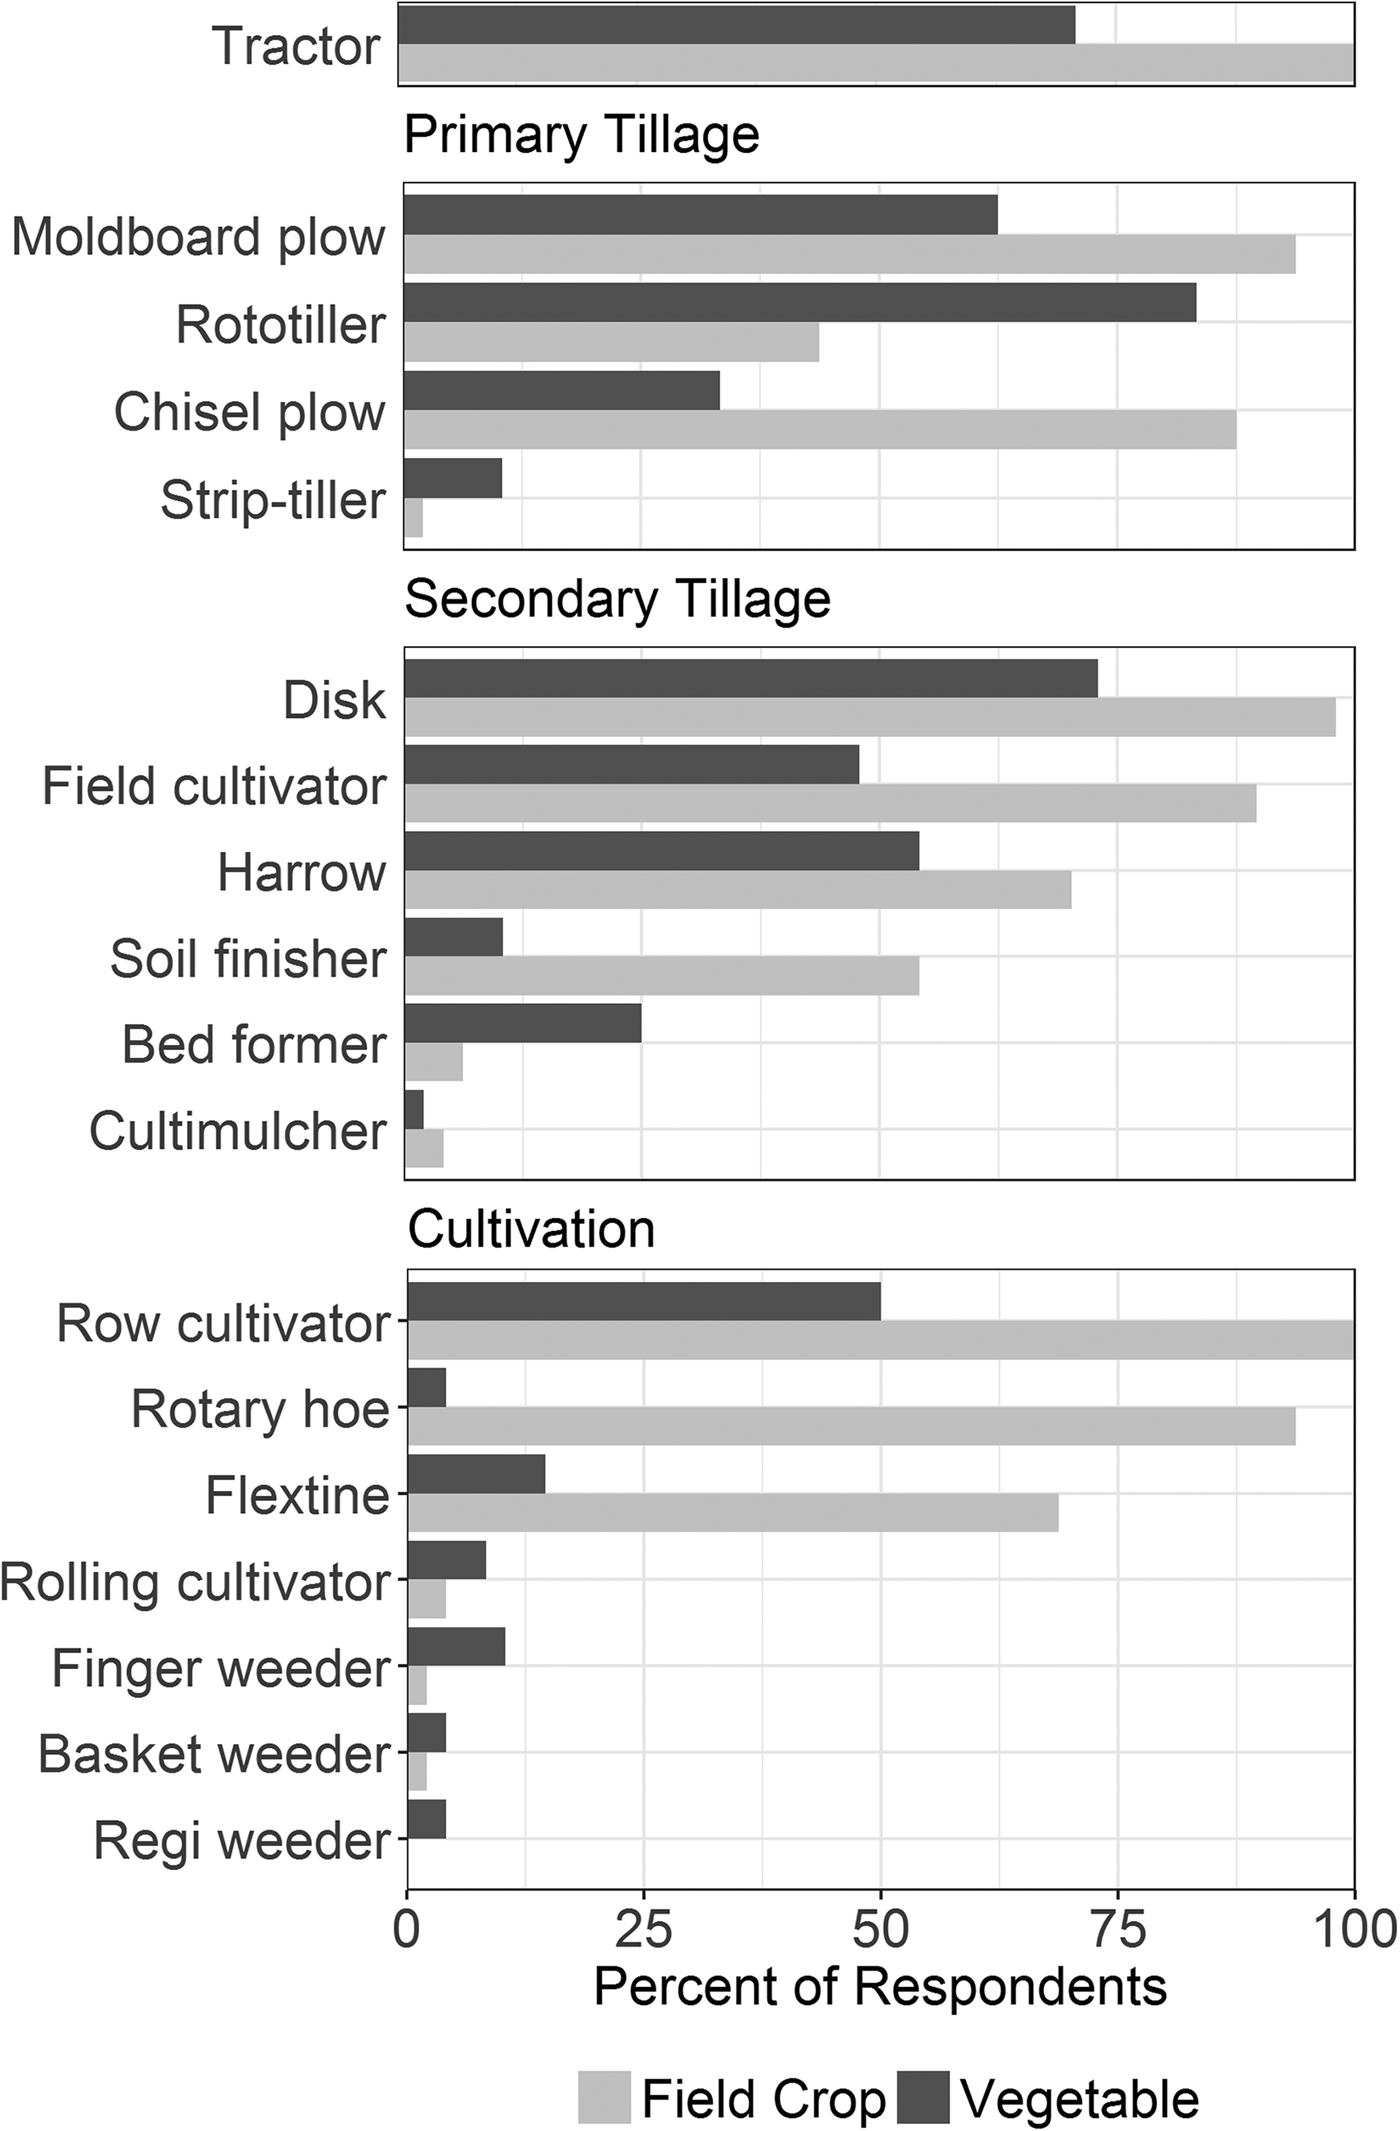
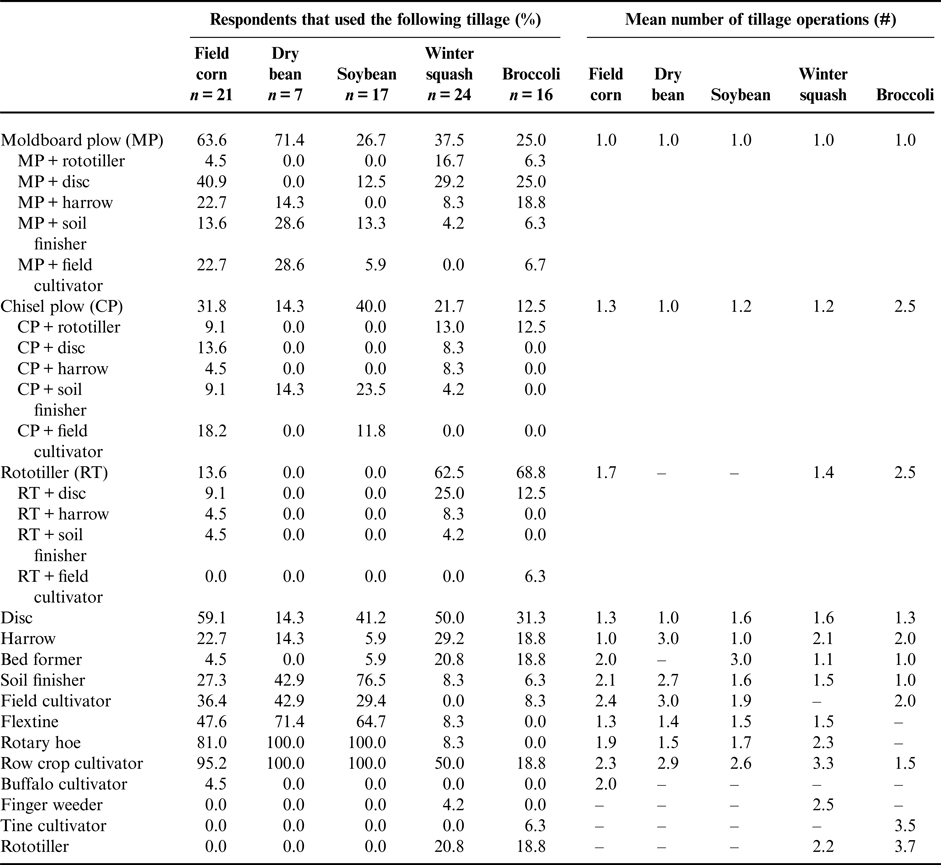
Vegetable and field crop producers varied in the type of tillage equipment they could access (Fig. 1), and tillage practices employed for specific vegetable and field crops generally follow the patterns seen for equipment availability (Table 3). All field crop respondents, but only 71% of vegetable farmers, reported access to a tractor. For both field corn and dry bean, the most commonly used primary tillage implement was the moldboard plow; however, for soybean, the predominant primary tillage implement was the chisel plow (Table 3). In contrast, most vegetable growers relied on a rototiller (88%), with fewer reporting access to a moldboard plow (63%) or chisel plow (33%). Field crop growers had access to several secondary tillage implements, >90% had access to disks and field cultivators, while >50% had access to harrows and soil finishers. Vegetable growers reported lower access to these implements, and they were therefore not commonly utilized. However, some vegetable growers had access to bed formers (25%), which were less common on field crop farms (6%).

Figure 1. Percentage of organic field crop and vegetable producers in Michigan that have access to tillage and cultivation equipment.
Table 3. Tillage and cultivation practices employed for the production of organic field corn, dry bean, soybean, winter squash, and broccoli.

Field crop and vegetable growers also reported key differences in their access to cultivation equipment (Fig. 1). The dominant implements used for weed cultivation within field crops were the row crop cultivator, rotary hoe and flextine cultivator (Table 3). Row crop cultivators target weeds between crop rows and were used extensively (95–100%) in all three field crops. Rotary hoes and flextine cultivators are typically used for ‘blind cultivation’ of small weeds either before crop emergence or up to 2 weeks after emergence. For field crops, rotary hoes were more frequently used (81–100%) than flextine cultivators for this purpose. For broccoli and winter squash production the dominant implements used for cultivation were the row crop cultivator, followed by the rototiller. In contrast to field crops, flextine and rotary hoe cultivation were rarely used in these crops. The Buffalo cultivator™ and finger weeder were rarely used, while the Regiweeder™, basket weeder, and rolling cultivator were never used by survey respondents for any of the field or vegetable crops.
Tillage frequency and intensity
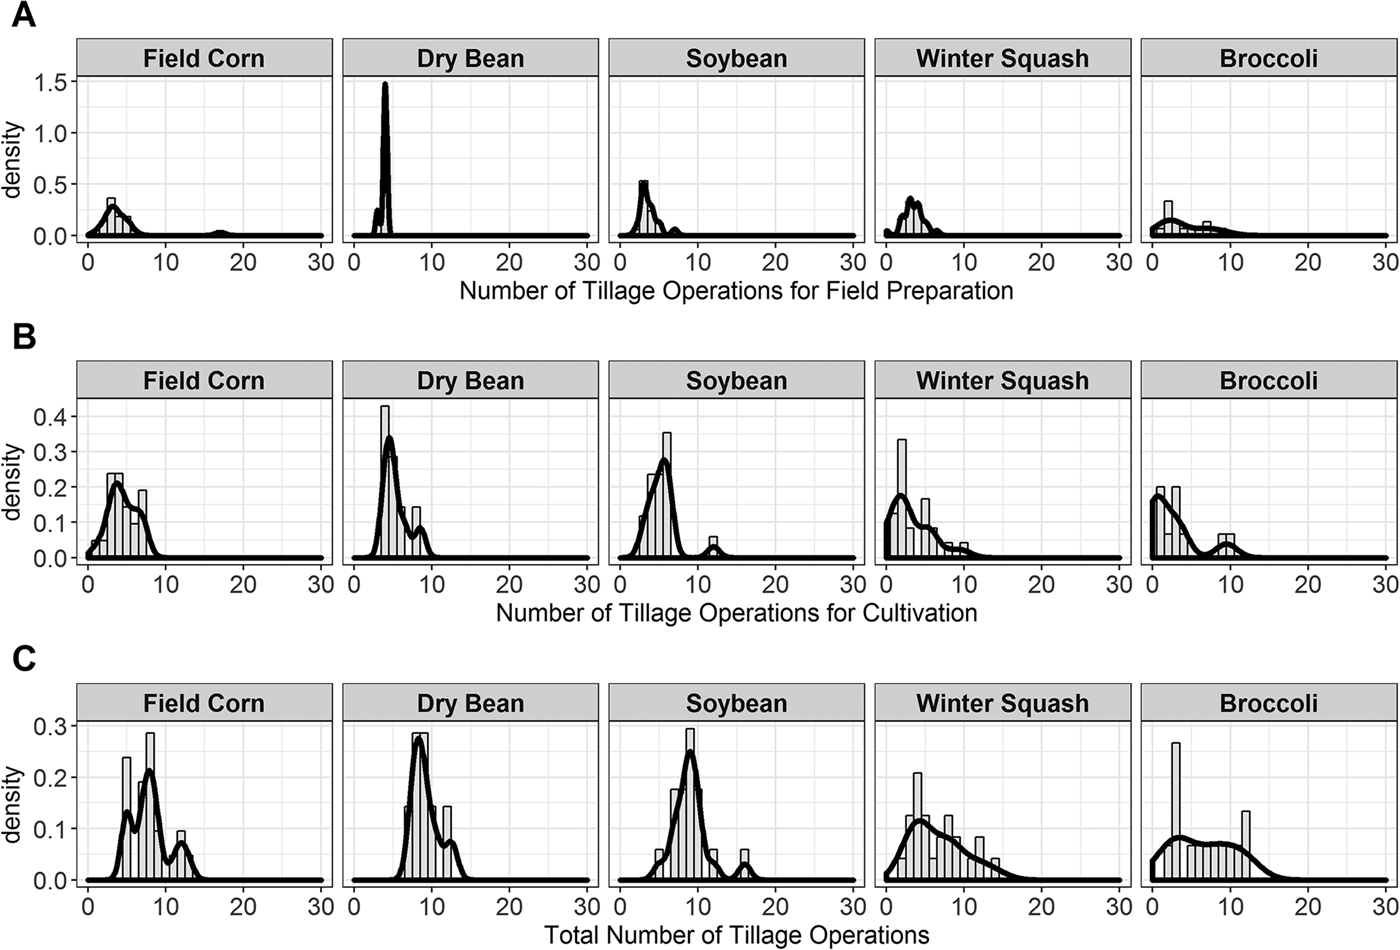
The distribution for the number of tillage operations used for field preparation, cultivation and total tillage operations varied between each of the specified crops (Fig. 2). The mean number of total tillage operations was eight for field corn, and nine for dry beans and soybeans. This included approximately four tillage operations for field preparation, and four to five operations for cultivation. For both broccoli and winter squash, the mean number of total tillage operations was approximately 6.5. Variability in tillage operations was slightly higher for production of broccoli and winter squash (SD = 3–4) compared with the field crops (SD = 2).

Figure 2. Distributions of the number of tillage operations utilized for field preparation (A); cultivation (B); and the cumulative total (C) for field corn, dry bean, soybean, winter squash and broccoli. The Y-axis is the probability density of a given number of tillage operations, and was determined using kernel density estimation.
Mean cumulative STIR values were lower for vegetable crops than field crops, but had higher variance (Fig. 3). Dry bean had the highest cumulative STIR value with a mean of 240, and the lowest variance (SD = 36); followed by field corn (mean = 214, SD = 68) and then soybean (mean = 219, SD = 60). Broccoli and winter squash had the lowest STIR values (120 and 160) but the highest variance (SD = 99). The distribution of cumulative STIR values for both vegetable crops had positive skewness, while STIR values for field crops were less skewed with closer to normal distributions.

Figure 3. Distributions of the cumulative soil tillage intensity rating (STIR) values for tillage utilized in the production of field corn, dry bean, soybean, winter squash and broccoli. The Y-axis is the probability density of a given number of tillage operations, and was determined using kernel density estimation.
Grower interest and knowledge of RT
Organic producers reported a low-to-moderate interest in or knowledge of RT practices (median Likert scale ratings of 4 or less for all forms of RT, Fig. 4). Vegetable farmers reported an overall greater interest in adoption compared with field crop producers (t = 2.35, P = 0.021), and were most interested in adoption of permanent beds (median = 4), followed by strip tillage (3) and rotational tillage (3). We found no difference between certified and non-certified vegetable producers in their expressed interest in RT adoption. Field crop producers were most interested in adopting rotational tillage (2) and strip tillage (2). While the median interest in adoption among field crop farmers was low, there was a substantial portion of respondents that expressed a relatively high interest in RT adoption. For example, 25% of field-crop respondents answered at or above a 5.5 and 4 on the Likert scale for rotational and strip tillage, respectively.

Figure 4. Distribution and median (•) of survey respondents’ expressed interest in adoption (left) and perceived knowledge of specific reduced tillage (RT) practices (right) on a 0–7 Likert scale. The width of violin plots represents the range of responses, and the height at any point represents the proportion of respondents with that score. 0 = No interest/knowledge, 7 = extremely interested/knowledgeable.
Respondents tended to express the greatest knowledge of RT practices for which they also expressed the most interest (Fig. 4). Field crop producers reported the greatest knowledge of rotational tillage (median = 4), followed by no-till (3.5) and strip tillage (3). Vegetable producers reported the greatest knowledge of permanent beds (4), followed by no-till (3), strip tillage (3) and rotational tillage (3).
Perceived barriers and benefits of RT
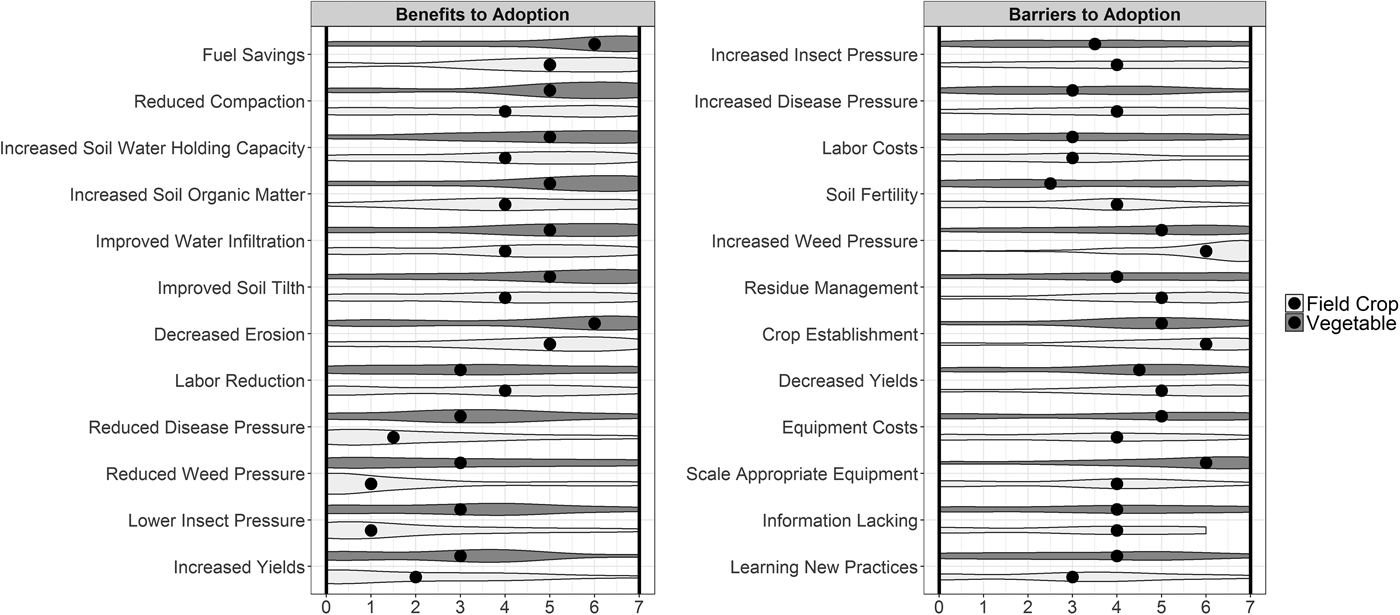
Vegetable and field crop producers had similar perceptions of the benefits of RT adoption, with a few exceptions (Fig. 5). The greatest perceived benefits to adoption were fuel savings and improved soil quality (reduced soil compaction, increased soil organic matter, reduced soil erosion, improved soil tilth, increased soil water infiltration and water holding capacity). Factors that scored low as benefits that would result from RT adoption included increased yields and reduced pest pressure. Vegetable producers were more likely to perceive reduced pests pressure, including reduced weeds (t = 2.4, P = 0.02), insects (t = 2.4, P = 0.02) and disease (t = 2.6, P = 0.01) as a potential benefit from RT adoption compared with field crop producers.
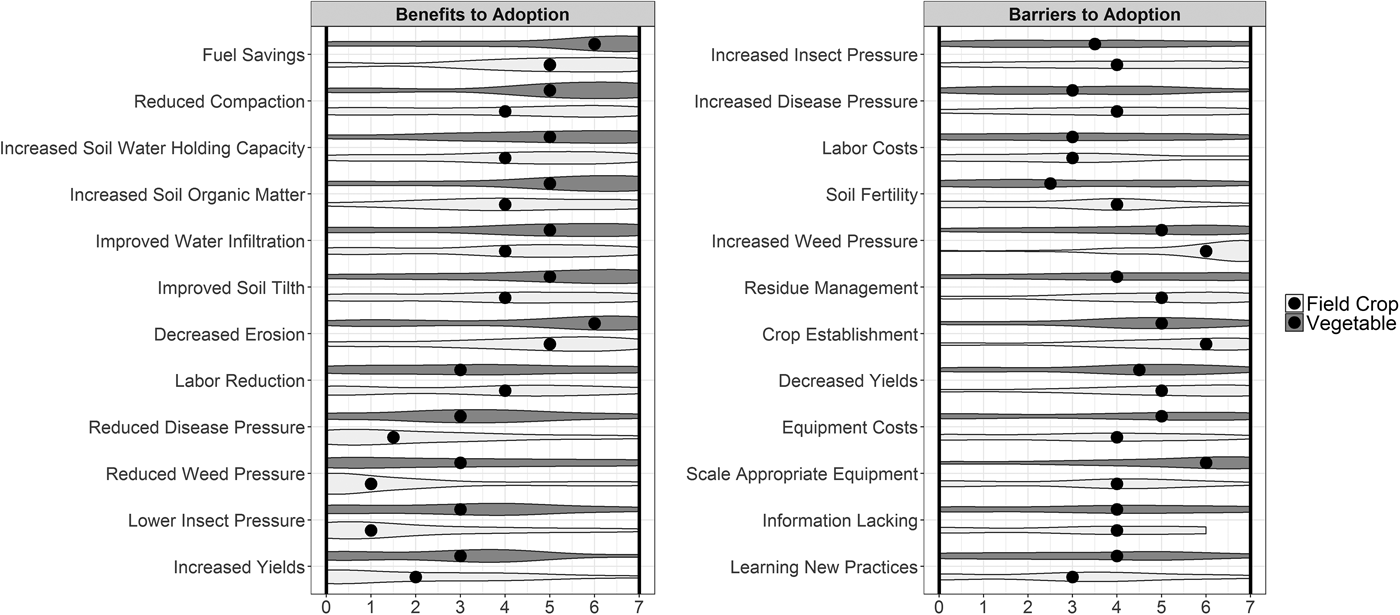
Figure 5. Distribution and median (•) of survey respondents’ perceptions of the benefits (left) and barriers (right) of reduced tillage (RT) adoption on a 0–7 Likert scale. The width of violin plots represents the range of responses, and the height at any point represents the proportion of respondents with that score. 0 = Not a likely benefit/barrier, 7 = extremely likely benefit/barrier.
Perceived barriers to adoption were also similar for vegetable and field crop growers, with a few notable exceptions (Fig. 5). The highest rated barriers to adoption were weed pressure, crop establishment and residue management (median = 5–6). Vegetable producers were more likely to perceive obtaining scale-appropriate equipment as a barrier to RT adoption (median = 6) compared with field crop producers (t = 3.5, P≤0.001). Both groups expressed the cost of new equipment as a significant barrier. Lowest ranked barriers to adoption included labor costs (3), soil fertility (2–4), and learning new practices (3–4).
Factors associated with attitudes toward RT
We found few correlations between interest in RT adoption and farm characteristics or farmer demographics (Table S3). The maximum expressed interest in RT adoption (maximum Likert value for interest in any form of RT) was negatively correlated with years farming (r = −0.26, P = 0.01). The maximum percent clay and percent silt respondents recorded for soil texture classes that exist on their farm were both negatively correlated with interest in adoption (r = −0.25, P < 0.017). Greater reported knowledge of RT practices was positively correlated with interest in adopting no-till (r = 0.27, P < 0.01), rotational tillage (r = 0.24, P = 0.02), strip tillage (r = 0.39, P < 0.001) and permanent beds (r = 0.46, P < 0.001).
Not surprisingly, farmer perceptions of RT barriers and benefits were often related to interest in adoption. All perceived benefits of RT were positively correlated with the maximum expressed interest in adoption (0.44 < r < 0.59, P < 0.001). The perceived barriers to RT adoption that were negatively correlated with interest in adoption were weeds (r = −0.36, P < 0.001), insects (r = −0.24, P < 0.03), soil fertility (r = 0.22, P = 0.03), residue management (r = −0.22, P = 0.04), yields (r = −0.22, P < 0.04), and a lack of information (r = 0.26, P = 0.01).
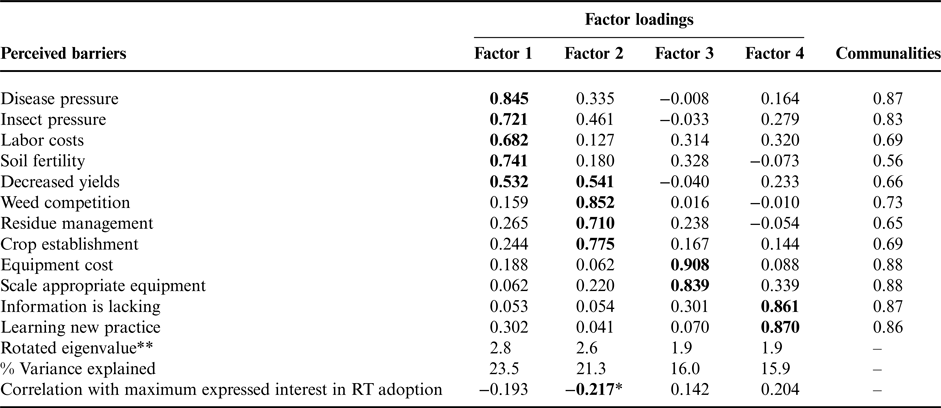
Through a factor analysis, we reduced the perceived barriers to adoption of RT practices into four factors (Table 4). The four factors generated from this model explained 77% of the total variance. The factor loading cutoff we used was 0.6, and each variable clearly loaded onto one of the four factors, with the one exception being yield, which had 0.53 onto factor 1 and 0.54 onto factor 2. The communalities were mostly all above 0.6 (except for soil fertility at 0.56), which indicates that the model explained a significant amount of variation for each individual variable. Factor 1 consisted of disease and insect pressure, labor costs and soil fertility. Factor 2 consisted of weed competition, residue management and crop establishment. Factor 3 consisted of equipment costs and obtaining scale-appropriate equipment. Factor 4 consisted of information lacking and challenges with learning a new practice. Factor 2 was negatively correlated with maximum expressed interest in RT adoption (r = −0.22, P < 0.05).
Table 4. Results from a factor analysis of the perceived barriers to adoption of RT, as well as correlation with maximum expressed interest in RT adoption.

RT, reduced tillage. Loading values in bold indicate which factor the perceived barrier was most associated with.
*Correlation is significant at the 0.05 level (two-tailed).
**Eigenvalues obtained after Varimax rotation.
Discussion
There has been much interest recently in the need to better frame our research and extension to better reflect farmers’ perceptions and attitudes (Ahnström et al., Reference Ahnström, Höckert, Bergeå, Francis, Skelton and Hallgren2009; Wilson et al., Reference Wilson, Hooker, Tucker, LeJeune and Doohan2009; Jabbour et al., Reference Jabbour, Zwickle, Gallandt, McPhee, Wilson and Doohan2013; O'Connell et al., Reference O'Connell, Grossman, Hoyt, Shi, Bowen, Marticorena, Fager and Creamer2015). To that end, we examined Michigan organic farmers’ interest in RT adoption, as well as their perceptions of the barriers and benefits to RT implementation. While survey respondents generally reported a low-to-moderate interest in adoption of RT practices (Fig. 4), particularly field crop producers, there were some forms of RT in which a substantial portion of the respondents expressed a relatively high interest in adoption (e.g., rotational tillage, strip tillage and permanent beds).
Current level of tillage on organic farms
Organic farmers are currently using a wide range of tillage frequencies and intensities (Figs. 2 and 3, Table 3). This implies that some farmers are already employing RT compared with the general population. ‘RT’ may look very different on organic farms compared with conventional systems, and may be thought of as any frequency or intensity below some current threshold (e.g., 1 standard deviation below the mean STIR value). Unfortunately, we have little information to compare farms that vary in tillage frequency and intensity (STIR-adjusted tillage intensity; X-axis, Fig. 3) based on weed control, crop establishment and crop yields.
Research has shown that despite heavy reliance on tillage, organic farming can increase soil organic matter (Teasdale et al., Reference Teasdale, Coffman and Mangum2007), and improve aggregate structure (Pulleman et al., Reference Pulleman, Jongmans, Marinissen and Bouma2003; Papadopoulos et al., Reference Papadopoulos, Bird, Whitmore and Mooney2009; Bhardwaj et al., Reference Bhardwaj, Jasrotia, Hamilton and Robertson2011), presumably due to higher inputs and quality of organic matter such as compost, manures and cover crops. However, it is not yet clear to what extent routine tillage on organic farms affects other characteristics of soil quality, such as soil crusting and infiltration. More research is needed to determine the effect that the routine frequency and intensity of tillage (including the volume, depth and type of soil disturbance; Reicosky, Reference Reicosky2015) used on organic farms has on soil quality characteristics, particularly characteristics that will be important for climate change adaptation, like water infiltration and water holding capacity. Utilizing a soil disturbance intensity index, such as STIR values, would facilitate future comparisons of tillage practices and their effects on soil quality across farms (Karlen et al., Reference Karlen, Tomer, Neppel and Cambardella2008).
Factors influencing interest in adoption of RT
Farmers’ decisions on management and technology adoption rely heavily on their own experiences and prior held beliefs (Wilson et al., Reference Wilson, Hooker, Tucker, LeJeune and Doohan2009; Jabbour, et al., Reference Jabbour, Zwickle, Gallandt, McPhee, Wilson and Doohan2013). More experienced farmers expressed lower interest in RT adoption (Table S3), perhaps this is due to their previous experiences suggesting their current level of tillage is required to maintain weed control and crop productivity. For example, missing a cultivation window due to wet soil conditions may have resulted in negative experiences with tillage reduction. In contrast, farmers that expressed greater knowledge of RT practices also expressed greater interest in adoption. This suggests that either those interested in RT are more likely to seek out information, or that farmers’ interest in RT increases with greater exposure to information.
As expected, respondents who gave more favorable ratings to potential benefits resulting from RT were more likely to be interested in RT adoption. Why were some farmers more likely to perceive benefits from RT adoption than others? Some farmers may not be aware of potential benefits of RT, and may benefit from greater access to information. Alternatively, respondents may perceive that agronomic benefits associated with RT would not be realized on their farm due to their crop rotation, soil type and climate. For example, heavier soils that have poor drainage and take longer to warm in the spring experience additional problems with RT (Van Doren et al., Reference Van Doren, Triplett and Henry1975; Peigné et al., Reference Peigné, Ball, Roger-Estrade and David2007). This may explain why farmers that reported soil types with a greater percent silt and clay were less interested in RT adoption. Correlations between soil type and interest in adoption may also be driven by cropping system; since field crops were associated with heavier soils, we cannot rule out the possibility that this correlation reflects lower interest among field crop growers.
Survey respondents reported weed management as one of the most critical perceived barriers to RT adoption (Fig. 5), which is consistent with research demonstrating higher weed management costs or yield losses due to weeds in RT systems (Delate et al., Reference Delate, Cwach and Chase2011; Teasdale et al., Reference Teasdale, Mirsky, Spargo, Cavigelli and Maul2012). Therefore, RT research that does not account for changes in weed management costs associated with RT may be of limited relevance to organic farmers. Our results also demonstrate that very few growers have access to weed management tools that may facilitate weed management under RT (e.g., rolling cultivators and high-residue cultivators). Research and extension efforts aimed at increasing awareness of these tools and their optimal use, along with more effective cultural weed management strategies, may expand growers’ ability to manage weeds under RT.
Through factor analysis, we found an underlying relationship between farmers’ perceptions of residue management, crop establishment and weeds as barriers to RT adoption, and this latent factor was negatively correlated with interest in adoption (Table 4). This is consistent with researchers’ perceptions of one approach to successful organic RT: developing high-residue mulch systems that suppress weeds without suppressing the crop (Carr et al., Reference Carr, Anderson, Lawley, Miller and Zwinger2012; Mirsky et al., Reference Mirsky, Ryan, Curran, Teasdale, Maul, Spargo, Moyer, Grantham, Weber, Way and Camargo2012; Brainard et al., Reference Brainard, Haramoto, Williams and Mirsky2013). Although cover crop residues can effectively suppress weeds, they can also negatively affect crop establishment by interfering with planting equipment, immobilizing N, releasing allelopathic compounds, decreasing soil–seed contact and inhibiting germination (Mirsky et al., Reference Mirsky, Ryan, Teasdale, Curran, Reberg-Horton, Spargo, Wells, Keene and Moyer2013; Price and Norsworthy, Reference Price and Norsworthy2013). Cover crop biomass production is highly variable from year to year, and in years when cover crop biomass is low, there may not be sufficient residue for weed suppression. Low levels of residue used as a mulch can stimulate weed emergence (Mohler and Teasdale, Reference Mohler and Teasdale1993). High levels of residue may create challenges for mechanical cultivation, which is likely to be necessary for control of escaped weeds.
Availability of small-scale, affordable equipment was reported as a major constraint to adoption of RT among vegetable growers (Fig. 5). Vegetable farms typically grow a diversity of crops but have limited access to equipment (Fig. 1), thus the equipment they do purchase must be versatile. Approximately 30% of vegetable respondents did not have access to a tractor, and likely rely on walk-behind rototillers. Many small-seeded vegetable crops, such as carrots, require the fine seedbed provided by rototilling. If an organic vegetable farmer invested in any one piece of equipment, the rototiller is valuable because it can be used for both large- and small-seeded crops. A walk-behind rototiller can be used to implement RT practices, such as strip tillage (Krupnik et al., Reference Krupnik, Santos Valle, McDonald, Justice, Hossain and Gathala2013) and permanent beds (Morrison and Gerik, Reference Morrison and Gerik1983) on smaller farms that do not have a tractor, thereby providing flexibility for adapting RT to diverse vegetable systems while using existing farm equipment. Certainly, relatively strong grower interest in permanent bed systems among vegetable growers (Fig. 4) reflects their perceived appropriateness.
Among organic field crop growers, large-scale approaches to RT may be feasible. For example, >88% of field crop producers (compared with only 33% of vegetable producers) reported having access to a chisel plow, and all field crop producers had access to a tractor. Large-scale strip tillage equipment is readily available because of its extensive use on conventional field crop farms. Such equipment may also be appropriate for organic production of field crops with minor modifications. This may explain greater interest among organic field crop producers in strip tillage compared with other forms of RT other than rotational tillage (Fig. 4).
Conclusions and Implications for Future Research
Our survey results show that many organic farmers are already aware of the benefits of RT adoption and therefore efforts aimed at alleviating the barriers to adoption—rather than reiterating RT benefits—are more likely to gain traction. With that in mind, potentially fruitful avenues of future research might include identification of low-cost adaptable RT equipment for organic producers, and identification of crop-specific levels of tillage that balance weed control and soil quality objectives, while maintaining crop yield and profitability. For example, research aimed at improving the efficiency of mechanical weed control (e.g., more efficient cultivation tools that reduce the frequency or intensity requirements) or replacing tillage and cultivation with non-mechanical forms of weed management, such as cover cropping and selection of competitive crop varieties, may help organic growers build long-term soil health, while avoiding short-term crop interference.
Another useful approach to reducing tillage on organic farms may be to encourage more incremental reductions in the total frequency and intensity of tillage operations (shifting the distribution to the left on the X-axes in Figs. 2 and 3). Our results demonstrate that growers currently vary in the number of tillage passes, even within a specific crop. Therefore, efforts to help farmers on the top-end of the distribution reduce their tillage passes toward the median would likely bring them benefits at relatively low cost. Information on optimal tools, timing and intensity of tillage for specific crops may help growers limit excessive or inefficient tillage operations.
Finally, we believe that to address grower needs, more information is needed on the relative impacts of different forms of tillage on soil characteristics and weed control. Using an indicator to integrate tillage frequency and intensity, such as STIR values, may assist in quantifying soil disturbance across farms, and help growers compare the impacts of different tillage implements. Similarly, the horsepower requirements and fuel costs associated with different tillage operations may help growers better understand the economic and environmental implications of their tillage practices.
Acknowledgements
This project was supported by funding from two Michigan State University awards: the University Distinguished Fellowship and Ecological Food and Farming Specialization Fellowship. We greatly appreciate all of the Michigan organic farmers that took the time to complete and return our survey. We are also grateful to Vicki Morrone, Erin Haramoto, Jeremy Moghtader, Dan Filius, Vicki Zilke, and the organic farmer participants in our pilot survey, for their insightful comments and feedback in developing the survey instrument. Finally, we thank John Kerr, Mathieu Ngouajio, Alexandra Kravchenko, and G. Phil Robertson for guidance, as well as three anonymous reviewers for comments on the manuscript.
Supplementary material
The supplementary material for this article can be found at https://doi.org/10.1017/S1742170517000357.


