


Introduction
Achieving sustainable agronomic production requires balancing nutrient inputs to the system with outputs harvested from, generated by or transported out of the system. Continued overproduction can deplete soil and water resources. Similarly, development of contaminants and waste in excess of what the system metabolizes can result in pollution of the immediate agricultural system and downstream environments.
Current agricultural production systems have developed in response to social, political, economic, environmental and technological drivers that operate both internal and external to agricultureReference Hanson and Franzluebbers1. These drivers influence management choices throughout the production cycle, including the types of crops and animals grown, the production methods used, harvesting, processing and marketing.
The predominant agricultural systems in the US have expanded to capture ‘economies of scale’Reference Halloran and Archer2. These large-scale production systems, such as intensive monocrop or confinement animal production systems, have also become highly specializedReference Hendrickson, Sassenrath, Archer, Hanson and Halloran3, improving operational efficiency and meeting consumer demands for consistent, inexpensive products. Processing and distribution networks, along with vertical integration of agricultural production systems, have resulted in geographic specializationReference Sassenrath, Wiener, Hendrickson, Schneider, Archer and Schnepf4. Far from benefiting farmers, these technological advances have intensified production and the complexity of the US farming system, increased our dependence on soil and water resources and fossil fuels, entrapped farmers in a technology treadmill, and, in some cases, decreased control by producersReference Sassenrath, Heilman, Luschei, Bennett, Fitzgerald, Klesius, Tracy and Williford5. They have also resulted in local and regional water quality problems, ranging in scale from polluted stock ponds and small streams to the hypoxia in the northern Gulf of Mexico.
The agricultural systems in Central Eastern Europe have also experienced profound changes with the abrupt end of the planned economy era in the early 1990sReference Grzebisz, Gaj, Sassenrath and Halloran6. With the end of subsidized agricultural inputs, fertilizer use decreased, negatively impacting crop yieldReference Kelch and Osborne7. Animal production was also impacted with the collapse of many state-owned meat processors and their replacement with small, privately owned companiesReference Borys8. To remain profitable, meat production in Poland has increasingly moved toward large-scale confinement animal systems instead of pastured animal production systemsReference Balcere, Noren, Holmgren, Hrytsyshyn, Lobanov, Marttila, Merisaar, Rimavicius, Roggenbuck and Skorupski9. The regionalization and specialization of industrial agriculture increased negative environmental impact in other countriesReference Granstedt10, raising concerns that similar impact is or will be occurring in Poland. However, while traditional Polish agricultural systems that integrated animal and crop production have the potential to improve the environmental impact of agriculture, they may limit the nutrients needed for adequate crop productionReference Kopiński, Tujaka and Igras11. Some ongoing assessment that could reveal the emerging environmental impact is clearly desirable and is the intent of many current environmental policies.
Nitrogen is a key component of agricultural production systems—both in its use as a fertilizer for crop production and as a byproduct of livestock systems. Sustainable agronomic production depends on the environmentally beneficial management of nitrogen within the system. Nitrogen fertilizer is often used excessively to ensure high crop yield, particularly when the anticipated returns are high due to higher commodity prices12. Application of N in excess of what can be used by the plants results in negative economic consequences for the producer and potential contamination of the environment. Animal production systems that confine many animals to small areas create regions of concentrated nitrogenous waste, with potential impairment of local and downstream soil and water qualities.
Increased problems with N in the environment have led to implementation of controls in Europe and America. One common method of evaluating nutrient release from agricultural operations is calculation of the nutrient balance as proposed by the Organization for Economic Co-operation and Development (OECD)13. Nutrient balance is defined as the difference between the inputs to the system and the outputs harvested from the system for the total agricultural land area in production13. The nutrient balance is intended to be an indicator of the amount of excess nutrient applied to the system that is not captured in harvested product, and hence is a potential pollutant from the systemReference Parris14. Element and nutrient balances have become widely adopted tools to quantify the impact of agriculture on the environment, and establish a monetary value for natural resources and improvements in management practices. These measures and valuation are expected to be important components in the effort to transition agriculture toward sustainability, but wide differences exist in their construction and application. These differences raise the question as to whether such balance-derived indices actually reveal net year to year changes in the state of the environment on local scales, or are useful in discerning the impact of policy-induced changes in agricultural management.
At the national level, element balances have been implemented in the European community as tools to meet environmental targets for nutrient management in agriculture, either on a voluntary or a mandatory basis. Several EU directives, policies and measures provide incentives to agriculture to decrease its burden on the environment15, 16. The US Department of Agriculture Natural Resource Conservation Service (USDA-NRCS) conservation programs, tied with direct payments to farmers, are developed to enhance adoption of environmentally friendly management practices17. The challenge is to reduce the nutrient imbalance as much as possible by reducing excessive production of nutrients within the system and improving nutrient use efficiency on-farm through better crop production and management practicesReference Gaj and Grzebisz18, Reference Grzebisz and Gaj19, Reference Gaj20. Attention must also be paid to the varied temporal and spatial scales of nutrient loss and their impact on the environmentReference Kopiński, Tujaka and Igras11. An additional challenge is to address unique regional and national goals for both production and environmental quality using common indices.
To balance the agricultural system, improving production and profitability while limiting negative impact on the environment, we need to fully understand all the factors contributing to nitrogen utilization and the nitrogen cycle within the agricultural production system. Here, we examine agricultural production systems in Poland and Mississippi, USA as case studies to explore the drivers impacting management practices. The opportunity to examine these very divergent agricultural systems arose through a collaborative research program supported monetarily through the OECD. The goal of this research is to determine the impact of management practices, changes in crop and animal systems, and integration of production on nutrient balances. We use nitrogen balance as a measure of the sustainability of these production systems, since N has been identified as a key element in assessing the impact of agriculture on the environmentReference Parris14. The data and analysis reported indicate the utility of gross annual nutrient budgets in identifying trends in nutrient balances for large areas. The data raise some questions, however, as to whether spatial scale issues and annual variability in crop productivity levels are obscuring changes in nutrient balance arising from altered production practices.
Materials and Methods
Assessment of agriculture
Data on crop and animal production, crop area planted and harvested, total and per hectare yield, and price received by farmers were calculated from farmers’ records as reported by the National Agricultural Statistics Service (NASS)21 and the Food and Agriculture Organization Statistics (FAOSTAT)22. Livestock numbers were based on number of animals in each size category reported by NASS21 for Mississippi and GlownyReference Glowny23 and FAOSTAT22 for Poland. Slaughter records were used to estimate livestock numbers for those animals having more than one production cycle in a year, such as poultry and swine. Agricultural prices in dollars were used to standardize the comparison between countries.
Weather information from primary production regions of each area was used for information on weather during the study period. The Delta Research and Extension Center maintains a network of weather stations throughout the state24. The primary weather station at Stoneville, Mississippi has been collecting weather information on precipitation and rainfall since 1930. Because of the completeness and accuracy of the weather information, this site was used for weather information from Mississippi. Weather information from Poland is collected at nine locations, but only two stations are currently publically available25, Reference Haylock, Hofstra, Klein Tank, Klok, Jones and New26. The weather station at Siedlce, Poland, was selected to summarize the weather information as it was closest to the principal agricultural regions of Poland. Forty-five years (1966–2010) of complete weather data are publically available from the weather station at Siedlce, Poland25. For comparison, we used the same time period of weather data from Stoneville, Mississippi. Cumulative growing degree days (GDDs) are a method of estimating crop production potential. Annual cumulative GDDs above 10 °C were calculated to compare annual temperature between the two regions over the course of the study period. Although it is recognized that a common GDD is not appropriate to crops in both climates, a single GDD definition was used for consistency in comparing the two regions. Total annual rainfall was calculated from reported rainfall values at the two stations.
Mississippi has more than 12 M ha of land, the majority of which (61%) is forested27. Pasture and cropland account for an additional 27% (3.3 M ha) of the land. As with other US states, recreational and hobby farms account for a portion of the farmland; these were excluded from this study. The average individual production farm size in Mississippi is more than 110 ha. Large-scale production agriculture predominates, with the majority of tilled hectares planted in soybeans, corn and cotton. Crop production in Mississippi is primarily concentrated in the Mississippi Valley alluvial flood plain, commonly called the Delta, located in the northwestern portion of the state27. Most livestock production, particularly confinement poultry production, occurs in the central and southern regions of the state28.
In Mississippi, cereals comprise mainly wheat (winter), rice, corn and sorghum. Oil crops include predominantly soybeans, but also peanuts (ground nuts) and cotton seed; root crops are sweet potatoes. Harvested fodder includes maize and sorghum harvested for silage; hay is also grown, but total yield and hectarage may be underreported. Cotton is grown primarily for lint production. Vegetables and melons, fruits (blueberries) and nuts (pecans) are also grown, but on a very small portion of the land.
Nearly 60% of the land area in Poland is devoted to crop and animal production, and arable land and grassland account for 18 M ha. Most farms are small and semi-subsistence farms of 1–5 ha total land area, especially in the eastern part of the country, as Poland was never fully collectivized prior to 1990Reference Krasowicz, Górski, Budzyńska, Kopiński, Igras and Pastuszak M29. These farms use a minimum of purchased farm inputs (e.g., pesticides, energy and water), and farm income is insufficient to support modernization of the farming enterprise. The highest area of arable land in Poland is sown in cereals, potatoes, rapeseed and fodder.
For Poland, cereals include spring and winter wheat, rye, barley, triticale, oats, maize, and minor hectarage of other cereals such as buckwheat and millet. Oil crops are predominantly rapeseed and minor areas planted to other oil crops such as sunflower seed and hemp seed. Dried pulses and beans are also planted. Potatoes are the predominant root crop. Vegetables and citrus fruits are also reported. Vegetable and other root crop production includes cabbages and brassicas, carrots, turnips, tomatoes, beans (green, string and dry), peas (green and dry), cucumbers and gherkins, onions, leeks and other alliaceous vegetables, asparagus, lettuce and chicory, pumpkins, squash and gourd. Fruit and nuts produced in Poland include strawberries, apples, cherries, currant, plums and sloes, lupines, raspberries, pears, blueberries, gooseberries, apricots, peaches, berries, hazelnuts and walnuts. Industrial crops include primarily sugar beet, and minor areas of flax and hemp fiber and tow, tobacco, chicory, linseed and hops. Beets are harvested both for sugar production and for fodder. Green fodder is primarily clover and maize cut for silage. Permanent pasture and the estimate of yield from permanent pasture are reported, with the assumption that 100% of the permanent pasture is consumed30. Crop residue includes head, leaves and stems, straw, as well as other crop residues.
Development of nitrogen budgets
A methodology for calculating soil nutrient balances has been developed by the OECD13 and adopted by Eurostat30. The method was used to calculate gross annual soil nitrogen (N) balance per hectare for Poland and Mississippi for the years 1998–2008. The gross annual nitrogen balance is defined as the difference between total N inputs less total N outputs for the system, for the total agricultural area (excluding forested and non-agricultural lands).
Total N inputs included: fertilizers, both inorganic (usually purchased) and organic, excluding animal manure; livestock manure; biological N fixation; atmospheric deposition of N compounds; and other inputs (seed, planting material, etc.). Inorganic fertilizer amounts were obtained from FAOSTAT22 and IFADATA31 for Poland, and from NASS21 for Mississippi. Information on total crop harvested biomass was obtained from FAOSTAT22, GlownyReference Glowny23, and NASS21 databases (multiple years). Animal production records were used to estimate manure production as outlined in the OECD procedure13. Livestock records were obtained from GlownyReference Glowny23 and FAOSTAT22 for Poland, and NASS21 for Mississippi. Coefficients were used to convert livestock numbers into manure quantity and the content and composition of total N from livestock was calculated. Coefficients for conversion of livestock manure were obtained from Meisinger and RandellReference Meisinger, Randell, Follett, Keeney and Cruse32, IUNG-PIB33, or Eurostat30. Biological nitrogen conversion is based on leguminous crops. Atmospheric deposition is calculated based on atmospheric deposition to total agricultural land13. Inputs to the agricultural system from seeds and other planting materials are calculated from beginning amounts of planting materials, multiplied by a crop-specific coefficient of N content13.
The total N outputs were measured as N used within the agricultural system, and included all harvested crop parts, including fodder crops, non-marketed fodder crops and grass (harvested and grazed). The nitrogen content of harvested biomass is determined by multiplying the harvested biomass by a crop-specific coefficient13. Coefficients to convert plant biomass into nutrient uptake and N composition were obtained from Eurostat30, Meisinger and RandellReference Meisinger, Randell, Follett, Keeney and Cruse32, or IUNG-PIB33.
Total nitrogen input to the system and total nitrogen used within the agricultural production system were determined from the total crop and animal production. Gross annual nitrogen balance was determined as the difference between total nitrogen output by crops and forage and the total nitrogen input from fertilizer, livestock manure, and other nitrogen inputs on a land area basis13.
Results
Crop production
Changes in agricultural production systems—the crops and animals produced—are the primary factors regulating nitrogen budget. The types of crops that can be produced in an area are dependent in part on the weather conditions. Mississippi has a hot, wet climate with an average annual rainfall of 135±26 cm (average±SD). For Mississippi, the average cumulative GDDs above 10 °C for the period of study were 3351±136 (average±SD). Crop production in Mississippi is more often limited by excessive temperature, and can be limited by either too much or too little rainfall. In comparison, Poland has a continental climate, with much less average annual rainfall (54.7±9.3 cm; average±SD) and significantly fewer cumulative annual GDDs above 10 °C (1037±96; average±SD).25, Reference Haylock, Hofstra, Klein Tank, Klok, Jones and New26 Crop production in Poland is most commonly limited by low temperatures and too little rainfall, although flooding does occur.
Crop production hectarage in Mississippi showed substantial year-to-year variability, with fewer varieties of crops produced than in Poland (Figs. 1A and 2A). While the smaller diversity in types of crops produced somewhat reflects the industrial production system predominant in the US, it also arises from the fact that crop production reports are voluntary for non-program crops. Hence, while vegetables, fruits, nuts and hay are grown in Mississippi21, they are not covered by support programs, resulting in a likely underreporting of the area planted. Soybeans and cotton were the two most commonly planted crops, showing an inverse relationship in hectares planted (Fig. 1A). Soybean hectares ranged from a low of 25% to a high of nearly 50% of crop land. Cotton, long considered ‘King’ of the Mid-South, fell rapidly from a high near 40% of the area planted in 2001, to a record low of less than 10% in 2008. While commonly considered to have initiated the loss of cotton hectarage in the Mid-SouthReference Fannin, Paxton and Barreca34, in Mississippi the increase in area planted to corn only accounted for the reduced cotton hectarage in 2007. Soybeans were the primary crop grown instead of cotton, and corn hectares declined after the strong increase in 2007. Sorghum hectarage also showed a strong increase in 2007, although total area planted to sorghum accounts for only a small portion (less than 2.5%) of total crop land. Hay (16%) and rice (5%) production showed only minor changes in the planted area. Wheat is grown as winter wheat, commonly in a two-year rotation of corn (March–August), winter wheat (October–June) and soybeans (June–September), and hence represents a second crop harvested within 1 year. Wheat production remained steady at around 3% of production area, but more than doubled in 2007 (7%) and 2008 to 10% of hectarage. The increased area planted to wheat in 2007 and 2008 coincided with the increase in corn and soybean hectarage and loss of cotton area. Other crops, including peanuts, sweet potatoes and vegetables, each accounted for less than 1% of the reported hectares planted.
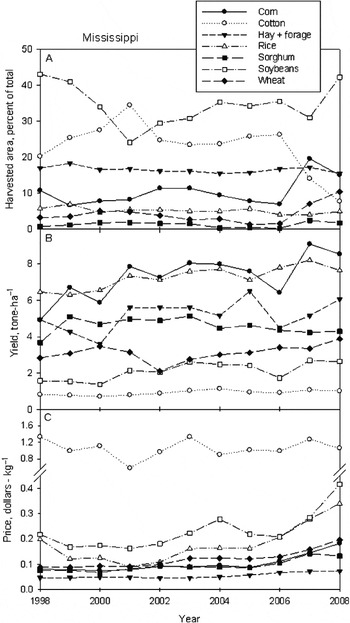
Figure 1. Changes in crop planting (A), crop yield (B), and prices received (C) in Mississippi, 1998–2008; note the break and change in scale on the vertical axis in (C).
Crop yields showed distinct changes with year in Mississippi (Fig. 1B). Corn yield increased more than 70% over the 11-year period, from 4.9 metric tons-ha−1 to 8.5 tons-ha−1. Similarly, soybean yield increased almost 70%, from 1.6 to 2.6 tons-ha−1. Rice, hay and wheat yield improvements were more modest, ranging from 37% increase for wheat, 22% increase for hay and 18% increase for rice. Cotton and sorghum yields remained nearly steady throughout the 11-year study period.
Crop production is dependent on a variety of environmental conditions experienced during the growing season, including edaphic, biotic and weather conditions. In 2000, yields were reduced for corn (20%), hay and forage (30%), and soybean (34%) from the observed average yields for the 11-year period (Fig. 1B). In 2006, yields were similarly reduced in corn, hay and forage, and soybeans. Wheat yield decreased more than 30% of the average in 2002. Cotton yield remained steady throughout the period, showing a 20% loss of yield in 2000 only, and a slight yield increase in 2006. Sorghum yields were reduced only 5% from average in 2006, and showed a 2% increase in 2000.
Cropping decisions—which crop or animal to produce—are based on anticipated economic return in some crops in Mississippi (Fig. 1C). The land area planted to corn and soybean increased in response to commodity price increase after 2006. These crops replaced cotton. Other crops, most notably rice and hay, did not respond to price fluctuations (Fig. 1C). For these crops, the field conditions may determine cropping decisions. For example, rice in Mississippi is usually flooded for weed controlReference Thomas35. This limits rice production to soil types that will hold a flood for a sufficient length of time to reduce weed pressure, and hence, limits the distribution of rice planting to fields with slowly draining soils. Similarly, pastures are more common in the hilly portion of the state27. Terrain and lack of adequate irrigation resources may limit the conversion of pastures into row crop production.
The cropping systems in Poland remained relatively stable over the time period reported in this study (Fig. 2A). While a variety of crops are grown in Poland, the predominant crops are cereals, accounting for around 70% of the cropland. Wheat and triticale were planted in the largest percent hectarage, increasing from 25 to 30% of the planted area over the 11-year period of study (data not shown). Rye hectarage declined over the time period, with a concomitant rise in other mixed grains, most notably maize. Barley production showed only a modest increase in area planted over the 11-year period, along with forage and silage (maize, legumes, clover, vegetable roots and alfalfa). Potato production declined from 10 to 5% of hectarage, a trend which has been evident throughout the potato-growing regions of Europe since 1960 and reflects changes in animal and human diets with societal modernizationReference Walker, Thiele, Suarez and Crissman36. Vegetable, fruit and nut production remained nearly steady at 5% of all hectares planted. The number of planted hectares of rapeseed increased slightly during the period of study.

Figure 2. Changes in crop planting (A), crop yield (B), and prices received (C) in Poland from 1998 to 2008; note the break and change in scale on the vertical axes in (A) and (B).
Crop yields remained steady for hay, forage and silage in Poland over the study period (Fig. 2B). Yields were reduced around 15% for potatoes and sugar beet in 1999 and 2001 from the average observed, and increased nearly 20% above average for potatoes and sugar beet in 2007. Average yield of all cereals showed total yield declines of around 20% in 2006, with more moderate yield losses in 2000 and 2003, primarily due to droughtReference Łabedzki37, Reference Lorenc, Mierkiewicz and Sasim38. Average cereal yields in Poland were similar to those observed for wheat in Mississippi. The 38% loss of fruit yield in 2007 resulted primarily from the loss of apples, although other fruits also showed reduced yields22.
With the exception of fruits and vegetables, the price volatility for crops in Poland was much less than that observed in Mississippi (Fig. 2C). Most crop prices remained steady, only showing a substantial increase in price after 2005. Cropping decisions did not respond to price in Poland, with the exception of rapeseed. No prices for silage were reported for Poland since most of it was used on-farm30.
Animal production
Poultry is the predominant livestock in both Mississippi and Poland (Fig. 3A and B) according to number of animals. However, the methods of production were very different, resulting in significant differences in the number of birds produced. In Mississippi, the predominant method of poultry production is confinement poultry houses. While some chickens are produced in free-range systems, these contribute only a minor share to total production. There was a steady increase in poultry production for both meat and eggs over the 11-year period, resulting in a net 14% increase in Mississippi. Alternatively, cattle production (primarily for meat production) showed a steady decline of more than 20% from 1,200,000 head to 940,000 head over the study period. Swine production increased steadily over the period, for a net gain of 36%, or 100,000 head.

Figure 3. Changes in animal production and livestock in Mississippi (A) and Poland (B) from 1998 to 2008, 1000 head; note the break and change in scale on the vertical axes in both figures.
Poultry production more than doubled in Poland in 2002, for a net increase of 87% over the 11-year period of study. Cattle and pork production declined steadily throughout the period for a net loss of 17% in cattle and 19% in swine. Other animals, such as sheep, goats and other poultry, were produced in minor numbers. Although most animal production in Poland is free-range, confinement animal production systems are being increasingly introduced, especially for swine productionReference Balcere, Noren, Holmgren, Hrytsyshyn, Lobanov, Marttila, Merisaar, Rimavicius, Roggenbuck and Skorupski9.
Nitrogen input
Sources of nitrogen into the system were developed from all sources using the OECD methodology13. Mineral fertilizer and manure application account for most of the nitrogen inputs (Fig. 4A and B). The inorganic fertilizers and the nutrient content of livestock manure together comprise about 77% of nitrogen inputs for Poland and 83% for Mississippi. Livestock manure accounted for more than 100 kg of nitrogen input per hectare to the agricultural system each year in Mississippi (Fig. 4A), and increased 12% over the study period. The predominant source of this nitrogen is from poultry litter (78%). Cattle are primarily pastured in Mississippi, and produce approximately 60,000 metric tons of N yearly. The large poultry confinement production systems in Mississippi generate substantial waste and most of this waste is spread on pasture, rather than crop fields. The geographic separation of the primary crop production area from the poultry production regions within the state limit the use of poultry litter on crop fields because of the high transportation costs associated with moving the litter to other areas.

Figure 4. N inputs per hectare of agricultural land from all sources for Mississippi (A) and Poland (B); note the break and change in scale on the vertical axis in (A).
Inorganic fertilizers (purchased) in Mississippi accounted for an average of 38 kg-ha−1 additional nitrogen inputs for tilled crops (Fig. 4A), and increased nearly 30% over the 11-year study period. Production of corn or cotton instead of soybean (Fig. 1A) resulted in a 15 and 21% increase in inorganic fertilizer use in 2001 and 2007, respectively. Biological nitrogen fixation from soybeans contributed an average of 23 kg N-ha−1 annually. Reductions in soybean hectarage in 2001 and 2007 decreased biological nitrogen fixation by 26 and 9% from the average, respectively. Atmospheric deposition and seeds and planting materials contributed only minor amounts to the annual N input in Mississippi.
Almost half of the total N inputs to the agronomic system in Poland arise from purchased fertilizers (inorganic) (Fig. 4B). Over the 11-year period of study, inorganic fertilizer increased more than 45% in Poland, reflecting the transitioning of the agricultural system from the planned economy toward a free-market economyReference Grzebisz, Gaj, Sassenrath and Halloran6. Livestock manure contributed an additional 33 kg-ha−1 on average each year, or 29% of the overall nitrogen budget (Fig. 4B). Cattle and swine constitute the primary manure nitrogen inputs in Poland (Fig. 3B), although the increase in poultry production has increased the contribution of poultry litter to the N balance. Atmospheric deposition and seeds and planting materials contributed only 15 and 2%, respectively, to the overall N inputs, and remained nearly steady. Biological nitrogen fixation accounted for an average of 5% of the total N input, and showed a steady decline in Poland.
In Poland, total nitrogen inputs reached the lowest level of 103 kg N-ha−1 in 2000, due primarily to a drop in inorganic fertilizer use and manure production. The decline in manure production reached the lowest level in 2001, reflecting the decline in the swine and cattle herdsReference Borys8. Manure production in Poland increased following the resurgence of animal production, primarily poultry, in 2002 (Fig. 4B).
Nitrogen output
Changes in cropping patterns alter the total nitrogen output, or N that is harvested and removed from the agricultural system. Overall, soybeans, hay and forage accounted for 83% of N output per hectare in Mississippi (Fig. 5A). Cereals, including corn, sorghum and wheat, accounted for an additional 14% of N output within the agricultural system in Mississippi. Other crops contributed only a very minor fraction of the total N output. Cereals, hay and forage predominated the N output in Poland, accounting for more than 60% of the total N output (Fig. 5B). The remaining N output was accounted for by a variety of crops.

Figure 5. Nitrogen output harvested from crops and forage for Mississippi (A) and Poland (B) from 1998 to 2008; note the break and change in scale on the vertical axis in (B).
Nitrogen output is also dependent on crop function, or the biological activity and performance of plants, which impacts the per hectare yield. The loss of crop yield, particularly of corn, soybeans, hay and forage in 2000 and again in 2006 (Fig. 1B) reduced the N output by soybeans (32 and 16%), corn (40 and 43%), and hay and forage (29 and 12%) in Mississippi (Fig. 5A). A similar reduction in crop yield was seen in Poland in 2000, and more strongly in 2003 and 2006, in cereals (15%), rapeseed (30–40%) and potatoes (up to 40%). Because cereals dominate Polish crop production, the poor crop production in cereals in these years had the greatest impact on limiting N output (Fig. 5B).
Nitrogen balance
Trends in annual total nitrogen input, output and balance indicate changes due to management decisions, cultivar differences and variable environmental conditions (Fig. 6). The cropping decision impacts the nitrogen output by crops and forage through the coefficient of conversion of N into crop. Soybeans have the highest conversion coefficient (59 kg N per ton of plant material), followed by pasture (23 kg-t−1)Reference Meisinger, Randell, Follett, Keeney and Cruse32. Cereals range from a high of 19 kg-t−1 for barley, oats and rye, 18 for millet, 17 for sorghum, triticale and wheat, to a low of 10 kg-t−1 for rice. Cotton and sweet potatoes have the lowest conversion coefficients of less than 5 kg-t−1 plant material.

Figure 6. Annual nitrogen budgets, input, output and balance for Mississippi (A) and Poland (B) from 1998 to 2008, 1000 tons.
Total annual N input to the agricultural system showed a 7% increase in Mississippi over the study period (Fig. 6A) to approximately 600,000 metric tons. The major factor contributing to the net increase of N in the agronomic system was due to the increasing number of livestock produced. The loss of soybean hectarage in 2000 and 2006 resulted in slight (∼2.5%) decreases in N inputs. Total annual N output increased steadily, with an overall 43% increase in N output over the 11-year study period in Mississippi. This increase occurred partly because of better crop yields per acre and partly because of a shift in the cropping system toward corn, soybeans and wheat (Fig. 6A). The improved crop uptake was interrupted in 2000 and 2006 because of poor crop productivity levels. These years of crop loss increased the overall N balance in Mississippi 15% above the average in these years.
Total annual N input declined initially in Poland (Fig. 6B) as fewer animals were produced. The resumption of poultry production in 2002 reversed the trend, increasing total inputs to the N budget overall by 5%. As in Mississippi, poor crop yields in 2000, 2003 and 2006 decreased the annual N outputs up to 16%, increasing the annual N balance for Poland. Over the course of the 11-year period, the nitrogen balance in Poland increased 30% to more than 950,000 metric tons of nitrogen per year.
The gross annual N balance is an agro-environmental indicator used in agro-policy and provides information about the relative utilization of N applied to an agricultural production system of a country and region on a per-hectare basis. The nitrogen balance represents the amount of N applied, produced or fixed within the agronomic system in excess of that harvested from the system. Sustainability of the system is enhanced by reducing the gross annual nitrogen balance, to bring the inputs in line with the outputs.
The gross annual N balance per hectare during the 11-year period averaged 101 kg N-ha−1 in Mississippi (Fig. 7). The gross annual N balance decreased steadily, for a total reduction of 11%. Although this is an improvement in the agricultural system, substantially more nitrogen is put into the agricultural system than is harvested from the system. As Mississippi has converted farmland from cotton to corn and soybeans (Fig. 1), the nitrogen uptake improved (Fig. 6). The increase in area planted to corn and soybean in 2007 and 2008 decreased the gross annual N balance in Mississippi 5 and 15%, respectively, from the 11-year average (Fig. 7).

Figure 7. Gross annual nitrogen balance per hectare of agricultural land for Mississippi and Poland from 1998 to 2008.
The gross annual N balance in Poland increased 48% from 39 kg N-ha−1 in 1998 to 60 kg N-ha−1 in 2008 (Fig. 7). This increase occurred primarily from the greater use of inorganic fertilizers, and secondarily because of increased manure production (Fig. 4B). The gross annual N balance was substantially higher in Mississippi than in Poland, primarily as a result of the high manure production associated with confinement poultry production (Fig. 7).
Years of compromised crop yield significantly impacted the gross annual nitrogen balance in both Mississippi and Poland. Note that for both Poland and Mississippi, adverse weather had a strong impact on N outputs (and hence N budgets) on a year-to-year basis. This impact is sufficient to mask any improvements in N budgets achieved from the changes in cropping systems or management practices, with the exception of confinement livestock production.
The gross annual N balance calculated for Mississippi is overwhelmed by livestock manure production. A significant reduction in poultry production (to one-eighth of the current levels) would be needed to bring the N budget into balance in Mississippi. In the absence of large confinement animal production, the annual gross N is closer to balanced in Poland (Fig. 7). However, the continued increase in inorganic fertilizer use in the absence of additional crop production increased the gross N budget in later years in Poland (Fig. 7). A 10% reduction in purchased fertilizers in concert with a 10% increase in productivity would greatly increase the partial factor productivity of crops with respect to N. In order to balance the gross annual N budget, however, animal production would need to be reduced to 25% of its current level.
Discussion
Agricultural production systems change in response to internal and external influencesReference Hendrickson, Hanson, Tanaka and Sassenrath39. Recognition of the need to maintain healthy productive capacity through resilience to these influences has led to the concept of sustainable production systemsReference Holling40. Sustainability in agriculture is attained by balancing the inputs to the system with products harvested from or wastes produced by the system, usually focused in three key areas: economic, environmental and social.
The nitrogen cycle is a key aspect of agriculture—impacting both production potential and environmental contamination. Fertilizer contamination has become a key environmental concern because of the impact on large environmental areas due to excessive application and intensive production practices. Primary watersheds in the US are targeting agricultural production practices to manage excess nutrient runoff and reduce contamination of large waterways such as the Gulf of MexicoReference Greenhalgh and Sauer41. Nutrient balances have been identified as a common method to evaluate nutrient release from agricultural operations13. The European Union directives have set goals that each member country must abide by to limit nutrient overload15.
Societal goals engender the development of policy, as well as the creation of monitoring tools to assess compliance with policy. Such tools are based on some understanding of the related physical processes, with varying degrees of sophistication and accuracy. Especially in cases where the initial versions of the tools have not been rigorously or extensively tested, evaluations should be conducted on an ongoing basis to determine if the tools provide the expected insight into the effectiveness of policies to affect some desired change. If the evaluations reveal weaknesses, they are also likely to provide guidance on the needed adjustments. It has been posited (and the EU has instituted policy) that country-wide computation of nutrient balances, such as nitrogen and phosphorus, are useful to assess progress toward achieving widespread sustainable agronomic production, as determined by the minimization of negative environmental impacts, within EU member states15. A similar, but much more local approach is being taken on a producer-by-producer basis by the USDA-NRCS17. There remains a question as to whether summing local N balance results across a region as large as an EU country (or across a US state such as Mississippi) is a useful exercise. There is also a question as to whether the N balance actually reflects local management decisions in response to economic drivers (including commodity prices and market and regulatory incentives), or is more responsive to factors outside human control (e.g., growing season weather variations or edaphic factors). This may be a case where a quantity that is easy to compute from the readily available official data is being misused or misinterpreted in some essential respects.
As Mississippi has converted farmland from cotton-to-corn, soybeans and wheat (Fig. 1A), the state-wide nitrogen balance has decreased overall (Fig. 7). The increase in area planted to corn, soybean and wheat in 2007 and 2008 enhanced N uptake, at least in part because of the higher coefficient of conversion of these crops, especially of soybeans. These changes in crop planting resulted from external influences of anticipated return on investment (Fig. 1C), which has been observed in other agricultural systems12. However, while shifting to different cropping systems may increase the economic return to an individual farmer in Mississippi, loss of processing associated with cotton negatively impacts the surrounding rural economyReference Fannin, Paxton and Barreca34, negatively impacting a different aspect of sustainability. Moreover, environmental constraints of soil type and topography limited conversion of some fields to alternative crops (e.g., hay and rice). Given that conversion of all arable land to high-N-uptake crops is not a viable option in any sense of overall sustainability, the extent of possible improvement in N budgets due to such conversion is limited.
Additional improvements in crop production were also realized through better management and improved technology (cultivars, etc.) that enhanced crop yields in Mississippi (Fig. 1B), also directly contributing to greater N efficiency (Fig. 7). Conversely, lower yields in some years reduced the N uptake by crops, negatively impacting N efficiency in both Mississippi and Poland.
Poland is in the Continental environmental zone of Europe, the main attributes of which are severe winter periods and high year-to-year variability in water supplyReference Jongman, Bunce and Metzger42. The most negative aspects of water supply are a high frequency of drought periods during the growing season, negatively affecting crops grown from April to SeptemberReference Supit, van Diepen and de Wit43. The sensitive drought period changes depending on crop: for winter cereals the worst is drought in April and May; for spring cereals—in June; for potatoes—in June and July; for maize—in July and for sugar beet—in July and AugustReference Grzebisz44. Drought that occurs during the most critical stages of plant growth is the most limiting factor to crop growth, in turn negatively affecting N use efficiency.
The emerging picture for Poland is one of increasing N inputs, due to increasing application of inorganic fertilizers and increasing livestock production (Fig. 4B), with only weak improvement in crop yields (Fig. 2B). The shift in cropping pattern from potatoes to cereals and rapeseed (Fig. 5B) has improved the total N uptake (Fig. 6B), but not sufficiently to produce an overall improvement in N balance (Figs. 6B and 7). The impact of poor crop weather appears to have been particularly important for Poland's total N balance. Moreover, increased use of N fertilizers has led to reduced N use efficiencyReference Fotyma, Igras, Kopiński and Podyma45. The trend of increasing total N is troubling in every sense.
To address the increasing demand for meat protein, intensive animal production operations continue to expand. The establishment of confinement animal operations significantly increases the manure concentration in an area, and the total nitrogen input to the production system. The geographic separation of animal and crop production systems in response to processing demands limits the distribution of nutrients across agricultural enterprisesReference Granstedt10. Integrated farming systems benefit the farmer and agriculture through resource sharing among enterprisesReference Hendrickson, Sassenrath, Archer, Hanson and Halloran3, Reference Sassenrath, Hanson, Hendrickson, Archer, Halloran, Steiner and Bohlen46. As seen for the production systems in the northeast US, resource sharing provides benefits to the individual farmer, as well as the rural communityReference Sassenrath, Halloran, Archer, Raper, Hendrickson, Vadas and Hanson47. This benefit is lost with vertical integration of an industry, as emphasis is placed on enhancing the subsequent stage or processing step rather than ancillary enterprises within the rural ecosystemReference Martinez48. The establishment of geographic regions of production based on processors’ needs further exacerbates environmental contamination from confinement animal operations. Note that N budgets (as calculated herein) are nation or state-wide totals, and manure production correlates with poultry numbers (Figs. 3 and 4). Given the physical separation between cropped hectarage and confined poultry operations in Mississippi, it is possible that relatively strong improvements in N uptake in the Delta are masking the degrading conditions in the hill country due to cumulative N input. In other words, while the overall budget indicates improvement in N management, the local reality might be quite different. A similar situation appears to be developing in PolandReference Fotyma, Igras, Kopiński and Podyma45, Reference Kopiński and Krasowicz49.
Enhanced resource sharing between animal and crop production has been the norm in the semi-subsistence farms of Poland. As Poland moves toward more industrialized agriculture, including confinement swine productionReference Balcere, Noren, Holmgren, Hrytsyshyn, Lobanov, Marttila, Merisaar, Rimavicius, Roggenbuck and Skorupski9, the problem of manure disposal will become a greater concern. Most soils in Poland originate from sand and loamy sand materials, which are highly permeable to water and susceptible to leaching of nitratesReference Grzebisz and Fotyma50, 51. Although the country average bonitation index of soil suitability for agriculture production, evaluated in the 100 degree rating, is approximately 66, significant regional differences in the index values are foundReference Kopiński and Krasowicz49. Spatial differences in soil quality, inherent nutrient status and soil acidity result in differences in the use of fertilizersReference Kopiński and Krasowicz49, Reference Grzebisz52. With diligent attention to use of locally generated manures as a substitute for artificial fertilizers, Poland has the opportunity to avoid the geographic separation that hinders resource sharing between animal and crop production enterprises in Mississippi and improve the overall N utilization in their agronomic production. Additional improvements in crop production and fertilizer use may be possible through better use of ancillary fertilizers such as magnesium, and liming to adjust soil pHReference Grzebisz53, Reference Grzebisz, Przygocka-Cyna, Szczepaniak, Diatta and Potarzycki54.
Conclusions
This analysis assembles production and economic data across 11 years (1998 through 2008) from two very different agricultural production systems: a member of the EU (Poland) and the state of Mississippi, USA. The impact of within-season variability in production potential arising from weather and other variables, along with economic drivers, most notably commodity prices, on management decisions are evaluated within the context of annual assessments and trends of nitrogen budgets and gross nitrogen balance, as well as official and anecdotal evidence on spatial distribution and evolution of agronomic systems during this period. The gross annual N balances developed here clearly demonstrate the magnitude of difference in N balance, allowing an examination of two very different production systems. Trends in the annual N balance are also captured by the calculation, indicating changes in management practices.
Two problems with the use of large-scale nitrogen indices are revealed. The first problem is one of spatial scale: nitrogen indices calculated for large areas, such as a country or state, necessarily average out both the successes and problems in N management, obscuring the actual situation locally. The geographic separation of concentrated animal feeding operations (CAFOs) from crop production areas in Mississippi makes calculation of one index for the entire state inappropriate for within-state assessments or rectification planning. Spatial differences in gross annual N balances have already been observed for PolandReference Kopiński, Tujaka and Igras11. The increasing establishment of CAFOs in Poland will further exacerbate the spatial variability of N budgets, rendering the use of nation-wide N indices similarly inappropriate.
The second problem is the sensitivity of nitrogen budgets and nitrogen use efficiency to actual crop yields. In years of poor crop performance, the calculated N budgets and gross annual balance do not reflect management choices. Valuation of ecosystem services can contribute positively through better implementation of conservation and alternative production methods16, Reference Holling40. However, establishing incentive payments or nutrient trading based on a factor that is not under the control of the producers, and cannot be forecast with a useful level of certainty, is clearly problematic. The acceptance and implementation of alternative management practices will be predicated on the extent to which this aspect of nitrogen budgets is recognized and accounted for in the application of incentives and trading schemes.
Coupled with the substantial anticipated world-wide growth of large-scale and intensive animal production systemsReference de Haan and Reynnells55, attention must be given to the management of nitrogenous wastes generated in these systems. Developing indices that capture and identify the year-to-year variability in drivers of the agronomic production system, both those that are under the control of producers as well as those that are not, and that reflect the spatial localization, will be needed as an indicator or policy instrument for achieving sustainable agronomic practices.
The goal of policy development directed toward quantifying agricultural impacts to the environment for regulatory purposes is understood. However, that policy needs to be based on a realistic assessment of agricultural production and limitations to that measurement. Large, country or state-wide measures are a good starting point for exploring N impacts of agricultural production, but do not adequately reflect the local variations in N fluxes. Moreover, substantial N fluxes, such as those arising from the agriforestry industries, are currently ignored in the calculation of N indices. Improvements to agricultural production that address nutrient use efficiency will improve the overall nutrient balance of the system. Addressing problems closer to the source of problem development will go much further in reducing negative environmental impacts of agricultural activities.
Acknowledgements
This research was funded in part by a fellowship to Dr Renata Gaj from the Organization for Economic Cooperation and Development. We thank Ms Andrea McNeal and Mr Jason Corbitt for their extensive help with data collection and collation. We acknowledge the E-OBS dataset from the EU-FP6 project ENSEMBLES (http://ensembles-eu.metoffice.com) and the data providers in the ECA&D project (http://eca.knmi.nl).


