


Introduction
Agroforestry (AF) is a land use practice in which a woody component is combined with crops and/or livestock on the same field (Mosquera-Losada et al., Reference Mosquera-Losada, McAdam, Romero-Franco, Santiago-Freijanes, Rigueiro-Rodríguez, Rigueiro-Rodríguez, McAdam and Mosquera-Losada2009). As a result of agricultural intensification and mechanization, the occurrence of woody features in the agricultural matrix has substantially decreased throughout the 20th century (Quinkenstein et al., Reference Quinkenstein, Wöllecke, Böhm, Grünewald, Freese, Schneider and Hüttl2009; Torralba et al., Reference Torralba, Fagerholm, Burgess, Moreno and Plieninger2016). Although this transition to intensified production methods has increased use-efficiency and productivity of agricultural land, it is simultaneously associated with negative effects such as increased soil erosion, water pollution and biodiversity loss (Matson et al., Reference Matson, Parton, Power and Swift1997; Tscharntke et al., Reference Tscharntke, Klein, Kruess, Steffan-Dewenter and Thies2005; Mast et al., Reference Mast, Hönninger and Claupein2012). Recently, interest in AF has been growing again, because this type of cropping system has been linked to the potential mitigation of several of the side-effects of intensified production (Malézieux et al., Reference Malézieux, Crozat, Dupraz, Laurans, Makowski, Ozier-Lafontaine, Rapidel, de Tourdonnet and Valantin-Morison2009; Reisner et al., Reference Reisner, de Filippi, Herzog and Palma2007; Tsonkova et al., Reference Tsonkova, Quinkenstein, Böhm, Freese and Schaller2014).
Production systems with rows of trees alongside or in the fields (e.g., alley cropping, boundary planting) appear to offer a promising land use alternative (Quinkenstein et al., Reference Quinkenstein, Wöllecke, Böhm, Grünewald, Freese, Schneider and Hüttl2009; Tsonkova et al., Reference Tsonkova, Böhm, Quinkenstein and Freese2012). This form of agroforestry system (AFS) can efficiently be combined with the use of modern farming techniques and machinery for the cultivation of crops in the intercropping zone between the tree rows. The potential beneficial effects of tree rows on several regulating (e.g., biological pest control, carbon sequestration), supporting (e.g., soil fertility, nutrient cycling, habitat) and provisioning (overall agricultural productivity) ecosystem services (ES) are described by various authors (Jose et al., Reference Jose, Gillespie and Pallardy2004; Quinkenstein et al., Reference Quinkenstein, Wöllecke, Böhm, Grünewald, Freese, Schneider and Hüttl2009; Tsonkova et al., Reference Tsonkova, Böhm, Quinkenstein and Freese2012; Pardon et al., Reference Pardon, Reubens, Reheul, Mertens, De Frenne, Coussement, Janssens and Verheyen2017). Until now, quantification of these beneficial effects in temperate arable fields has been limited for several aspects and for different tree–crop combinations. In addition, demand for the reliable provision of almost all ES is increasing (MEA, 2005; Bennett et al., Reference Bennett, Garry and Gordon2009), whereas most studies focus on only one aspect of how the woody component affects the ES (e.g., the impact on crop productivity, soil quality, biodiversity or another parameter) but rarely a combination of all of them (Thomas et al., Reference Thomas, Parkinson, Griffiths, Fernandez Garcia and Marschall2001; Bianchi et al., Reference Bianchi, Booij and Tscharntke2006; Jose, Reference Jose2009; Power, Reference Power2010; Fagerholm et al., Reference Fagerholm, Torralba, Burgess and Plieninger2016; Torralba et al., Reference Torralba, Fagerholm, Burgess, Moreno and Plieninger2016). As a result, observed beneficial effects are often assumed to affect crop yield, for instance, without simultaneous measurement. This lack of integrated quantification is assumed to be one of the primary stumbling blocks to translate the abovementioned increased interest in AF into increased adoption in practice (Tsonkova et al., Reference Tsonkova, Quinkenstein, Böhm, Freese and Schaller2014; Artru et al., Reference Artru, Garré, Dupraz, Hiel, Blitz-Frayret and Lassois2016; Luedeling et al., Reference Luedeling, Smethurst, Baudron, Bayala, Huth, van Noordwijk, Ong, Mulia, Lusiana, Muthuri and Sinclair2016).
Here we used an integrated approach to assess the effect of rows of walnut trees (Juglans regia L.) on soil organic carbon (SOC), soil nutrient status, the presence of potentially beneficial ground-dwelling arthropods and the yield and quality of neighboring arable crops. Walnut trees are economically important because of their fruits and valuable timber (Reisner et al., Reference Reisner, de Filippi, Herzog and Palma2007). Moreover, they are characterized by a late budburst (Dufour et al., Reference Dufour, Metay, Talbot and Dupraz2013) which delays competition for light with neighboring arable crops. As a result, they are considered a suitable tree species for use in AFS. We hypothesized that tree row presence results in (i) an increase in SOC and soil nutrients, (ii) an increase in abundance and diversity of ground-dwelling arthropods and (iii) a crop type-dependent influence on crop yield and quality.
Material and Methods
Study site
The study site is located in Tielt-Winge (Belgium, 50°55′N–4°54′E) and characterized by temperate climatic conditions with a mean annual temperature of 9.7 °C and a mean annual precipitation of 828.1 mm (Grechka et al., Reference Grechka, Berezin, Emmott, Lyutsarev, Smith and Purves2016). During the years of sampling, the summer of 2015 and the spring of 2017 were considered exceptionally dry, and both the spring and summer of 2017 were considered exceptionally warm (KMI, 2019a) (Appendix A). In Belgium, mature alley cropping systems or boundary planted fields with walnut are scarce. Therefore, a double alley of walnut trees, bordered on each side by an arable field, was used as a proxy to study the effect of mature walnut tree rows on a set of soil characteristics (2015), ground-dwelling arthropod fauna (2015–2016) and crop yield (2015–2016–2017) in AFS (Fig. 1, Appendix B). The tree rows are oriented north–south, which is commonly considered to be the most favorable orientation for temperate AFS (Reynolds et al., Reference Reynolds, Simpson, Thevathasan and Gordon2007; Smith et al., Reference Smith, Pearce and Wolfe2012a). The field with trees on its east side is called ‘field A’ below; the field with trees on its west side, ‘field B’. The distance between the two rows, which are separated by a path, equals 4.7 m. The intra-row distance between trees is approximately 9 m. The trees were planted in 1947, diameter at breast height (DBH) and height of the trees equal 41.8 cm and 12.8 m, respectively. The total width and length of the tree alley equal 9.7 and 251 m, respectively. After planting, trees were initially high-pruned, whereas no further formative pruning has been conducted up till now. No crop protection agents are applied to the tree component. The grass in the alleys is mown to facilitate the harvest of the walnuts. The soil was a Haplic Luvisol (loess parent material). Both arable fields are only partially bordered by the tree rows. The part of the field near the treeless border creates a reference situation (‘control zone’) to isolate the effect of the tree strip from edge-effects related to slight differences in fertilization, tillage, etc. (Fig. 1). The length of the treeless control border of fields ‘A’ and ‘B’ equals 108 and 240 m, respectively. Both of the neighboring fields are conventionally farmed with an arable crop rotation and application of crop protection agents (Appendix B1 and B2). Soils were ploughed and remaining crop residues were incorporated in the soil. Crops were fertilized according to their nutrient requirements (Vandendriessche et al., Reference Vandendriessche, Bries and Geypens1996; VLM, 2014) with animal manure and mineral fertilizers and in accordance with governmental regulations (VLM, 2014) (Appendix B1).
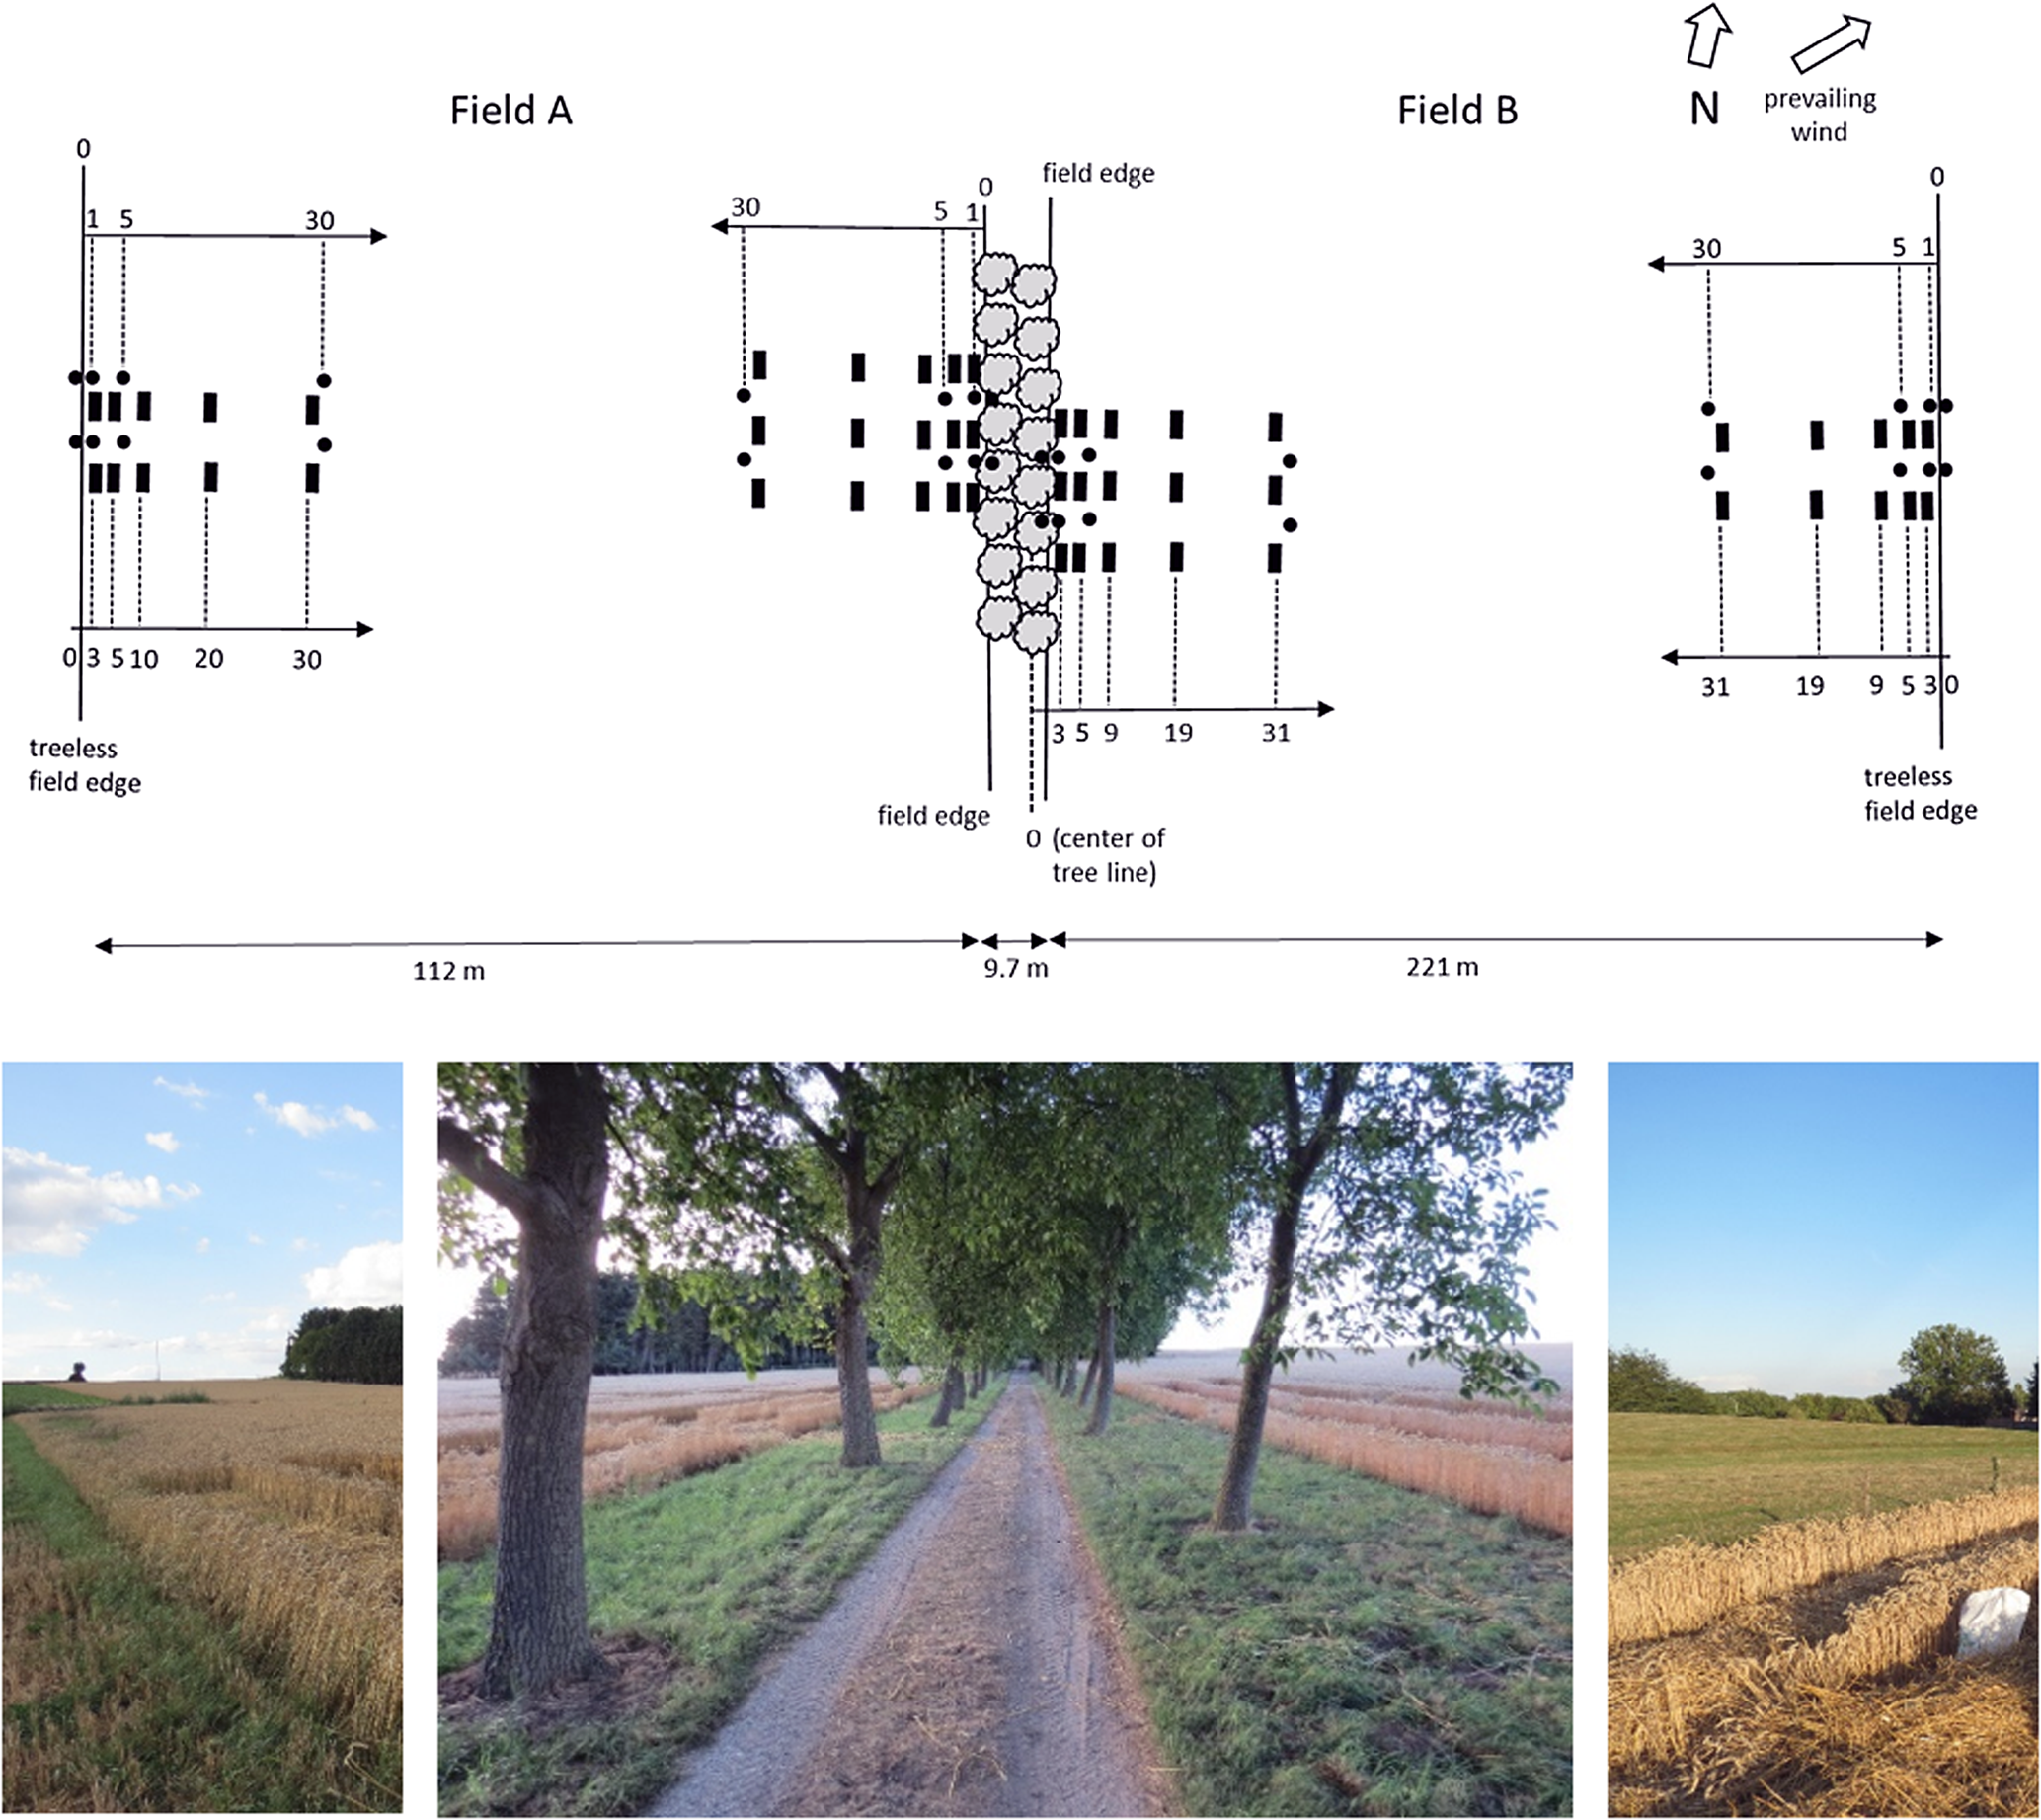
Fig. 1. Experimental design near tree rows and treeless field edges. The black rectangles denote locations of soil sampling and harvest measurements, black dots denote locations of pitfall traps. Below: tree rows (middle) and treeless control situations (left and right). Length of the tree row and the treeless control borders on field ‘A’ and ‘B’ equals 251, 108 and 240 m, respectively.
Soil sampling
In both fields perpendicular to the tree rows and to the treeless borders, three and two transects were installed, respectively (Fig. 1). In each transect, five sampling plots (1.5 m × 6.5 m) were marked, the center of which was located at distances approximately 3, 5, 10, 20 and 30 m away from the tree row/treeless field edge. If a sampling plot coincided with a tire track resulting from agricultural machinery use, the plot was repositioned slightly to a location next to the track. To ensure a representative sample, each sample consisted of a mixture of eight subsamples taken within the plough layer (0–23 cm) of these plots with a gouge auger. Soil sampling was conducted on 19 January 2016, before the fields were fertilized. After sieving (<2 mm), the soil samples were analyzed for plant available K, P, Mg, Na and Ca using inductively coupled plasma after extraction in ammonium-lactate (Egnér et al., Reference Egnér, Riehm and Domingo1960). Total N was determined by Kjeldahl digestion (reference method: ISO 11261). A heated potassium dichromate oxidation was used to analyze SOC (reference method: ISO 14235:1998). pH-KCl of soil samples was determined at a 1:5 soil:liquid (volume fraction) ratio with H2O and 1 M KCl (reference method: ISO 10390).
Functional biodiversity: ground-dwelling arthropods
Two transects were installed perpendicular to the tree rows and to the treeless borders in each field (Fig. 1). In each transect, four sampling points were marked: one in the field border and three at distances 1, 5 and 30 m away from the field edge. At each sampling point, a pitfall trap (9 cm opening diameter, volume 300 ml) was installed on May 25, 2015. Traps were filled with 200 ml of a 50% propylene glycol (antifreeze) solution with detergent to reduce surface tension. The traps were kept in place for 4 weeks until June 22, 2015, and were emptied once in between on June 8, 2015. The collected arthropods were stored in 70% ethanol. Further analysis focused on two taxonomic groups of macrodetritivores which may enhance nutrient and carbon cycling, i.e., woodlice (Isopoda) and millipedes (Diplopoda). In addition, two predatory taxa which may contribute to biological pest control were investigated, i.e., carabids (Coleoptera: Carabidae) and rove beetles (Coleoptera: Staphylinidae) (Holland and Luff, Reference Holland and Luff2000; Bianchi et al., Reference Bianchi, Van Wingerden, Griffioen, Van Der Veen, Van Der Straten, Wegman and Meeuwsen2005; Garratt et al., Reference Garratt, Senapathi, Coston, Mortimer and Potts2017). The total number of woodlice, millipedes, carabid beetles and rove beetles caught was counted for each trap. The captured specimens of every taxon, except for rove beetles, were identified to species level. This procedure was repeated in 2016.
Crop yield and quality
Crop yield was measured following a crop-specific protocol in each of the plots used for soil sampling. The location of transects and sampling plots was maintained as strictly as possible throughout the consecutive sampling years, as different crops were grown during the monitored period on the fields in the dataset (Appendix B). Winter wheat (Triticum aestivum L.), winter barley (Hordeum vulgare L.) and winter triticale (x Triticosecale Wittm.) were harvested using a Wintersteiger plot combine (type: NM elite) and the harvested grain (caryopses) was weighed. On the field intercropped with grain maize (Zea mays L.) in 2017, every sampling plot consisted of two neighboring rows over a total length of 5 m (interrow distance 0.75 m). The cobs were threshed using a Wintersteiger combine. A similar approach was used in 2017 when sugar beet (Beta vulgaris L.) were grown: two neighboring rows were harvested over a total length of 5 m (interrow distance 0.45 m). Leaves and petioles of sugar beet were harvested separately from roots to determine shoot:root biomass ratio. A representative sample of the harvested crop was collected for every plot for further quality analyses. Samples were oven-dried at 70° to determine dry matter (DM) concentration. The crude protein concentration of winter cereals was determined after grinding using Near Infrared Spectroscopy (reference method: ISO 5983-2).
Data analyses
Gradients in soil variables, yield and crop quality were modeled using a linear-mixed effect model (LMM). Distances to field edges were transformed logarithmically to linearize the response variables. The logarithm of the distance to the field edge, the presence/absence of a tree row and their interaction were included as fixed effects. The data have a hierarchical structure with measuring points nested in transects. These transects are in turn nested at the level of the experimental field. To account for this hierarchical nature and non-independence of the data within fields and transects, ‘field’ and ‘transect’ nested in field were included as random effects.
Average concentrations of SOC, soil nutrients, crop yield and quality were obtained for the field zone between 3 and 30 m of the tree rows. This was done based on the integration of the LMM effect relations, because sampling distances were not homogeneously distributed over the study area, with relatively more measuring points being located in the vicinity of the tree rows. Reported stocks of SOC and soil nutrients in the 0–23 cm soil layer are based on bulk densities as estimated by Equation 1 (Adams, Reference Adams1973).
 $$\; \; \; {\rm BD} = \; \displaystyle{{100} \over {\% \; {\rm OM}/0.244\, + \,(100-\% {\rm OM)/MBD}}}$$
BD denotes bulk density (g cm−3), OM organic matter and MBD mineral bulk density. Percentage OM was derived from SOC, based on the assumption that SOM contains approximately 58% OC (e.g., Buringh, Reference Buringh and Woodwell1984; Trigalet et al., Reference Trigalet, Chartin, Kruger, Carnol, Van Oost and van Wesemael2017). MBD typically has a value of 1.64 g cm−3 (Mann, Reference Mann1986).
The occurrence of the arthropod groups under study is described in terms of activity-density (number of individuals caught in a pitfall trap over a period of 4 weeks), because the number of invertebrates caught in the pitfall traps is a function of both their population density and activity (Thomas et al., Reference Thomas, Parkinson and Marshall1998). Species richness (number of different species) of each sample was calculated separately for woodlice, millipedes and carabid beetles. A generalized mixed-effects model with a Poisson error structure was used to investigate the differences in activity-density and species richness. The position in relation to the field edge, the presence/absence of a tree row and their interaction were included as categorical fixed effects. ‘Field’, ‘transect’ nested in the field and the year of sampling were included as random effects. Post-hoc Tukey's tests were used to determine the statistical differences among the different positions (P < 0.05).
All analyses were performed using the software program ‘R’ (R Development Core Team, 2016).
Results
Soil characteristics
Significant variation was found for SOC, soil nutrient concentrations of N, K, Mg, P, Ca and pH-KCl. These variations can be explained by the interaction between the presence/absence of a tree row and distance to the field edge (Table 1, Fig. 2). The largest increases of abovementioned variables were found near the field edge with trees. Values at a distance of 3 m from the tree row displayed a 22, 16, 59, 33, 103, 32 and 5% increase for SOC, N, K, Mg, P, Ca and pH-KCl, respectively, when compared to sampling locations at the same distance of the treeless field edge. These differences decreased exponentially with increasing distance to the field edge. As a result of the observed gradients, an average increase in SOC stock of 2.3 ton ha−1 was seen in the AFS within the field area under study (i.e., the zone between 3 and 30 m from the tree row) (Table 1), corresponding with an average SOC accumulation rate of 33 kg C ha−1 yr−1. Similarly, the observed differences in soil nutrient concentration correspond to an average increase in soil nutrient stocks near the tree rows of 156 kg K ha−1; 23 kg Mg ha−1; 157 kg P ha−1 and 168 Ca kg ha−1 when compared to the control part of the field. An average decrease in total N stock of 25 kg ha−1 was found in the 0–23 cm soil layer.

Fig. 2. Soil characteristics as a function of distance (m) to tree row and/or treeless field edge. Lines according to linear mixed modeling results, black (dashed): tree row, gray: control zone. Model formula: Y = a*log (distance in m) + b. Significance of fixed effects: •P < 0.1, *P < 0.05, **P < 0.01 and ***P < 0.001, ‘D’: distance, ‘T’: tree row presence, ‘DxT’: interaction.
Table 1. Linear mixed modeling (LMM) results for soil characteristics [SOC: g (kg dm)−1, soil nutrient concentrations: mg (kg dm)−1], crop yield (ton DM ha−1 of grain in case of winter cereals and maize and of roots in case of sugar beet) and crop quality (dry matter conc.: %, crude protein conc.: %)

Fixed effects include distance to the field edge, presence or absence of a tree row (‘T/T−’) and their interaction. Model formula: Y = a*log (distance in m) + b. Bold characters indicate P-value < 0.05. (•) indicates 0.05 < P-value < 0.10. ‘R 2c’: conditional R 2, ‘R 2m’: marginal R 2. SOC and soil nutrients stocks along the evaluated transects (i.e., between a distance of 3 and 30 m from the field edge) are expressed in kg ha−1. ‘Δ (%)’: relative difference between average yield or quality near tree row and control zone.
Functional biodiversity
A total of 506 woodlice (five species), 845 millipedes (nine species), 1837 carabids (34 species) and 1894 rove beetles were captured (Appendix C). Significantly increased activity-density values were found for woodlice in and near (1 m) the tree rows as compared to either 30 m into the field or at the treeless field edges. Species richness of woodlice was significantly higher in the tree rows when compared to the treeless field edges or to 30 m from the tree rows (Table 2, Fig. 3). A limited effect of distance to the field edge was observed near the trees for millipedes, with values at 0, 1 and 5 m being significantly higher when compared to 30 m from the tree row. However, for the latter type of macro-detritivore, no significant differences between the tree rows and the treeless field edges were found when comparing the same sampling distances. Activity-density of pest predatory arthropods was increased at a distance (30 m) into the field when compared to the field edge (Table 2, Fig. 3). In addition, overall activity-density of carabids was higher in the field zone near the trees when compared to the treeless part of the fields (Table 2, Fig. 3).
Table 2. (Generalized) linear mixed modeling results of arthropod groups

Included fixed effects are presence or absence of a tree row (‘T+/T−’), distance to the field edge (‘Distance’) and their interaction. Bold characters indicate P-value < 0.05.
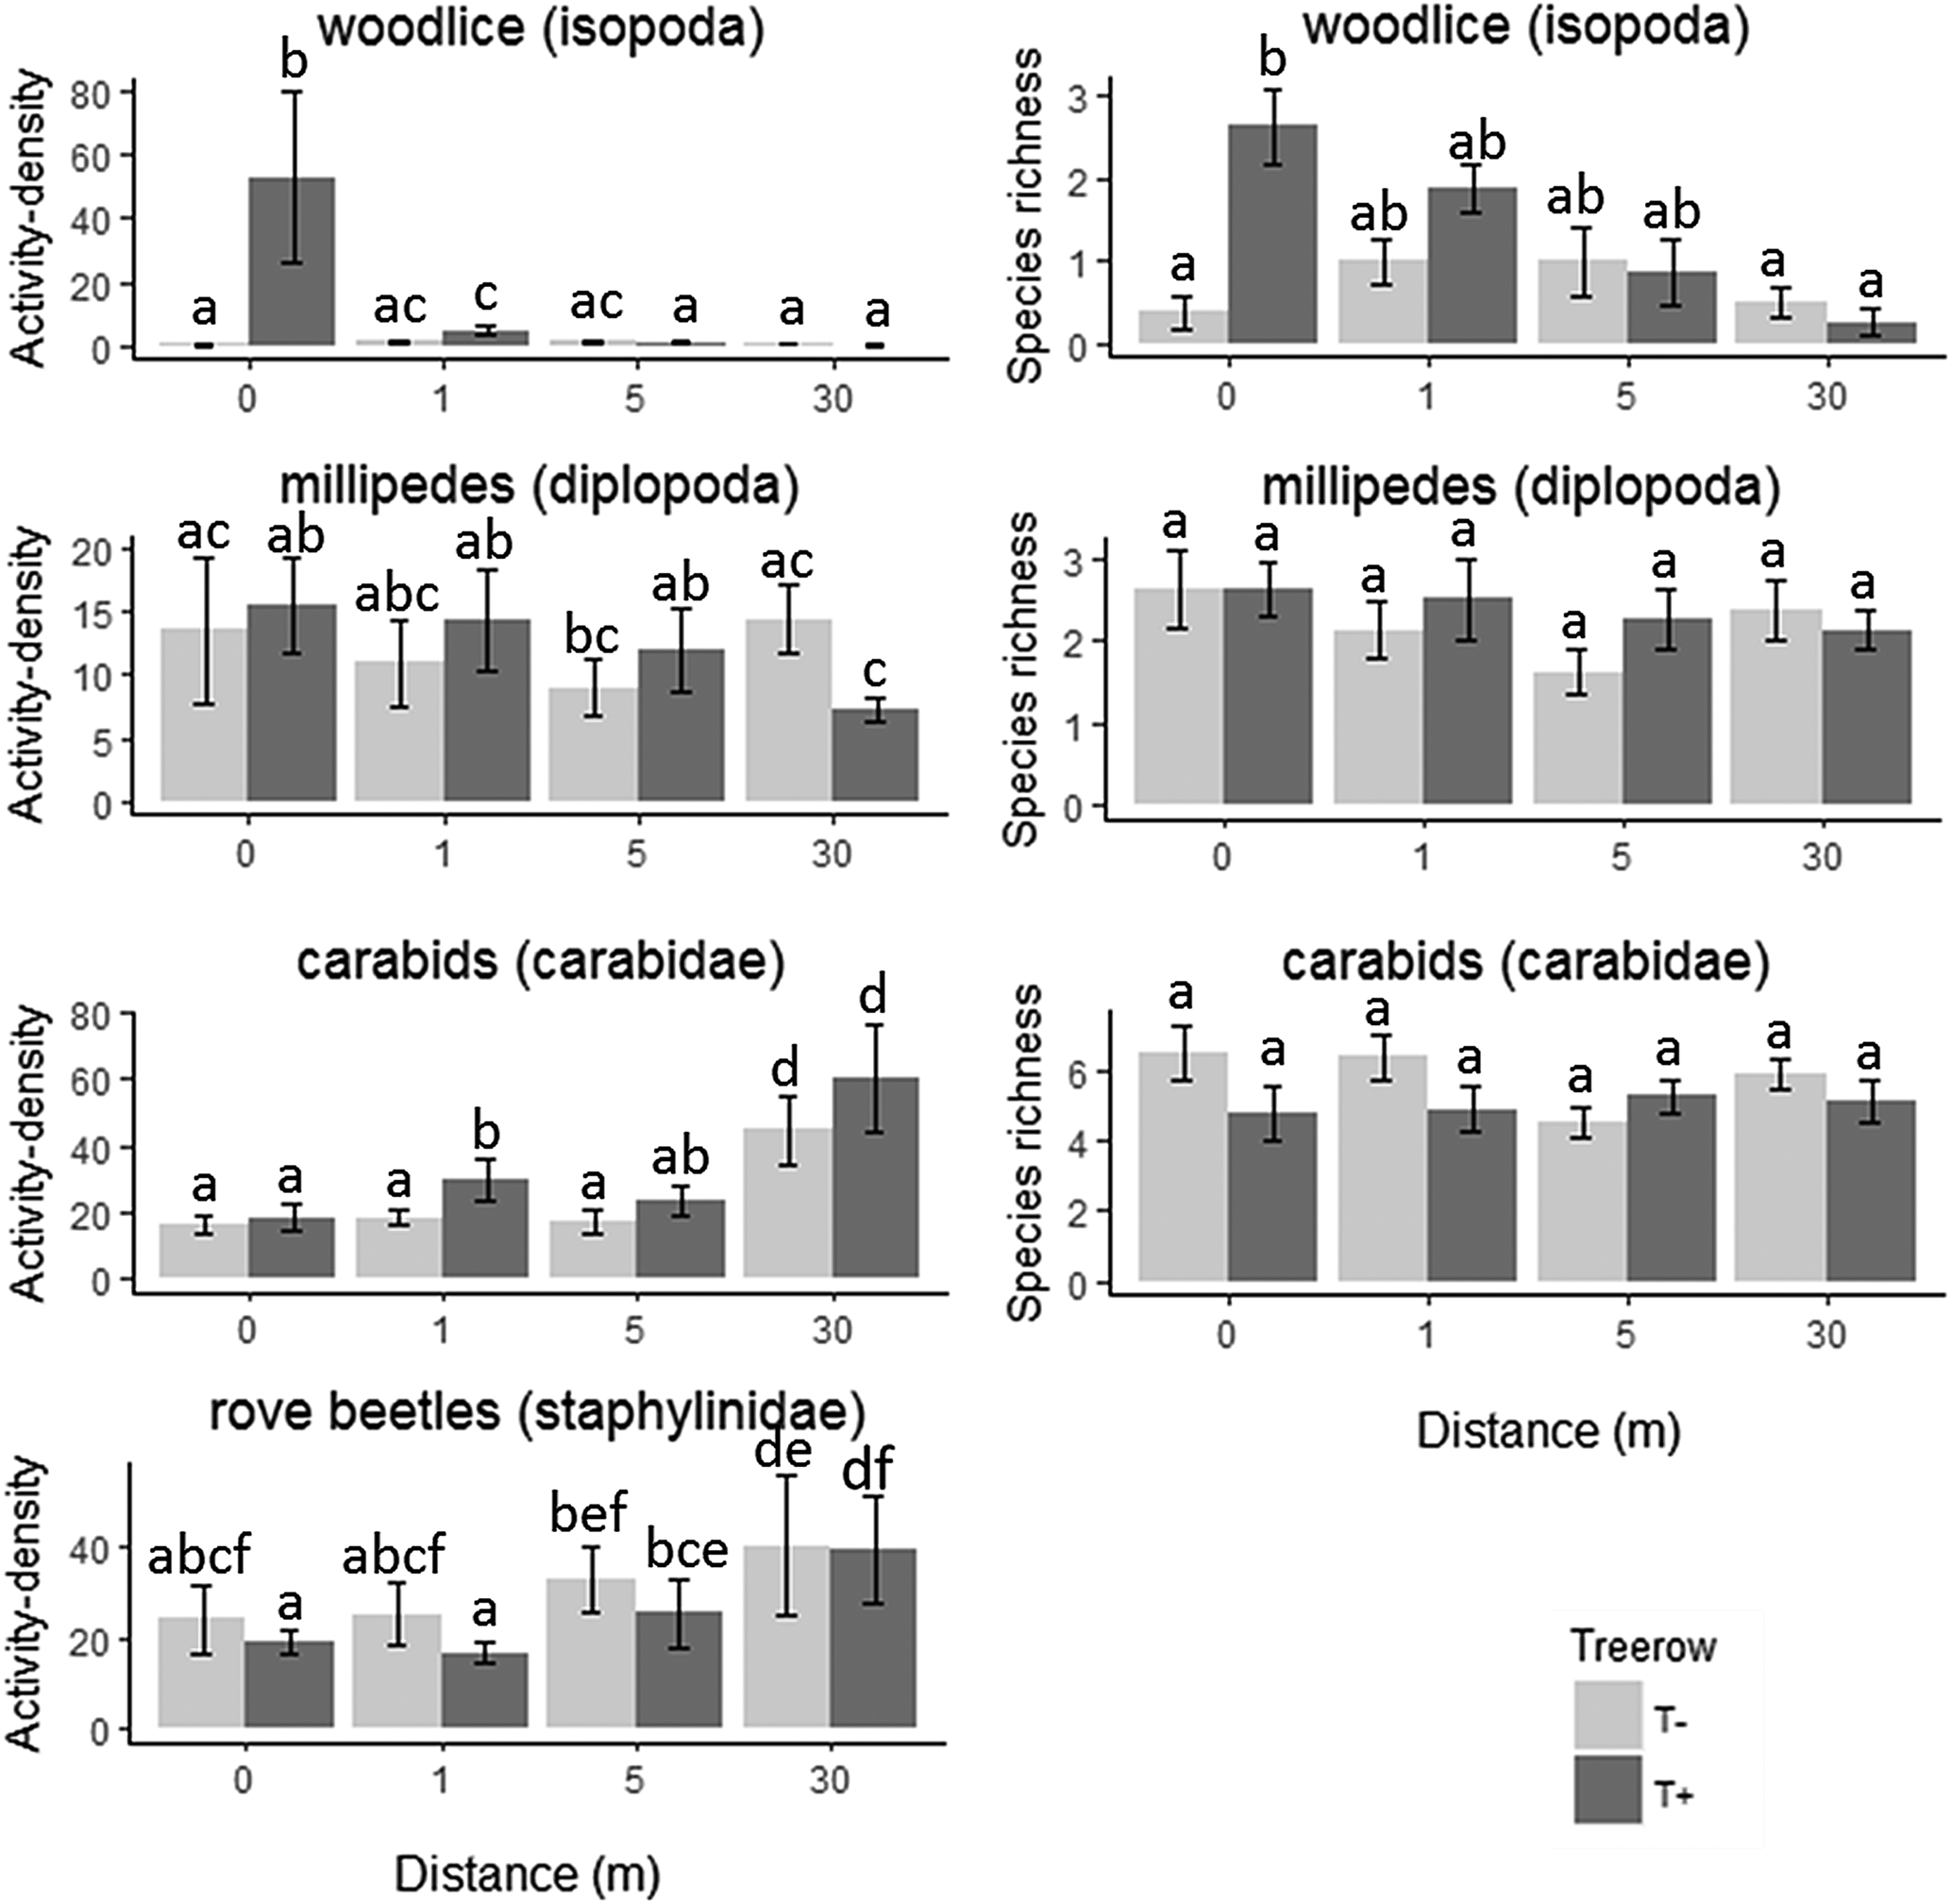
Fig. 3. Activity-density and species richness of woodlice, millipedes and carabids and activity-density of rove beetles (dark gray: tree row, light gray: control zone). Letters indicate significant differences (P < 0.05). ‘T+/T−’: tree row presence. Barplots and errorbars indicate mean ± S.E.
Crop yield and quality
Significant variation in yield was observed for all crops (Table 1, Fig. 4). The largest reductions in crop yield were observed at the sampling plots closest to the field edge (3 m) where crop yield was 36, 33, 40 and 75% lower near the trees for winter wheat, winter triticale, sugar beet and grain maize, respectively, in comparison to the same distances in the control zone (Table 1, Fig. 4). The yield of winter barley decreased as distance from the field edge decreased, but was consistently lower near the trees at all sampling distances when compared to the control zone. Average reductions in crop yield in the transects near the trees (between 3 and 30 m) equaled 5.0, 10.6, 11.9, 14.8 and 7.8% for winter wheat, winter barley, winter triticale, sugar beet and grain maize, respectively, as compared to the control zone.
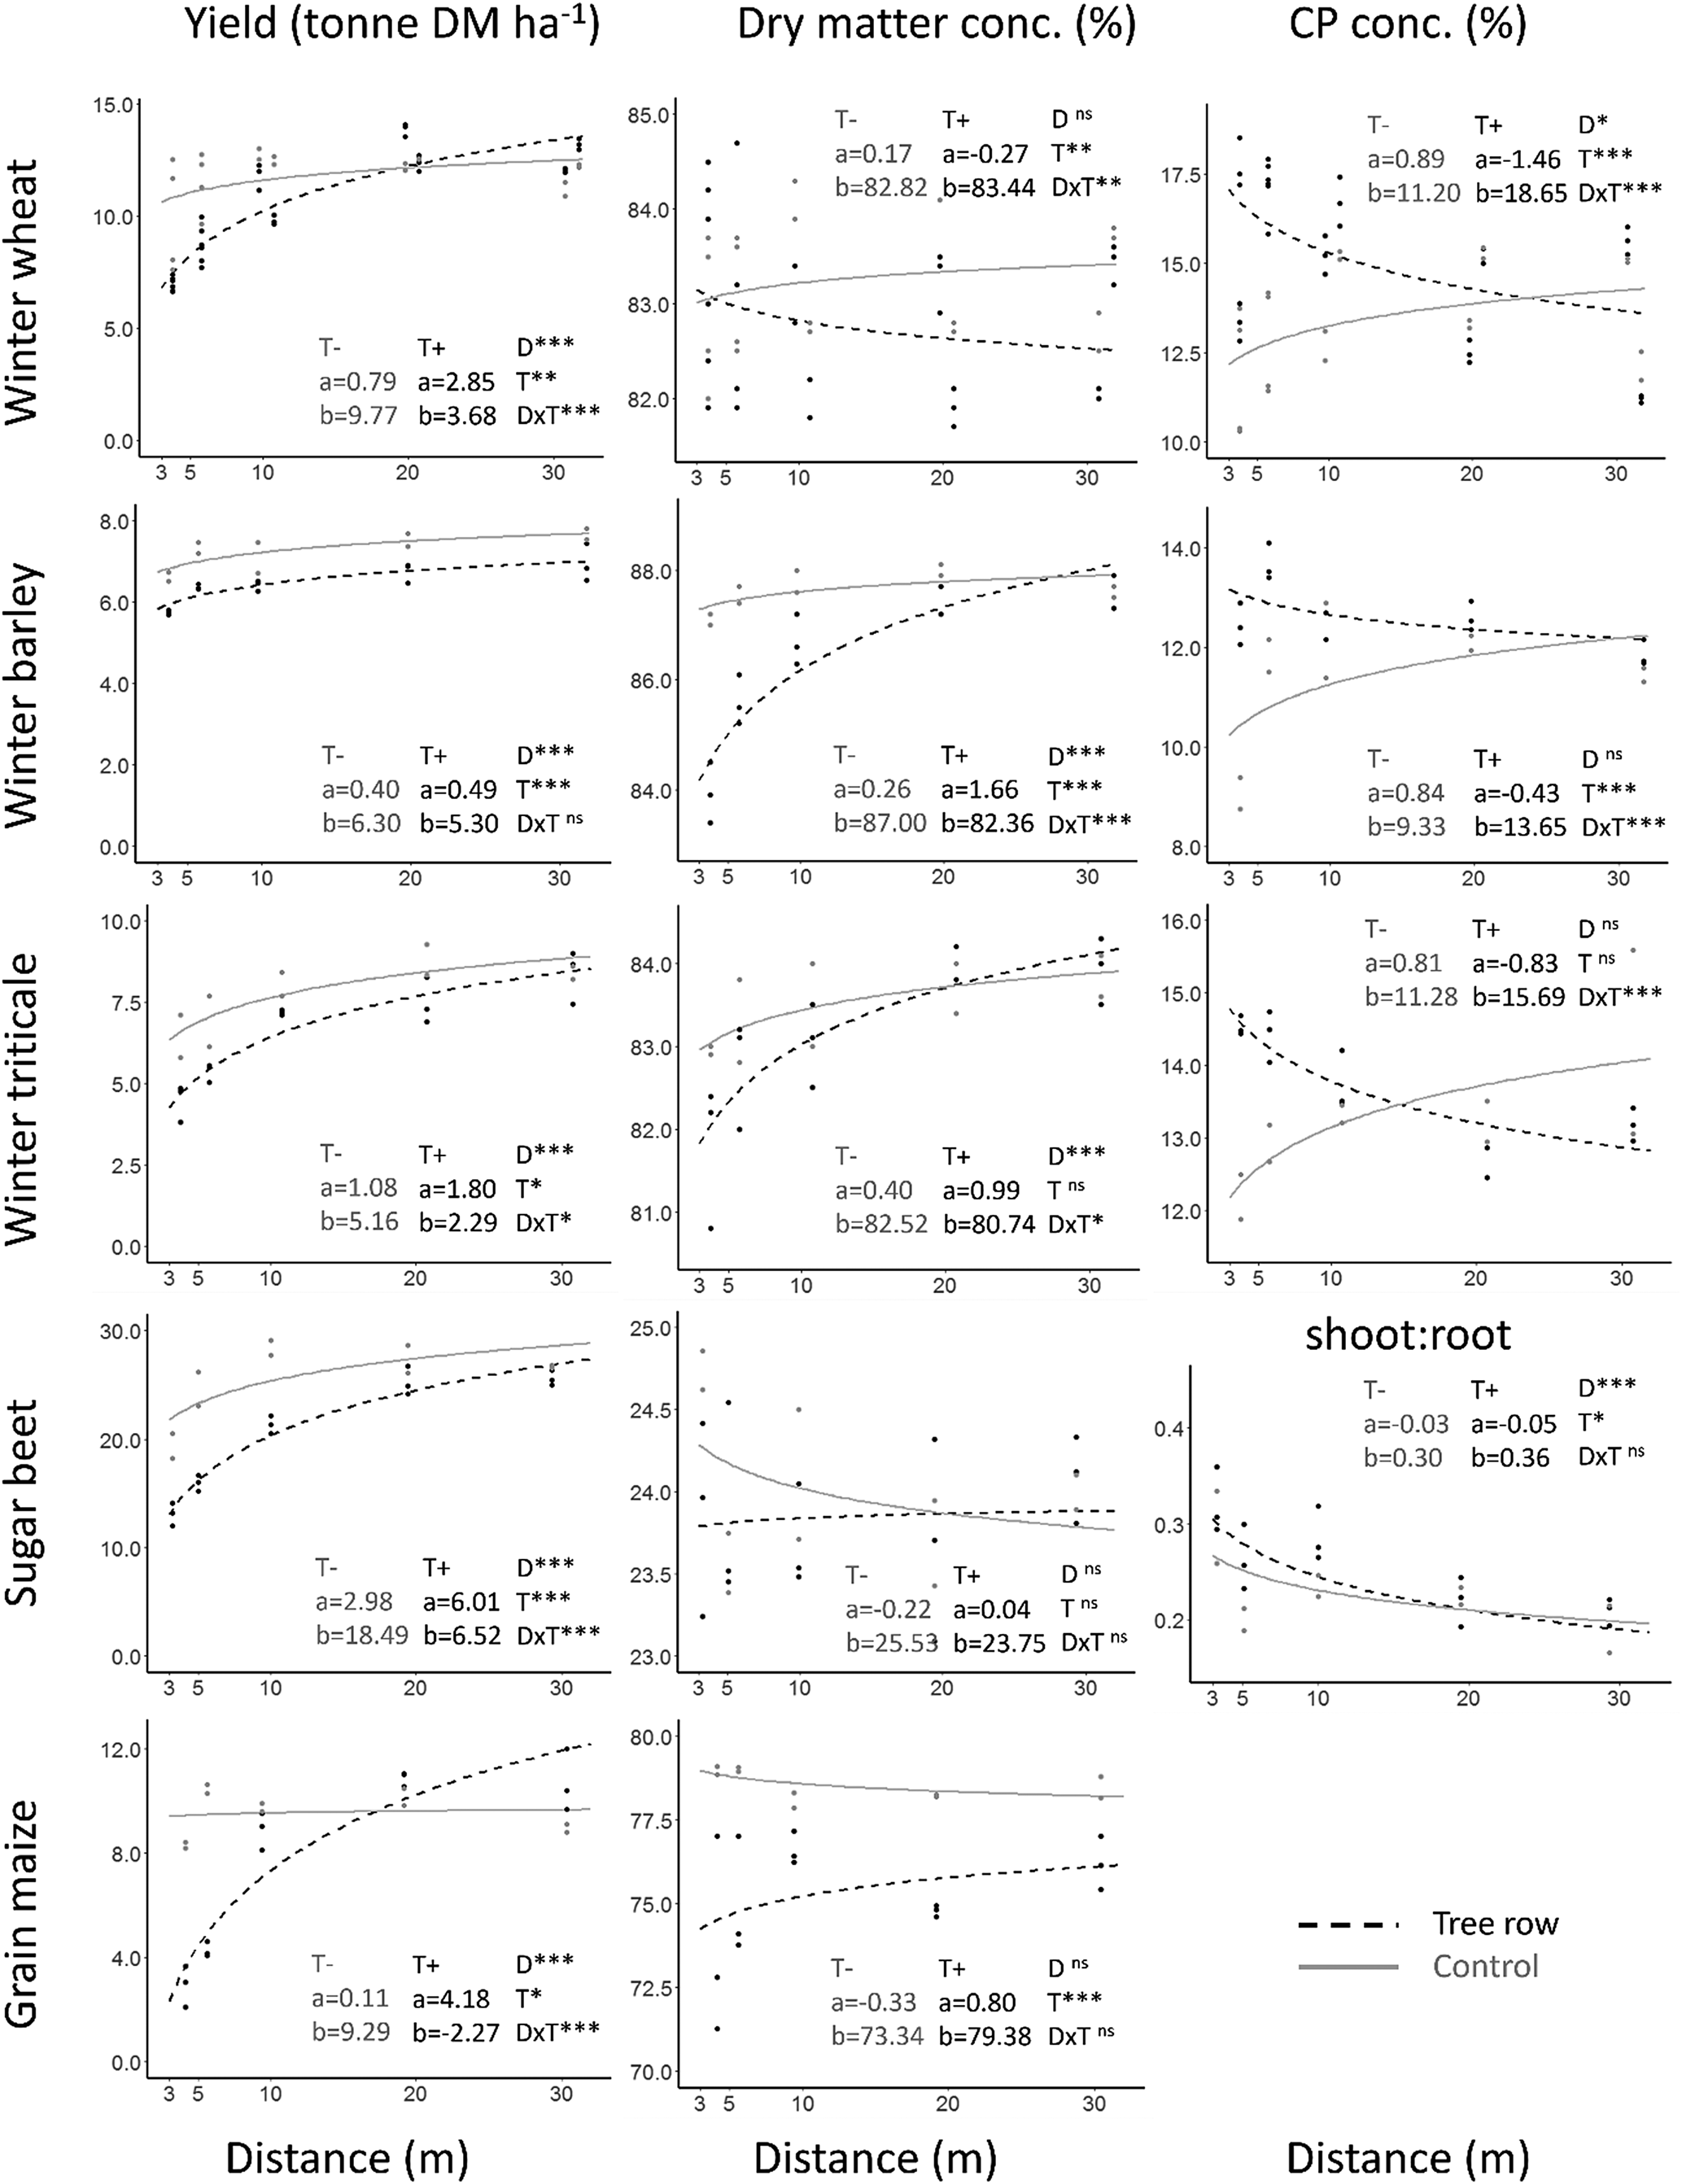
Fig. 4. Crop yield (ton DM ha−1 of grain in case of winter cereals and maize and of roots in case of sugar beet), dry matter concentration (%), crude protein concentration ‘CP’ (%) and shoot:root ratio (DM) of five arable crops as function of distance (m) to tree row and/or treeless field edge. Lines according to linear mixed modeling results, black (dashed): tree row, gray: control zone. Model formula: Y = a*log (distance in m) + b. Significance of fixed effects: *P < 0.05, **P < 0.01 and ***P < 0.001, ‘D’: distance, ‘T’: tree row presence, ‘DxT’: interaction.
DM concentrations of winter barley, triticale and grain maize significantly decreased near the tree rows. An opposite trend was found for DM concentration of winter wheat with increasing values at smaller distances to the trees. The crude protein concentration of winter wheat, barley and triticale and shoot:root ratio of sugar beet were significantly increased near the tree rows (Table 1, Fig. 4).
Discussion
Soil characteristics
Soil organic carbon
As hypothesized, increased SOC values were found near the tree rows, which confirm the potential of AFS for belowground (0–23 cm) carbon-sequestration in arable fields. As also suggested by several authors including Bambrick et al. (Reference Bambrick, Whalen, Bradley, Cogliastro, Gordon, Olivier and Thevathasan2010), Cardinael et al. (Reference Cardinael, Chevallier, Cambou, Béral, Barthès, Dupraz, Durand, Kouakoua and Chenu2017) and Nair et al. (Reference Nair, Kumar and Nair2009), explanatory factors for the observed effects are considered to be the input of organic matter via tree leaf litterfall, and to a lesser extent via branchfall and (fine) root decomposition. The significant effect of distance to trees on SOC has also been observed in alley cropping fields by a.o. Wotherspoon et al. (Reference Wotherspoon, Thevathasan, Gordon and Voroney2014). In contrast, several authors have found a homogeneous increase near tree rows in the intercropping zone of alley cropping fields (Peichl et al., Reference Peichl, Thevathasan, Gordon, Huss and Abohassan2006; Bambrick et al., Reference Bambrick, Whalen, Bradley, Cogliastro, Gordon, Olivier and Thevathasan2010; Cardinael et al., Reference Cardinael, Chevallier, Barthès, Saby, Parent, Dupraz, Bernoux and Chenu2015), which was attributed to the limited interrow distances (8–15 m) on the fields. Cardinael et al. (Reference Cardinael, Chevallier, Barthès, Saby, Parent, Dupraz, Bernoux and Chenu2015) analyzed SOC in an alley cropping field near walnut tree rows of a height similar to the trees in our study. The authors observed an increase in SOC stock of 2.1 ton ha−1 (0–30 cm soil layer) in the intercropping zone when compared to sole cropping conditions, which is similar to the increase of 2.3 ton observed in our research. The average SOC accumulation rate of 115 kg C ha yr−1 observed by Cardinael et al. (Reference Cardinael, Chevallier, Barthès, Saby, Parent, Dupraz, Bernoux and Chenu2015) is considerably higher than the rate of 33 kg C ha yr−1 observed here, probably as a result of the abovementioned limited interrow distance. Similar to our results, reduced crop yields were observed near the tree rows (15% reduction between 1 and 2 m distance) on the fields studied by Cardinael et al. (Reference Cardinael, Chevallier, Barthès, Saby, Parent, Dupraz, Bernoux and Chenu2015) as measured by Dufour et al. (Reference Dufour, Metay, Talbot and Dupraz2013). As the authors suggested, this may have resulted in lower carbon inputs from crop residues, but this was assumed to be partly counterbalanced by an increased carbon input from tree fine root mortality as a result of the simultaneous increase in tree fine root density observed in the abovementioned zone (Cardinael et al., Reference Cardinael, Chevallier, Barthès, Saby, Parent, Dupraz, Bernoux and Chenu2015).
Soil nutrient conditions
The significantly higher soil nutrient concentrations indicate an increased nutrient availability for the agricultural crop in the arable zone near the tree rows. Similar to SOC, input via leaf litter is considered to be a major causal factor, although in the case of K, additional input may have resulted from nutrient-enriched throughfall water (Zhang, Reference Zhang1999; Meiresonne et al., Reference Meiresonne, De Schrijver and De Vos2007). In addition, the potential presence of an altered microclimate near tree rows due to increased shade and humidity and the input of organic material may benefit the soil meso- and macrofauna (Jose et al., Reference Jose, Gillespie, Seifert, Mengel and Pope2000; Souty-Grosset et al., Reference Souty-Grosset, Badenhausser, Reynolds and Morel2005). As suggested by Jose et al. (Reference Jose, Gillespie, Seifert, Mengel and Pope2000), this may result in a more favorable environment for decomposition, which could accelerate nutrient release. Finally, although no total biomass measurements were conducted for winter cereals and grain maize, the decreased crop yields near the trees may indicate that the higher soil nutrient concentrations partly result from a reduced crop uptake. However, this is not considered to be the sole determining factor, considering crop yields were also reduced near the treeless field edges, where no simultaneous increase in soil nutrient concentrations was found.
Functional biodiversity
Macro-detritivores
The increased abundance and species richness of woodlice in the tree rows are assumed to be related to the favorable habitat and refuge conditions such as increased food sources, shade and soil and air humidity (woodlice, like most detritivores, are drought-sensitive organisms) (Peng et al., Reference Peng, Incoll, Sutton, Wright and Chadwick1993; Souty-Grosset et al., Reference Souty-Grosset, Badenhausser, Reynolds and Morel2005; Smith et al., Reference Smith, Potts and Eggleton2008a, Reference Smith, Potts, Woodcock and Eggleton2008b; Dias et al., Reference Dias, Krab, Mariën, Zimmer, Cornelissen, Ellers, Wardle and Berg2013). This contrasts with the arable zone, where the agricultural management may create (strongly) adverse conditions for survival and reproduction. However, the favorable conditions in the tree rows may lead to a spill-over effect of woodlice out of the tree rows into the neighboring arable zone. This colonization effect may be augmented through the mitigation by the trees of adverse field conditions and the creation of a favorable microclimate, e.g., by the abovementioned input of organic matter, shade, etc. (Jose et al., Reference Jose, Gillespie, Seifert, Mengel and Pope2000). The effect on activity-density in the arable zone was, however, considerably smaller near the walnut trees in our research when compared to the results of Pardon et al. (Reference Pardon, Reheul, Mertens, Reubens, De Frenne and De Smedt2018a), where the effects of mature poplar rows on arthropod abundance were investigated. This may be related to the smaller size (both height and DBH) of the walnut trees and hence the more limited effect on microclimatic conditions in the arable zone (e.g., shade) in comparison to poplar.
The effect of tree row presence on the presence of millipedes appeared to be substantially smaller when compared to woodlice, which may be caused by the relatively higher drought resistance of millipedes when compared to woodlice (Edney, Reference Edney1977; Berg et al., Reference Berg, Soesbergen, Tempelman and Wijnhoven2008; Dias et al., Reference Dias, Krab, Mariën, Zimmer, Cornelissen, Ellers, Wardle and Berg2013). Particularly the open-habitat species Polydesmus inconstans, Cylindroiulus caeruleocinctus and Brachyiulus pusillus comprised approximately 96% of all millipedes caught in this study. This value is considerably higher than that of Pardon et al. (Reference Pardon, Reheul, Mertens, Reubens, De Frenne and De Smedt2018a), where the share of abovementioned species equaled 62% close to the poplar trees. This dissimilar tree effect might again be related to the smaller size of the walnut trees and hence a limited effect on the microclimate in the arable zone.
Carnivorous taxa
The higher abundances of carabids and rove beetles in the arable zone when compared to the field edge were unexpected, considering that the majority of natural enemies need non-crop habitats for hibernation and reproduction as well as alternative prey (Andersen, Reference Andersen1997; Landis et al., Reference Landis, Wratten and Gurr2000). Although surprising, these findings were nonetheless similar to the observations of Pardon et al. (Reference Pardon, Reheul, Mertens, Reubens, De Frenne and De Smedt2018a). As suggested in the latter research, the increased activity-density values in the field may be the result of a potential redistribution of both carabids and rove beetles from perennial (woody) refuges into the field early in the season (Desender, Reference Desender1989; Riedel, Reference Riedel1991; Dennis et al., Reference Dennis, Thomas and Sotherton1994; Pfiffner and Luka, Reference Pfiffner and Luka2000; Geiger et al., Reference Geiger, Wäckers and Bianchi2009). The colonizing movement of these often highly mobile arthropod species may be driven by factors such as the presence of higher prey densities in the crop or a preference for open habitat conditions (Fournier and Loreau, Reference Fournier and Loreau2001; Thomas et al., Reference Thomas, Holland and Brown2002; Marrec et al., Reference Marrec, Badenhausser, Bretagnolle, Börger, Roncoroni, Guillon and Gauffre2015). However, given the timing of the monitoring period (May–June), this early-season colonization may potentially not have been detected. Several of the observed carabid species (Pterostichus melanarius and Nebria brevicollis, amongst others) and rove beetles are known to actively prey on pest species in cereals and sugar beet such as aphids (Aphidius spp.) (Sunderland and Vickerman, Reference Sunderland and Vickerman1980). The higher activity-density values of carabids in the field zone near the trees when compared to the zone near the treeless field edge may indicate the potential beneficial effect of tree presence on carabid abundance and hence on natural pest control. However, considering the abovementioned high mobility of these arthropods, these values might also result from migrating movements, driven, for example, by differing prey densities. Therefore, it remains difficult to estimate the actual contribution of tree presence to this observed increase.
Crop yield and quality
The observed variation in crop yield can be explained by the interaction between tree row presence and distance to the field edge for winter wheat, triticale, grain maize and sugar beet. The variation in crop yield of winter barley can be explained by tree row presence and distance from the field edge. In temperate AFS, competition for light (Reynolds et al., Reference Reynolds, Simpson, Thevathasan and Gordon2007), water (Miller and Pallardy, Reference Miller and Pallardy2001; Graves et al., Reference Graves, Burgess, Palma, Herzog, Moreno, Bertomeu, Dupraz, Liagre, Keesman, van der Werf, de Nooy and van den Briel2007) and/or nutrients (Gillespie et al., Reference Gillespie, Jose, Mengel, Hoover, Pope, Seifert, Biehle, Stall and Benjamin2000; Jose et al., Reference Jose, Gillespie, Seifert, Mengel and Pope2000) is considered to be the main factors through which trees influence crop yield. Our results indicate that competition for nutrients can be assumed to be of minor importance for the observed yield losses. Nonetheless, the input of walnut leaf litter also constitutes a source of allelochemicals such as juglone, phenolic acids, flavonoids and terpenes which are known to negatively impact the growth of some neighboring crops (Terzi, Reference Terzi2008; Cui et al., Reference Cui, Cai, Jiang and Zhang2011; Wang et al., Reference Wang, Xu, Hu, Rehman, Chen, Li, Ding and Hu2014), as described, for example, in case of maize by Jose and Gillespie (Reference Jose and Gillespie1998). In addition, depending on a.o. tree and crop species (Reynolds et al., Reference Reynolds, Simpson, Thevathasan and Gordon2007) and spatial layout (Luedeling et al., Reference Luedeling, Smethurst, Baudron, Bayala, Huth, van Noordwijk, Ong, Mulia, Lusiana, Muthuri and Sinclair2016), differences in light and water availability may cause considerable variation in crop yield in AFS.
To limit tree–crop competition, winter crops are often favored over spring crops in temperate AFS because of the smaller overlap in growing season and hence in resource needs (Gill et al., Reference Gill, Singh and Kaur2009; Artru, Reference Artru2017). This is above all the case if combined with (deciduous) tree species characterized by a late budburst such as walnut (Dufour et al., Reference Dufour, Metay, Talbot and Dupraz2013). Indeed, yield reductions were lowest for winter cereals when compared to grain maize and sugar beet in the immediate vicinity of the trees (<20 m). In similar research, investigating the yield of winter cereals in AFS, this yield loss was attributed to a.o. reduced seed germination, lower grain number per ear and bad grain filling (Chauhan et al., Reference Chauhan, Brar and Sharma2012; Dufour et al., Reference Dufour, Metay, Talbot and Dupraz2013; Artru et al., Reference Artru, Garré, Dupraz, Hiel, Blitz-Frayret and Lassois2016). The reduced grain yield of winter cereals is partly compensated by an increased protein concentration near the trees. This was also observed by Artru et al. (Reference Artru, Garré, Dupraz, Hiel, Blitz-Frayret and Lassois2016) where the application of artificial shade was linked to smaller wheat grain sizes with, as a result, remobilization of N accumulated by the plant leading to a relatively higher grain protein concentration. Remarkably, at distances farther from the field edge (20 m and beyond), yield levels of winter wheat within the transects perpendicular to the tree rows regularly exceeded the yield levels within the control transects. As a consequence, the overall yield reduction observed for winter wheat was quite low and this phenomenon may be related to the creation of a favorable microclimate resulting from tree presence characterized by, for example, lower wind stress, resulting in reduced evapotranspiration and higher soil moisture content (Cleugh, Reference Cleugh1998; Thevathasan and Gordon, Reference Thevathasan and Gordon2004; Smith et al., Reference Smith, Pearce and Wolfe2012b). However, no such increase in crop yield was observed at farther distances into the field for winter barley and triticale. The observed decrease in DM concentration of winter barley and triticale samples near the tree rows has also been observed by other authors in case of winter wheat (Chauhan et al., Reference Chauhan, Gupta, Walia, Yadav, Chauhan and Mangat2011; Artru, Reference Artru2017), where this was attributed to a delay in physiological maturity and/or ripening of the crop near the tree rows. In addition, harvesting of wheat and/or barley was not started before noon, as is common practice in north-western Europe to allow the evaporation of humidity originating from the nocturnal fog. The aim is to increase the DM concentration of the grain. However, this evaporation may have been hampered near the tree rows as a result of potential reductions in wind speed and increased shading. These heterogeneities at the field level might potentially be overcome by postponing the harvest activities to a later time in the growing season as well as harvesting at later times of the day (Pardon et al., Reference Pardon, Reubens, Mertens, Verheyen, De Frenne, De Smet, Van Waes and Reheul2018b). The observed increase in DM concentration of the wheat samples near the tree rows in our research (in comparison to farther into the field) probably results from a sheltering effect of the tree crown, as the experimental fields with wheat were subject to rainfall during the morning of the day of harvest.
Sugar beet, a spring crop, displays a significant overlap of its growing season with the tree component. This results in simultaneous demands for resources (e.g., light, water) in time and space (Artru, Reference Artru2017). With an overall reduction of 14.8%, this yield loss is three times higher than the loss observed for winter wheat. The relatively strong effect of tree presence on root yield of sugar beet is in accordance with the findings of Artru (Reference Artru2017), who performed an artificial shade experiment mimicking shade regimes of hybrid walnut. Thereby, reductions of root yield up to 73% were observed depending on shade regime and, similar to our research, an increase in shoot:root ratio as well as petiole length. Although similar detrimental effects on beet yield were observed by Mirck et al. (Reference Mirck, Kanzler, Boehm and Freese2016) near tree rows (3 m) when compared to control levels, increased yields were observed farther from the trees (>12 m), which was attributed to the beneficial effect of tree presence on microclimatic conditions. This could not be confirmed in our research, however, with yield levels at the farthest distance (30 m) approaching but not surpassing control levels.
The largest effects on crop yields were found for grain maize near the trees (<10 m). The potential detrimental effect of trees on grain maize yield was also observed by Gillespie et al. (Reference Gillespie, Jose, Mengel, Hoover, Pope, Seifert, Biehle, Stall and Benjamin2000), Peng et al. (Reference Peng, Zhang, Cai, Jiang and Zhang2009), Reynolds et al. (Reference Reynolds, Simpson, Thevathasan and Gordon2007). Grain maize is a spring crop, but also uses the C4 pathway of photosynthesis and hence becomes light saturated at near full sunlight, whereas C3 plants (e.g., wheat, beet) become light saturated at 50% of full sunlight. As a result, net assimilation (or ultimately crop growth or yield) of grain maize generally is considerably more susceptible to tree shading when compared to C3 plants (Reynolds et al., Reference Reynolds, Simpson, Thevathasan and Gordon2007).
Synergies and trade-offs in ES delivery
In an agricultural context, an increase in biodiversity, regulating and supporting ES is often considered as a trade-off with the provisioning ES (Foley et al., Reference Foley, Defries, Asner, Barford, Bonan, Carpenter, Chapin, Coe, Daily, Gibbs, Helkowski, Holloway, Howard, Kucharik, Monfreda, Patz, Prentice, Ramankutty and Snyder2005; Power, Reference Power2010; Torralba et al., Reference Torralba, Fagerholm, Burgess, Moreno and Plieninger2016). The simultaneous enhancement of the former variables was confirmed in our research near tree rows with walnut, although the observed beneficial effect on abundance and diversity of arthropods was mainly restricted to the macro-detritivorous taxa under study. Crop yield was reduced near the trees and lowest yields were found where the largest increase in SOC, nutrients and presence of macro-detritivorous arthropods was observed. This may confirm the abovementioned trade-off.
However, in contrast to several other environmental measures (e.g., input reductions), a primary concept of AF is that the tree strips maintain a production function (e.g., wood, fruit) and hence contribute to the (overall) provisioning service of AFS. In the case of walnut, the production of the tree component entails nuts and wood. The nuts produced by the trees in this study are not marketed due to their small size and the limited total volume of production, resulting in an insufficient quality and quantity for cost-effective marketing. Although nut production indeed varies with tree variety and management, Oosterbaan (Reference Oosterbaan2015) estimates an average annual nut production of walnut trees in the Netherlands of 5 and 10 kg tree−1 after 10 and 20 yr, respectively. A final annual production of at average 18 kg tree−1 is reached after 30 yr. On the other hand, walnut trees may produce high-quality wood of which prices went up to €676 m−3 on the regional wood markets in 2016 (Bosgroepen, 2018). Although this value will again be affected by the specific tree variety and management (e.g., high pruning), as a rule of thumb, 1 m3 tree−1 of high-quality walnut wood (including root wood) can be obtained after 50 yr (Oosterbaan, Reference Oosterbaan2015). Therefore, when properly managed, revenues from nuts and wood of walnut trees in AFS may at least partly remunerate the loss in financial revenues associated with the potential reductions in crop yield. Further optimization of this provisioning service of the tree component may be achieved by integrating the production of additional (agricultural) goods in the woody strips (i.e., berry-producing shrubs, vegetables, poultry, etc.). The resulting high diversity of agricultural production may furthermore contribute to increased resilience against fluctuations, for example, in production costs and market prices (Liebman and Schulte-Moore, Reference Liebman and Schulte-Moore2015) and climate variability or extreme climate events (Altieri et al., Reference Altieri, Nicholls, Henao and Lana2015; Lin, Reference Lin2011).
Conclusions
Increased SOC, soil nutrient concentrations and presence of macro-detritivorous arthropods were found in the vicinity of the tree rows in our research. In contrast, decreased crop yield and altered crop quality were observed near the trees. The lowest yields were found where the largest increase in SOC, nutrients and presence of macro-detritivorous arthropods was observed, which may seem to confirm the trade-off between the enhancement of biodiversity, supporting and regulating ES and provisioning ES in agricultural systems. Since the tree rows in AFS maintain a production function, this loss in crop yield may, however, at least partly be compensated by alternative revenues from the tree component (e.g., wood, fruit).
Author ORCIDs
P. Pardon, 0000-0002-2836-9198
Acknowledgments
The doctoral research of P. Pardon is supported by Flanders Innovation & Entrepreneurship (VLAIO grant number 135068). We would furthermore like to thank the following people who contributed to this research: H. Willems; J. Stas; P. Jacquet; M. Levenson; G. de Smet; W. De Moerlooze; P. De Bruycker; J. Walraet; L. de Jaeger; E. De Clerq; P. Berckmoes; K. De Mey; P. De Smedt; W. Proesmans; E. Stassen and S. van de Poel.
Appendix
Table A1. Climatological data for the region under study during the years of monitoring (data from nearby weather station at Uccle, Brussels) (KMI, 2019b)

Table B1. Crop rotation and fertilization on experimental fields

Table B2. Application of crop protection agents

Table C1. List of sampled species for woodlice (Isopoda), millipedes (Diplopoda) and carabids (Coleoptera: Carabidae). Total number of each species caught is given for each sampling distance and type of field edge (tree row vs treeless edge). ‘T+’: field edge with tree row, ‘T−’: treeless field edge


