Introduction
When nutrient imports exceed exports on dairy farms, nutrient loss to the environment is a typical result. The nitrogen (N) balance on dairy farms is largely a function of N imported in both fertilizer and feed and N exported in milk and other products. Only 16–36% of cow dietary N is commonly exported as milk (Powell et al., Reference Powell, Gourley, Rotz and Weaver2010). In a reversal of the trend during the 20th century, during the first two decades of the 21st century an increasing number of US mid-Atlantic region dairy farms are utilizing grazing rather than confined feeding systems, largely because gazing systems require less capital investments and are often more profitable (Johnson et al., Reference Johnson, Hanson, Gilker, Lichtenberg and Minegishi2014). Concerns over N loss have focused on leaching to groundwater, especially in grazing systems, where dairy cows directly release urine and manure onto pasture. Surface runoff (dissolved or attached to sediment) is not usually a major pathway for N transport to streams from well-managed grazing land, in part because perennial pasture vegetation limits runoff and soil erosion (Owens et al., Reference Owens, Van Keuren and Edwards1983; Van Doren et al., Reference Van Doren, Burlison, Gard and Fuelleman1940). In simulated grazing, manure applications on fescue plots produced low concentrations of N in runoff (Edwards et al., Reference Edwards, Larson and Lim2000).
The direct deposit of urine by grazing animals continues to be of great concern because urine contains almost 80% of excreted N. Variability in the surface area of urine patches, the volume of soil volume affected, and the seasonal and climatic hydrologic characteristics make it difficult to predict how much urine N is likely to be taken up by pasture plants and how much is likely to be lost by leaching and other processes (Selbie et al., Reference Selbie, Buckthought and Shepherd2015). Several studies have suggested that deposition of soluble N in urine on fertilized, grazed pasture leads to very high levels of leachate N leaching with nitrate-N concentrations in the range of 5–25 mg L−1 (Ryden et al., Reference Ryden, Ball and Garwood1984; Macduff et al., Reference Macduff, Jarvis, Roberts and Calvet1990; Barraclough et al., Reference Barraclough, Jarvis, Davies and Williams1992; Owens et al., Reference Owens, Edwards and Van Keuren1992; Ruz-Jerez et al., Reference Ruz-Jerez, White and Ball1995; Hack-ten Broeke et al., Reference Hack-ten Broeke, de Groot and Dijkstra1996; Cuttle et al., Reference Cuttle, Scurlock and Davies1998; Shepherd et al., Reference Shepherd, Welten and Ledgard2009; Cichota and Snow, Reference Cichota and Snow2009; Cichota et al., Reference Cichota, Vogeler and Snow2010; Cichota Reference Cichota, Snow and Vogeler2013).
These studies do not represent the conditions of mid-Atlantic grazing dairies. Done in the UK and New Zealand, field studies used fertilizer applied at up to 400 kg N ha−1, rates more appropriate for hay than grazed pasture production. Even with intensive management and split applications, use of N fertilizer results in losses to groundwater (Vogeler et al., Reference Vogeler, Lucci and Shepherd2016). Maryland recommendations call for little to no N fertilizer on grazed pastures with grass/legume mixes (Greene, Reference Greene1998; Coale, Reference Coale2002).
Other studies used lysimeters that measure leachate rates from the column, but not from the larger system. In Pennsylvania, Stout et al. (Reference Stout, Fales, Muller, Schnabel, Priddy and Elwinger1997, Reference Stout, Fales, Muller, Schnabel and Weaver2000a, Reference Stout, Fales, Muller, Schnabel, Elwinger and Weaver2000b) used monolith lysimeters to estimate nitrate leaching from grazing, suggesting resulting groundwater nitrate-N concentrations of 15–20 mg L−1 even at relatively low stocking rates of 350–500 animal unit days per hectare per year. These results, too, may not accurately represent N leaching under grazing, as monolith lysimeters may promote preferential flow and artifact hydraulic conditions (Cameron et al., Reference Cameron, Smith, McLay, Fraser, McPherson, Harrison and Harbottle1992). Because they were installed with a lip above ground, lysimeters such as those used by Stout et al. (Reference Stout, Fales, Muller, Schnabel, Elwinger and Weaver2000b) may prevent the applied urine from spreading and cause momentary ponding that stimulates preferential flow and results in exaggerated estimates of N leaching potential. While urine may reach only 2–3% of the surface during a single day's grazing event, its effects below the surface may extend much further, a factor not captured from monolith lysimeter studies.
To determine nitrate concentrations in shallow groundwater and soil pore water, this study was carried out over 3 yrs on three well-managed dairy farms in Maryland under grazed pastures and manured crop fields. This was done to characterize the water quality impact of management-intensive grazing (MIG) and to test the hypothesis that MIG causes groundwater nitrate levels that far exceed the United States Environmental Protection Agency (EPA) maximum contaminant level of 10 mg L−1 [Code of Federal Regulations (CFR) §130.7].
Materials and Methods
Site selection
The three Maryland dairy farms, herein designated Grazed 1, Grazed 2 and Confined, were specialized dairy operations for at least 30 yrs and included livestock for at least 100 yrs prior to the study (Table 1). Grazed 1 and 2 had been managed as MIG farms for 6 and 7 yrs, respectively. The Confined farm uses a conventional feeding system and began using no-till management as a soil conservation practice on its cropland in 1962.
Table 1. Selected characteristics of the three study farms.

Production attributes are based on averages from 2001 to 2003.
1 Cow breed varied among farms.
2 AU = animal units of 454 kg (or 1000 lbs).
3 AUD per ha = days of grazing by milk cow herd. Does not include heifers or calves. Assumes cows graze 365 days yr−1.
The grazing farms were selected from a very small pool of existing MIG farmers in Maryland. The two farmers were among the earliest adopters of MIG in Maryland, increasing the likelihood that their soils had approached steady-state conditions and that the farmers had developed successful and consistent management systems. The confined farm was chosen because of its proximity to one of the MIG farms, with similar soils and topography, and because the farmer had a long collaboration with Maryland Cooperative Extension and USDA (United States Department of Agriculture) Natural Resources Conservation Service personnel and was an early adopter of conservation tillage and nutrient management planning, with personal dedication to improving soil health.
The three collaborating farmers allowed us to install, and regularly sample, nests of piezometers in two watersheds (also referred to as micro watersheds) on their farms, monitoring a subset of their fields or pastures that fell within a single water catchment area, and shared their financial and nutrient management records for economic and nutrient balance analyses (Gilker, Reference Gilker2005).
Grazed 1 and Confined occupy adjacent tracts of land in Frederick County, Maryland, in the lowland section of the Piedmont Plateau physiographic province, where the average precipitation is 1026 mm, and average annual temperature is 13°C (Maryland State Archives). Grazed 2 is located in eastern Baltimore County, Maryland, in the upland section of the Piedmont Plateau physiographic province, where the average precipitation is 1039 mm, and average annual temperature is 13°C (Maryland State Archives). Its soils overlay a Cockeysville marble (Cleaves et al., Reference Cleaves, Edwards and Glaser1968).
Grazed 1 and 2 provide the dietary energy needs of the herd primarily through grazed forage consisting of a mix of forage grasses dominated by orchardgrass (Dactylis glomerata L.) and legumes [dominated by white and red clover (Trifolium repens L. and Trifolium pretense L.)]. Legumes represented 8% of the forage on Grazed 1 and 24% on Grazed 2 (Table 1). On these farms, hay is made to store excess forage for winter feed. Additional hay may be purchased when on farm hay production is insufficient to support the herd through the winter. Relatively small quantities of purchased supplemental grain are imported to the farm. Grazed 1 cows received grain supplements at 3.6 kg cow−1 day−1 (roughly 1% of body mass) since 1999. Grazed 2 cows received grain supplements at 3.6–6.8 kg cow−1 day−1 during 2001–2002 and 3.6 kg cow−1 day−1 from 2003 onward. Grazed 1 did not use any fertilizer during the study period. Grazed 2 applied <20 kg N ha−1 every other year, mainly as a carrier for 1–2 kg B ha−1.
The confined farm produced crops in a 6-yr rotation of corn/corn–oats/alfalfa/alfalfa/alfalfa (corn, Zea mays L.; oats, Avena sativa L.; alfalfa, Medicago sativa L.) (Table 1). Confined A was in corn throughout the study, and Confined B was in alfalfa during the first year of the study and then corn. Additional feed and bedding was purchased to support the herd. Liquid manure from the herd was sprayed on the cropland surface according to a Maryland Extension-approved nutrient management plan to supply approximately 150 kg N ha−1 to corn silage. Supplemental fertilizer, at 56 kg N ha−1, is used when needed, mostly on the corn fields. Information on nutrient imports (fertilizers, purchased manure, legume fixation, feed, bedding, seed and atmospheric deposition) and exports (sold dairy milk, animals, manure, as well as estimated volatilization) was used to develop a nutrient balance for each of the three farms, to determine if there was a net excess or deficit of N on the farm.
Within each farm, two watersheds, identified as A and B, were selected for groundwater monitoring using piezometers. The watersheds were chosen because the majority of the land within each watershed was under the management of the farmer, and based on topography surveyed suggested that the groundwater would be within the reach (8 m) of the drilling equipment available to the project. In each pair of watersheds from a given farm, one watershed was determined to be the ‘homestead’ watershed, which historically (100+ yrs) received a greater proportion of nutrients from manure because of its close proximity or convenience to the barn and homestead. The three homestead watersheds (designated ‘home’) were Confined A, Grazed 1A and Grazed 2B. The other watershed on each farm was designated ‘away’. One control piezometer was installed on each farm in areas of natural forest vegetation upslope of the farm management activities, to measure the baseline nitrate N concentration levels in groundwater coming onto the farm. The upslope control piezometers were drilled as deep as our equipment would allow, but except for the control at the upper watershed boundary on Grazed 2 (watershed A), they were deep enough to provide only sporadic access to groundwater.
Soil characteristics
Soils on Grazed 1 and Confined have primarily silt loam surface horizons. The principal soils mapped are found in Table 1 (USDA/NRCS, 2015). In the uppermost 15 cm, soil pH was 7.2 in Confined A and 6.7 in Confined B. Grazed 1 had pH levels of 6.6 and 6.0, while Grazed 2 ranged from 6.6 to 6.7. The percent organic matter in the upper 15 cm of soil profiles was between 2 and 3.4% in the Grazed 2 watersheds, and 3.6 and 5% in Grazed 1A and 1B, respectively.
A tipping bucket rain gauge (Spectrum Technologies; Plainfield, IL) was installed within or near each watershed. The rain gauge closest to the farmer's house or barn was supplied with a digital display that could be viewed and recorded by the farmer, and the rain gauge in the watershed farther from the homestead was connected to a downloadable datalogger (HOBO® Shuttle and event logger; Onset Computer Corporation; Pocasset, MA). Recording by the farmers was not consistent and was influenced by their work schedules. If rain data were available from the neighboring farm, it was used if one farm did not have rain data for a period of time. In the rare cases that the recording monitor or rain gauge was not operative and the farmer's records were not complete, National Oceanic and Atmospheric Administration records from the nearest station were used.
Site preparation
In each watershed, a transect of nested piezometers was installed consisting of three nests spaced 18 m apart, starting at the watershed discharge point (nest a) and following the flow line upslope (nests b and c). Three piezometers initially were installed within each nest. The piezometers were made of 5 cm inner diameter polyvinylchloride pipe. The deepest 1 m of each piezometer was slotted. The piezometers were installed in the spring of 2001, when groundwater levels were beginning their seasonal decline. The shallowest of the three piezometers was installed to a depth where it could just reach the groundwater at the time of installation, with the next two piezometers installed approximately 1 and 2 m deeper. The most shallow piezometer depths within each nest ranged from 1 to 3 m and the deepest ranged from 5 to 6.6 m. A fabric filter sock (Drain-Sleeve® Fabric Sock; Carriff Corporation, Inc.; Midland, NC) was fitted over the 1 m of slotting at the bottom of each piezometer and taped in place. Clean sand was poured into the installation hole around the piezometer. A plug of bentonite powder (Wyoming Bentonite for Water Well & Geotechnical Sealing; Drillers Service, Inc.; Hickory, NC) was used around the upper 30 cm of each piezometer to prevent flow around the wall of the piezometer or down the installation hole. A hinged, slatted wood box 0.9 m × 0.9 m × 0.15 m high was installed over each nest to protect the tops of the piezometers from farm equipment and grazing cows.
Extreme drought conditions in 2001 caused groundwater levels to drop below the reach of the deepest piezometers in two of the watersheds. Because the lack of recharge during the winter and spring of 2002 suggested that future sampling might also be limited, a fourth, 1 m deeper piezometer was added in each of the affected nests in October 2002. The presence of multiple piezometers was designed to allow collection of the shallowest groundwater at each site.
Within each nest box, ceramic tipped suction lysimeters (Irrometer Company, Inc.; Riverside, CA) were installed to allow collection of soil pore water. Lysimeters were installed at a 45° angle to the surface of the ground, using a drop hammer device to make the pilot hole in soil. The two 2.5 cm diameter lysimeters, one 90 cm and the other 120 cm long, were installed with the tops of the lysimeters within the wooden nest box, and the ceramic tip end extending below ground into surrounding pasture or field, so as to place the ceramic tip 60 or 90 cm below the soil surface and at least 30 cm outside of the box.
Groundwater sampling
Groundwater samples were collected biweekly, beginning in May 2001. Prior to sampling, the depth to groundwater in each piezometer was measured using a water depth indicator. The shallowest piezometer in each nest containing at least 1 m of groundwater was bailed. After approximately 2 h, samples of 120–150 mL were taken from the bailed and refilled piezometers. The pH of each sample was measured, and the sample was acidified to pH<3 with 2–3 drops of 4 M H2SO4. The samples were returned to the laboratory on ice, where they were stored under refrigeration at 4°C until analysis.
Soil pore water sampling
Whenever soil moisture allowed, soil pore water samples were collected from the ceramic tipped suction lysimeters at the time of groundwater sampling by applying an 80 kPa vacuum on the lysimeter for at least 4 h. This occurred 11 times on each farm between June 2002 to June 2004, mainly in the fall and spring months for a total of 26 sampling dates. The lysimeter water samples were acidified with 4 M H2SO4, with one drop added for every 30–50 mL of sample. Samples were transported on ice to the laboratory, where they were refrigerated until analysis.
Soil sampling and analysis
Two to four soil profiles from distinct topographic areas (e.g., summit, shoulder, back slope and toe slope) within each watershed and within 200 m of each transect were observed, described and sampled in the spring of 2002 and 2003. Soil profiles were sampled using a bucket auger and described in the field with regard to color, texture and other morphological features. A composite sample of the upper 15 cm of soil was collected in each landscape unit with a hand-held corer. The composite samples and samples from each augured horizon were taken to the laboratory in sealed plastic bags on ice, where they were spread out and air-dried. Subsamples were ground and analyzed for total C, H and N by high-temperature combustion (CHN 2000, LECO Corporation; St. Joseph, Michigan; Campbell, Reference Campbell1992). Samples were also analyzed for pH (1:1 in water), percent organic matter (loss on ignition) and Mehlich 1 extractable, Mg, P, K and Ca (Northeast coordinating committee on soil testing, 1995). Mineralizable N was determined using a 16-day aerobic incubation (Sainju et al., Reference Sainju, Singh and Yaffa2002). Data are not shown in this paper.
Soluble soil N in these profile samples was estimated by extraction with 0.5 M K2SO4. Three grams of dried, ground and sieved soil were shaken with 30 mL of extractant for 30 min at 100 rpm, then centrifuged for 10 min at 3000 rpm, and then filtered (No. 42 Whatman filter paper), and refrigerated for no more than 24 h before being analyzed for nitrate as described below. The standards used for comparison were filtered nitrate standards in 0.5 M K2SO4.
Laboratory analyses of water
Water samples were filtered under vacuum through 0.2 µm filters (polycarbonate membrane, Nuclepore® Corporation Filtration Products; Pleasanton, CA). A fresh membrane was used for each sample, and the filter apparatus was rinsed with distilled water between samples. Once filtered, samples were transferred to fresh sample cups and stored at 4°C unless not analyzed within 14 days, in which case long-term storage was at <−15°C. Frozen samples were brought to room temperature (approximately 22–23°C) before analysis.
Filtered samples were analyzed for NO3-N using a Technicon Autoanalyzer II flow injection analyzer (Technicon Industrial Systems; Tarrytown, NY) with a cadmium reduction column and a 2:1 distilled water dilution loop at a rate of 30 samples h−1 (Technicon AutoAnalyzer II, 1977). Standard NO3-N solutions in the concentration range of 0–25 mg L−1 were prepared from KNO3. To bring the samples to within the necessary pH range for use in the Autoanalyzer (5–9), 0.5 mL of 0.1 M NaOH in 10% sodium acetate was added to each. This buffer had no colorimetric effect on the procedure, but its dilution effect was included in the calculation of NO3-N concentration.
Ammonium-N concentration was determined using an Orion 9512 ammonia-specific gas sensitive electrode (Banwart et al., Reference Banwart, Tabatabai and Bremner1972). One milliliter of 5 M NaOH ionic strength adjusting (ISA) solution with pH color indicator was added to 10 mL of sample to bring the sample pH to >13. A Teflon-coated stir bar was added, the sample vial placed on a magnetic stirrer, and the electrode was then lowered into the sample for a reading. When the change in mV slowed to <1 mV s−1, the mV reading was recorded for samples and ammonium N standards (0, 0.1, 1, 10 mg L−1) and a logarithmic standard curve constructed.
Drainage and groundwater flow determination
Drainage was calculated for each of the targeted watersheds using the WATBAL model (Starr, Reference Starr, Kleemola and Forsius1999; Vinten, Reference Vinten1999), a monthly water balance model which uses inputs of temperature, slope, vegetative cover, rainfall and cloud cover to estimate evapotranspiration, changes in soil moisture, runoff, and finally, drainage. WATBAL determines the monthly balance based on the inflow of precipitation, and outflows and flux of evapotranspiration, drainage and soil water storage. The model is based on the equation:
 $${\rm P} = {\rm ET} + {\rm R} \pm \Delta {\rm SM}$$
where P is the precipitation, ET is the evapotranspiration, R is the runoff, and SM is the soil moisture. Evapotranspiration is determined from insolation based on a global radiation submodel, rather than on temperature alone (Starr, Reference Starr, Kleemola and Forsius1999).
Temperature and cloud cover data were taken from Maryland Archives (Maryland State Archives, online). Rainfall data were collected from the rain gauges on the farms, with additional information from local climatological data stations. Large-scale (1:1200) topographic maps were made to determine the boundaries, slope, slope aspects and area of each watershed. In using the model, we assumed that runoff was negligible, and that all other inputs were accurate as collected from on-site and local stations.
Statistical analyses
Statistical analyses for nitrate-N concentrations were conducted on data from samples collected from June 2001 through June 2004. Due to the extreme dry conditions that occurred during the first leaching period, groundwater was not available in two of the grazed watersheds until October 2002 (Grazed 1B and 2B), and analyses including those watersheds cover the period from October 2002 to June 2004. Therefore, data were grouped for statistical analyses in two ways: (1) beginning in October 2002, when piezometers in all six watersheds provided groundwater; (2) beginning in July 2001, when piezometers in four of the watersheds provided groundwater. In addition, to test the effect of watershed proximity to the homestead and barns (see above), the data beginning in October 2002 were classified as being from either ‘home’ or ‘away’ watersheds.
The data on nitrate-N concentration in water samples were analyzed using repeated measures general linear model (SPSS, 1998). The seasonal average for each period of sampling (e.g., Winter 2002, Spring 2002 and Summer 2002) for each piezometer nest within each watershed was used to avoid pseudoreplication over time. The model included effects of farm, piezometer nest and watershed nested within farm and season. Originally, the rainfall between sampling dates and sample pH were considered as covariates in the analysis, but were removed because they were not significant. An analysis of variance (ANOVA) was also run for nitrate in pore water (lysimeter samples) after log transformation, using the effects of watershed and sample depth. The model used to analyze soil pore water nitrate was different than that used for groundwater because of the limited number of samples from each farm (11), and the limited number of sampling dates overall (26).
To test the hypothesis that groundwater nitrate-N concentrations from grazed watersheds would greatly exceed the 10 mg L−1 EPA standard, one tailed t-tests were performed using watershed and season as grouping factors. Because of the drought and resulting interruption in sampling, separate t-tests were carried out for the watersheds sampled without interruption from July 2001 to June 2004 and for all six watersheds from October 2002 to June 2004.
Results and Discussion
Groundwater and pore water nitrate
From May 2001 to March 2002, Maryland experienced a record-setting drought, with little to no groundwater recharge (Fig. 1). For almost a year following these extremely dry conditions, there was heavier than normal rainfall. During dry periods and through most of the growing season, plants take up both water and N, allowing little opportunity for nitrate leaching. Nitrate leaching is most likely during periods when precipitation exceeds evapotranspiration and groundwater recharge (Staver and Brinsfield, Reference Staver and Brinsfield1998).
Figure 1. Monthly precipitation for the two farm areas sampled in 2001–2004. Grazed 1 and Confined are in Frederick County, and Grazed 2 is in Baltimore County. Bars represent 30-yr average monthly precipitation for Maryland.
Under the study watersheds, groundwater nitrate concentrations were especially high when leaching followed dry periods, apparently flushing into the groundwater nitrate retained in the soil profile (Fig. 2). Similar nitrate flushing was reported by Tyson et al. (Reference Tyson, Scholefield, Jarvis and Stone1997) and Unwin (Reference Unwin, Kofoed, WIlliams and L'Hermite1986). The most notable nitrate concentration peaks occurred in Fall 2002 and Winter 2003 (Fig. 3). Other observed fluctuations in nitrate concentrations were similar to seasonal variations reported in other studies, with greater nitrate levels in wetter and colder months (Owens et al., Reference Owens, Edwards and Van Keuren1992; Hack-ten Broeke et al., Reference Hack-ten Broeke, de Groot and Dijkstra1996; Kolenbrander, Reference Kolenbrander and Brogan1981; Stout et al., Reference Stout, Fales, Muller, Schnabel, Priddy and Elwinger1997; Saarijarvi et al., Reference Saarijarvi, Virkajarvi, Heinonen-Tanski and Taipalinen2004).
Figure 2. Nitrate-N in shallow groundwater and depth to groundwater in six watersheds on three dairy farms from July 2001 to June 2004. Each measurement is an average of three samples collected from three piezometer nests within each watershed on one sampling date. The dotted line denotes the EPA maximum contaminant level of 10 mg NO3-N L−1.
Figure 3. Shallow groundwater nitrate concentrations from three farms for each watershed. Samples were collected biweekly from June 2001 to June 2004. Boxes represent the central 50% of values, with the notches denoting 95% confidence intervals. Asterisks represent the data within three times the interquartile range, and circles represent outliers. The dotted line denotes the EPA maximum contaminant level of 10 mg NO3-N L−1.
Even with elevated nitrate concentrations following drought conditions, groundwater under grazed pastures did not reach the excessively high levels previous research had predicted. Predictive models developed by Stout et al. (Reference Stout, Fales, Muller, Schnabel, Elwinger and Weaver2000b) predicted mean annual groundwater nitrate concentrations of 15 and 32 mg NO3-N L−1 for the grazed watersheds with the stocking rates found on the two MIG farms in the present study. Instead, the mean annual nitrate-N concentrations actually observed on the four MIG watersheds were between 4 and 7 mg L−1.
With all six watersheds included in the statistical model, the main effect of watershed on nitrate concentration was significant, with the highest concentrations on the Confined farm (Table 2, Fig. 4). Seasonal average groundwater nitrate concentrations in the two Confined watersheds ranged from 6.8 to 10.9 mg L−1 and exceeded the EPA maximum contaminant load during eight seasons in the study period (Fig. 3). The high nitrate-N levels in groundwater under manured cropland, even with the implementation of an approved nutrient management plan is in keeping with the observation of Angle (Reference Angle1990) that nitrate-N concentrations are expected to exceed 10 mg L−1 with high-yielding row crops under in Maryland conditions.
Figure 4. Shallow groundwater was sampled from six watersheds, two from each of three Maryland dairy farms. On all three farms, groundwater from the watershed nearer the barns had higher mean nitrate-N concentrations. Samples were collected from transects of nested piezometers biweekly from October 2002 to June 2004. Bars show SE.
Table 2. Repeated measures GLM F-values for effects on nitrate concentrations in shallow groundwater on dairy farms.

Different models were used depending on the portion of the data set considered.
1 The following watersheds were sampled from 2001 to 2004 without interruption: Confined A, Confined B, Grazed 1A and Grazed 2A.
2 Proximity model compares watersheds closer to and farther from the homestead or barnyard. Homestead watersheds are Confined A, Grazed 1A and Grazed 2B, those most likely to have received greater applications of manure nutrients historically.
3 Proximity refers to whether the watershed is considered to be a homestead watershed or a more distant watershed.
NI, not included in the model.
*, **, ***Significant at <0.05, 0.01 and 0.001 probability levels, respectively.
In contrast, seasonal average groundwater nitrate concentrations ranged from 3.4 to 8.2 mg L−1 on the four grazed watersheds, with two exceptions. The 95% confidence interval of groundwater nitrate concentrations under grazed watersheds were significantly below the United States Environmental Protection Agency maximum contaminant level except during two seasons of rapid groundwater recharge and heavier than normal precipitation levels: Winter 2003, when Grazed 1A averaged 9.6 mg NO3-N L−1, and Spring 2003, when Grazed 2B averaged 11.6 mg NO3-N L−1. Nitrate-N from the control nest upslope of Grazed 2A varied between 0.1 and 1.0 mg NO3-N L−1 throughout the study period.
Proximity to the barnyard or homestead affected nitrate concentrations on all three study farms. Homestead watersheds on Confined and Grazed 2 had concentrations almost double those of the ‘away’ watershed, while the homestead watershed on Grazed 1 had nitrate concentrations about 1.25 times those found on the ‘away’ watershed (Fig. 4).
Our study cannot determine whether the differences in concentration due to proximity result from historical or current management. The homestead-related difference in nitrate-N concentrations in Grazed 2 may have been related to the farmer's logistical constraints that lead him to graze the herd on the homestead watershed during the day and on the farther watershed through the night. It has been suggested that cows release more feces and urine during the day than during the night, possibly contributing to the higher concentrations found both in pore water and groundwater in Grazed 2B compared with Grazed 2A. On Confined, the lower part of the homestead watershed was planted in corn during the study, and the area's nearness to the barnyard combined with the N requirements for corn led to continued applications of manure to the area. The smaller difference between the two Grazed 1 watersheds may have been influenced from the fact that the low concentrations on the homestead watershed leave little room for an even lower concentration on a farther watershed.
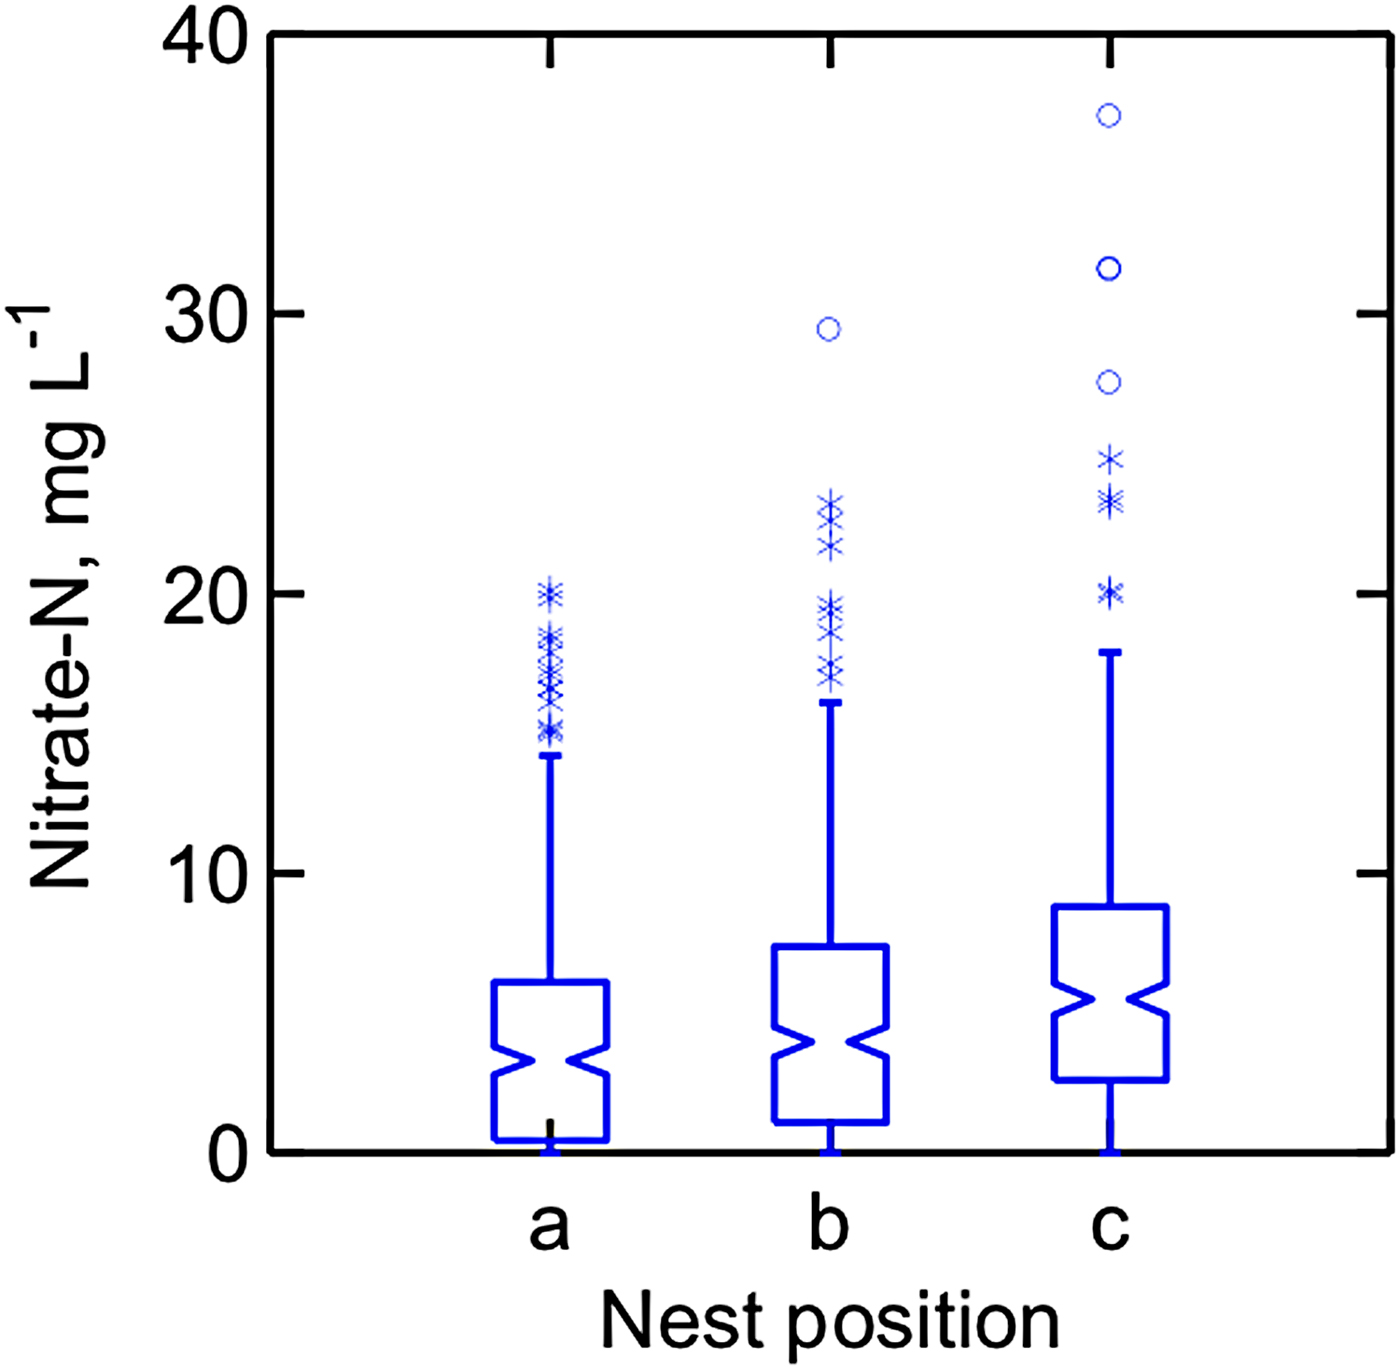
Nitrate-N concentrations fluctuated widely in the three piezometer nests in each watershed, with concentration spikes occurring in different nests within a watershed on a given sampling date. However, repeated measures analyses showed that the main effect of nest was significant, with groundwater sampled from piezometer nest ‘a’ (the watershed outlet) having the lowest mean nitrate N concentration and that from nest ‘c’ at the higher elevation having higher nitrate-N concentrations (Fig. 5). The opposite order of nitrate concentrations among the nests might have been expected on the basis of N accumulating as groundwater towards the watershed outlet. These results also contradict the commonly observed trend of greater nitrate-N concentration in more shallow groundwater (Craig and Weil, Reference Craig and Weil1993; Wheeler et al., Reference Wheeler, Nolan, Flory, DellaValle and Ward2015). The reasons for this deviation from the expected results are not known. Nonetheless, considering all groundwater samples in this study, all those with nitrate-N concentration >10 mg L−1 came from groundwater <3 m deep.

Figure 5. Nitrate-N concentrations were higher in piezometer nest c (father from watershed outlet) than in nest a (closest to watershed outlet). Boxes contain 50% of values and notches represent the 95% confidence interval.
Nitrate-N concentration in the soil pore water collected from approximately 120 cm deep in the six watersheds averaged from 0.2 to 8.0 mg L−1, with the lowest average in Grazed 2A, and the highest in Grazed 2B (Fig. 6). Analyses of variance on log transformed data did not show an effect of watershed, depth of sample or the interaction of the two.

Figure 6. Nitrate in pore soil water collected on 11 dates from April 2003 through June 2004 in six dairy farm watersheds. Samples were collected via ceramic tipped suction lysimeters installed under actively grazed or cropped watersheds. ANOVA was performed on log-transformed data; data shown are untransformed.
Groundwater ammonia
Groundwater ammonium-N concentrations averaged 0.4–0.5 mg L−1 in each of the six watersheds, with very little variation. There was no effect of watershed or depth of groundwater on ammonium-N concentrations (data not shown).
Soil nitrate
Based on a 16-day incubation, the upper 15 cm of soil from the six watersheds had 41.7–76.5 mg mineralizable N kg−1 (data not shown). The concentration of nitrate and mineralizable N in the soil was not affected by watershed or by farm. Most of the profiles had nitrate levels of 5–10 mg kg−1 in the surface soil (A and E horizons) or in the upper 30 cm.
Generally, concentrations of nitrate decreased with depth (data not shown). In Grazed 2, in both watersheds, profiles near the watershed outlet showed a bulge in nitrate-N concentration at approximately 1 m, where nitrate concentrations increased from approximately 1 mg kg−1 to more than 15 (Grazer 2A) or 5 (Grazer 2B) mg kg−1. The increase coincided with a horizon of coarser (gravelly) soil material that may have temporarily inhibited downward percolation and caused saturation of the overlaying finer-textured soil layers, resulting in a temporary perched water table above the coarser soils (Gilker, Reference Gilker2005). In the case of Grazer 1A profile 1, a buried A horizon was present just above the peak nitrate-N layer.
Groundwater N losses
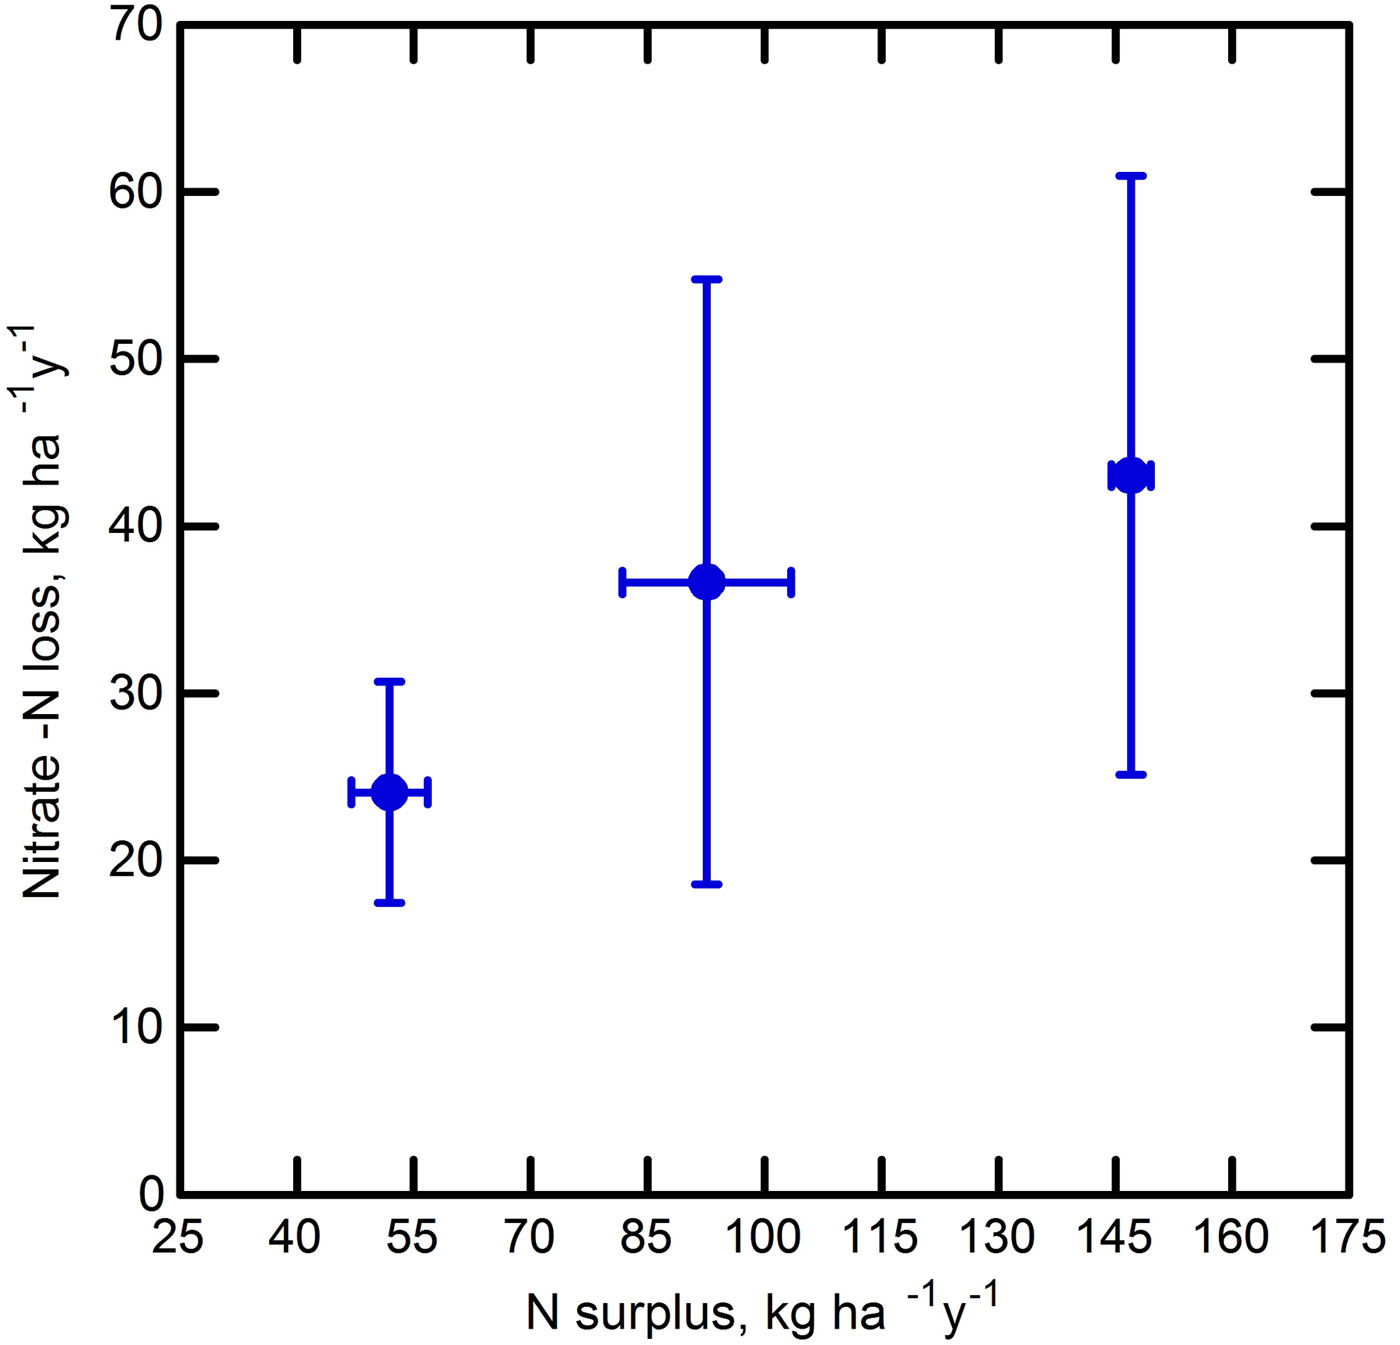
Using rainfall and weather data and the WATBAL model, drainage was calculated as 396–633 mm yr−1 in the Frederick County watersheds and 561–1099 mm yr−1 in the Baltimore County watersheds (Table 3). Based on average nitrate concentrations in the groundwater and calculated drainage for monthly periods, the farms annually exported between 17.5 and 61.0 kg nitrate-N ha−1. Farm surplus and export showed a non-significant (p < 0.17) regression trend, with an R 2 of 0.86 (nitrate loss = 0.0195 × surplus + 15.7) (Fig. 7). If export values were extrapolated to the whole farm, this could yield total yearly exports of 6147–14940 kg NO3-N from the 245 ha Confined and 1451–2546 kg from Grazed 1 (83 ha) and 1314–3890 kg from Grazed 2 (71 ha). The much higher nitrate-N concentration found in groundwater under Confined A compared with those under Confined B may stem from the proximity of Confined A to the homestead and barns and a resulting long history of greater manure applications prior to the start of Maryland Department of Agriculture-approved nutrient planning in 1990. Heavier manure application over many years because of convenience to the barns may have resulted in accumulated organic N that may still be mineralizing and producing leachable nitrate N. Confined B was planted in alfalfa during most of the study, while Confined A was in corn. It has been suggested (Owens et al., Reference Owens, Edwards and Van Keuren1994; Daliparthy et al., Reference Daliparthy, Herbert, Veneman and Steele1995) that alfalfa may reduce nitrate leaching compared with corn by taking up nitrate deeper in the profile and limiting the water available for leaching.

Figure 7. The trend observed between calculated N surplus and nitrate-N leaching losses to shallow groundwater on three Maryland dairy farms. Groundwater was sampled biweekly from shallow piezometers for 3 yrs (June 2001 to June 2004). Drainage data were calculated from WATBAL model and weather data for that period, and was used with measured nitrate concentrations in groundwater to calculate nutrient losses. Farm nutrient imports and exports were determined from 2001 to 2003 farm records. Surplus and losses shown are annual averages for measured periods, with standard error bars. Three farms is a very limited sample size, but the data support the analysis of farm N balance.
Table 3. Nitrate groundwater concentrations and exports.

Concentrations based on groundwater samples collected biweekly from October 2002 to June 2004. Export rates based on drainage and flow calculations from WATBAL model and weather data. The estimated total farm nitrate export is calculated from the mean groundwater nitrate, drainage and farm size. Farm surplus data are based on farm records and interviews with farmers. Surplus values are means for 2001–2003.
Three farms is a very limited sample, but the data support and lend credence to the analysis of N balance on the farms. Calculated N exports from the six watersheds were similar to the range of losses reported by others for grazed plots and monolith lysimeters. Cuttle et al. (Reference Cuttle, Scurlock and Davies1998) estimated annual exports of 2–46 kg NO3-N ha−1 from sheep-grazed plots, and Stout et al. (Reference Stout, Fales, Muller, Schnabel, Priddy and Elwinger1997) had predicted losses under grazing of 16.8–31.5 kg NO3-N ha−1 based in their monolith lysimeter studies. The estimated annual exports from the four grazed watersheds in this study were at the lower end of these measurements at 9.4–22.3 kg NO3-N ha−1, and were less than those reported from manured and fertilized corn (Jemison and Fox, Reference Jemison and Fox1994).
Conclusions
In 3 yrs of sampling, mean groundwater nitrate concentrations under grazed watersheds were far lower than predicted by the model of Stout et al. (Reference Stout, Fales, Muller, Schnabel, Elwinger and Weaver2000b) and were unlikely to exceed the EPA maximum contaminant level of 10 mg NO3-N L−1. Generally, the highest nitrate-N concentrations occurred during periods of leaching and groundwater recharge, especially when following a relatively dry period. Even with the extreme rise in groundwater levels due to a very wet year following a very dry year, seasonal average nitrate concentrations under MIG were within the EPA maximum contaminant level. Nitrate losses and exports from grazed land were lower than those from other agricultural land uses reported in the literature. The data may also be interpreted to assess the level of environmental risk per unit of milk produced in order to address the societal question of how to produce needed milk with the lowest water quality impact. In the present study 1.38 kg NO3-N Mg−1 milk produced was leached for Confined, compared with 2.28 and 1.69 kg NO3-N Mg−1 milk produced for Grazed 1 and 2, respectively.
This study of two MIG farms suggests what other projects have found, that MIG has potential as a Best Management Practice and as an alternative to confined feeding dairying, especially if grazing allows profitable dairy farming without herd sizes that require large imports of feed (Franzluebbers et al., Reference Franzluebbers, Paine, Winsten, Krome, Sanderson, Ogles and Thompson2012). There were limitations to the study; all three of the farms studied were well managed, which may have minimized overall environmental impacts. Additionally, sampling was limited to a single transect near the outlet of each studied watershed with a limited number of sampling events.
Real-world measurements are often prohibitively expensive in time and resources, and still subject to great amount of variability. The alternative of using models and monolith lysimeters may not reflect the whole picture. Changes in N held in the soil profile may provide clues as to future leaching or N storage under grazing. Our data suggest that historical N loading from uneven manure application on the farm may continue to influence N leaching more than a decade after adopting nutrient management plans that restrict N applications (including in manure) to agronomic N requirements as approved by the Maryland Department of Agriculture beginning in the mid-1980s. Grazing herds deposit N throughout the pasture with spatial variability, and careful and intensive management helps ensure that distribution is relatively even, even as stocking rates change (McCarthy et al., Reference McCarthy, Delaby, Hennessy, McCarthy, Ryan, Pierce, Brennan and Horan2015). Long-term and widespread monitoring of soil N in the field and pasture may further our understanding of the potential for nutrient losses under this management system. Within their limitations, these study results demonstrated that under appropriate management, MIG as practiced in the mid-Atlantic region does not appear to pose the environmental risk previous suggested by past and current studies.
Acknowledgements
Funding was provided by United States Department of Agriculture Northeast Sustainable Agriculture Research and Education. Appreciation to the late Dr. William “Bill” Stout for his early collaboration, and ato the farmers for their ongoing support and stewardship.