Introduction
Increased energy costs, climate change, biodiversity losses, fluctuation of selling prices and greater concerns for environmentally friendly production are among the emerging factors that make agricultural competitiveness much harder to achieve and maintain. Unlike the rather stable context of the past decades, farmers and their advisors must now strive for a dynamic competitive advantage that requires rethinking land use to meet environmental and socio-economic challenges. Main challenges in this context are reducing negative externalities of agriculture (e.g., greenhouse gas emissions) without decreasing agricultural production and financial returns, and whenever possible increasing non-market services [e.g., cultural value, carbon (C) sequestration, erosion prevention, etc.]. Grasslands can provide a range of servicesReference Lemaire, Hodgson, Chabbi, Lemaire, Hodgson and Chabbi1. For farmers, grasslands primarily provide feedstuffs for herds in grassland-based livestock systems and input services (e.g., maintenance of soil fertility; biological regulations) when they are introduced in crop rotations in mixed crop–livestock systemsReference Wilkins2. For other stakeholders such as environmental agencies and policy makers, grasslands contribute many non-marketed services. Farming, previously dedicated mainly to food production, is likely to change with an increasing recognition of grassland multifunctionalityReference Knickel, Brunori and Rand3. Since land use and associated land cover and management intensity influence the range of services provided by grassland biodiversity, incentives such as subsidies and regulations should promote a widening of farmers’ objectives, i.e., producing forage along with delivering a range of services by managing biodiversity at different scalesReference Power4. Two scientific challenges arise for meeting these aims. First, it is necessary to quantify the levels at which services provided by grassland agro-ecosystems are delivered and to predict them according to management and abiotic factors. Secondly, for the sake of operationality, research outputs must be translated into user-friendly tools for stakeholders, especially the farmers.
Evaluating and predicting services provided by grassland agro-ecosystems have recently progressed using an approach based on identifying the role of functional diversity. Trait distribution of the community is a consequence of environmental filters caused by either biotic or abiotic factors (e.g., land use and management) that determines ecosystem processes such as biogeochemical cycling and ecosystem productivityReference Webb, Hoeting, Ames, Pyne and LeRoy Poff5. These processes explain the supply of services, e.g., primary production explains forage supply that can be potentially predicted by combinations of traitsReference Lavorel and Garnier6, Reference Salles, Poly, Schmid and Le Roux7. Ecosystem functioning is indeed the end result of the operation of multiple filters on a hierarchy of scales, which, by assembling individuals with appropriate responses, results in communities with varying trait compositionsReference Garnier and Navas8. Ecosystem processes and services are shaped through land use and management, directly by farmers and indirectly by institutions through norms, subsidies and advice. Thus, ecosystem-based learning or decision supports based on species-trait approaches can be developed into a framework and has been recently proposedReference Díaz, Quétier, Cáceres, Trainor, Pérez-Harguindeguy, Bret-Harte, Finegan, Peña-Claros and Poorter9. However, two main issues still need to be addressed.
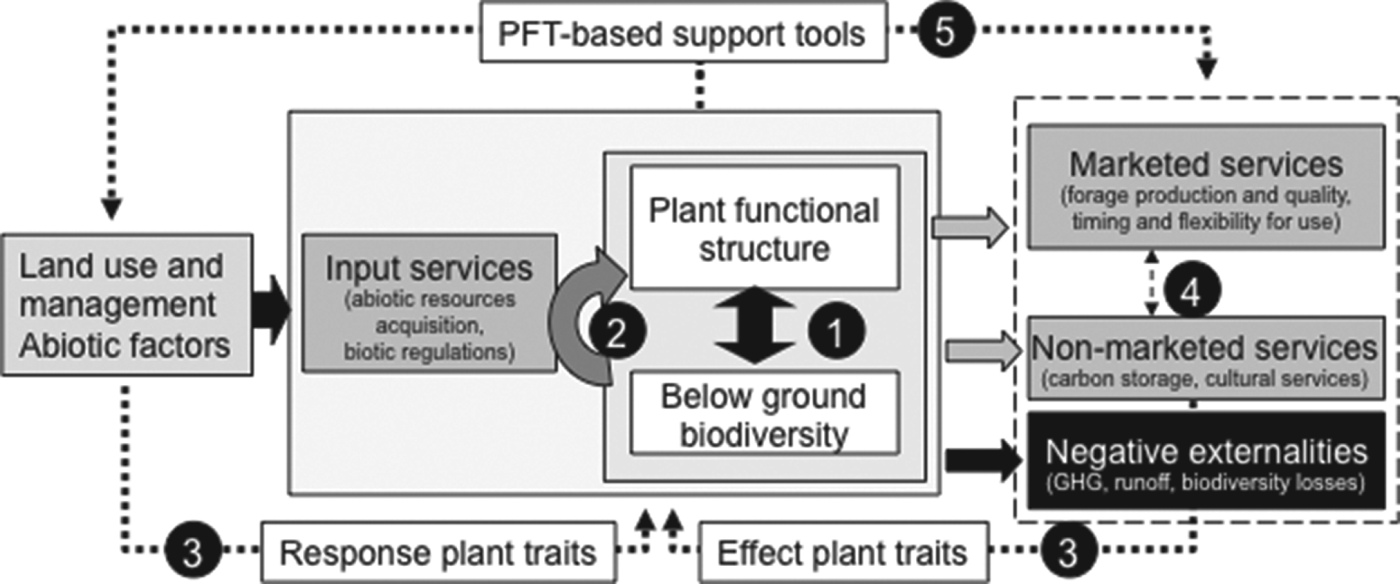
First, this cascade of relations renders prediction of ecosystem services difficult. The environmental factors affecting trait distribution interact in a complex manner between management drivers such as synthetic and organic fertilizers, grassland use (date, intensity and frequency of defoliation), local climate and edaphic conditions, and legacy of previous use that can differentially act on traits related to different processes. Furthermore, relations between species functional composition and biotic and abiotic factors or ecosystem services are complex: a given trait can respond differently to several drivers, several traits may be needed to scale-up to each ecosystem process and each service may be related to a suite of processes that depend on different combinations of traitsReference De Bello, Lavorel, Lavergne, Albert, Boulangeat, Mazel and Thuiller10. Above- and below-ground components of grassland ecosystems are also strongly linked through a variety of both direct and indirect interactions that operate across trophic levelsReference Wardle, Bardgett, Klironomos, Setälä, Putten and van der Wall11–Reference Orwin, Buckland, Johnson, Turner, Smart, Oakley and Bardgett13 (Fig. 1, arrow 1). Our first objective, aiming to better understand and predict biodiversity-dependent services, was thus to propose a framework that integrates these linkages between above-ground and below-ground diversity, especially for the acquisition and retention of resources provided by functional diversity (Fig. 1, arrow 2). We aimed to build a parsimonious framework to infer grassland services based on a limited number of plant functional traits. We selected key plant traits among those responding to management and environmental factors and having major effects on processes modulating processes related to ecosystem services. For simplicity, we focused on above-ground diversity, whose role has been intensively documented during the past decade, assuming that it can be also a proxy for below-ground diversity (Fig. 1, arrow 3). Finally, we assessed whether this integrated framework can help to determine tradeoffs between services, given that optimum management is stakeholder- and scale-dependent (Fig. 1, arrow 4).

Figure 1. Ecosystem services and negative externalities potentially delivered by grasslands. Input services contribute to biological, physical and chemical processes supporting agriculture. Marketed services contribute to agricultural productivity, whereas non-marketed services do not (yet) directly contribute to agricultural income (except in specific cases such as agro-tourism farms); PFT, plant functional type; numbers (1,…,5) rely on key relations that are explained in the text; full arrows, biophysical relationships; dotted arrows, relationships based upon plant traits.
The second issue to be addressed is related to the fact that a trait-based approach is rarely implemented by the intended end-users, especially farm advisors, and is not well-tailored for enhancing the learning process in a management perspectiveReference Duru, Cruz, Jouany and Theau14. Trait-based agro-ecosystem models and indicators used to represent and understand grassland ecosystem functioning are not necessarily salient for end-users, i.e., they are often not perceived as relevant by decision makersReference Barrios15. Thus, our second objective was to propose an operational approach to infer multiple-service delivery by grasslands. It is based on broad plant groups organized into functional types defined by a suite of plant traits, which is better adapted to support learning and monitoring by farm advisors. The ability of the approach to assess grassland ecosystem services by characterizing plant communities and determining trade-offs and synergies among services (Fig. 1, arrow 5) were evaluated. Then, considering the uncertainties of both simplifications [relying only on plant functional diversity and considering plant functional types (PFTs) instead of plant traits] and the context of environmental and management uncertainties, we suggest ways to apply and supplement this approach for guiding grassland management.
To reach these two goals, we first reviewed the literature to examine how characterizing plant growth strategies and functional traits can help understand the link between management practices and forage production or other services; we also examined to what extent above-ground biodiversity and below-ground biodiversity are linked. Next, we designed an integrated framework that summarizes the impacts of environmental and management factors on processes related to ecosystem services by characterizing plant strategies of resource use and growth. We then proposed an operational approach for building relevant support tools for end-users to infer grassland services based on a few PFTs. Finally, we evaluated this operational approach for assessing plant community responses to management and effects on services and examined how to implement this approach through support tools for assessing ecosystem services and guiding management practices.
Species-trait-based Approaches for Bridging Species Responses to Management, Environment, and Ecosystem Properties and Services: State-of-the-art
Currently, the importance of functional components of biodiversity has been described for plantsReference Garnier and Navas8, Reference Díaz, Quétier, Cáceres, Trainor, Pérez-Harguindeguy, Bret-Harte, Finegan, Peña-Claros and Poorter9; invertebratesReference Littlewood, Stewart and Woodcock16; microorganismsReference Salles, Poly, Schmid and Le Roux7, Reference Littlewood, Stewart and Woodcock16; meso- and macro-faunaReference Barrios15, Reference Van Eekeren, Boer, Hanegraaf, Bokhorst, Nierop, Bloem, Schouten, Goede and Brussaard17; vertebratesReference Luck, Lavorel, Mcintyre and Lumb18; along with relations between these trophic levelsReference Lavorel, Storkey, Bardgett, De Bello, Berg, Le Roux, Moretti, Mulder, Diaz, Harrington and Pakeman19. We focused on the following main components of grasslands: plants and key species involved in the soil food web (earthworms, nematodes, bacteria and fungi).
Characterizing plant-growth strategies to link management practices to primary production and forage services
Many studies have reported that a main dimension of plant functioning and/or specialization is related to resource acquisition and useReference Wright, Reich, Westoby, Ackerly, Baruch, Bongers, Cavender-Bares, Chapin, Cornelissen, Diemer, Flexas, Garnier, Groom, Gulias, Hikosaka, Lamont, Lee, Lee, Lusk, Midgley, Navas, Niinemets, Oleksyn, Osada, Poorter, Poot, Prior, Pyankov, Roumet, Thomas, Tjoelker, Veneklaas and Villar20, Reference Freshet, Cornelissen and Logtestijn21, which leads to distinguish acquisitive versus conservative plant types. This is related to a continuous variation in leaf traits, from thin, N-rich, short-lived leaves with high photosynthetic rates, to thicker, more fibrous, N-poor, longer-lived leaves with lower photosynthetic rates. Leaf traits such as specific leaf area, leaf nitrogen content and leaf dry matter content of water-saturated leaves are descriptors of these plant-growth strategies, which perform well for predicting species location on an axis of resource capture, usage and availabilityReference Wilson, Thompson and Hodgson22. A second axis of specialization is usually related to plant height, which captures plant competitive ability [e.g., the leaf-height-seed (LHS) modelReference Westoby23] and some aspects of plant reproductive strategy. Plant height is a key proxy to account for competition for lightReference Westoby23 and is positively related to root depth, another trait involved in competitive ability for waterReference Violle, Garnier, Lecoeur, Roumet, Podeur, Blanchard and Navas24. The timing of height growth is also of particular relevance to assess resource acquisition and partitioning among interacting species, leading some authors to define the second dimension of growth strategy as growth–height trajectories, in relation to flowering phenology, i.e., early versus lateReference Sun and Frelich25.
Species’ functional-trait syndromes, i.e., suites of traits, are the outcome of their evolutionary response to selection pressures from habitat characteristicsReference Reich, Buschena, Tjoelker, Wrage, Knops, Tilman and Machado26. Assuming that these characteristics result from the legacy of land-use, edaphic and climate conditions, we hypothesized that plants develop similar strategies above and below groundReference Wahl and Ryser27–Reference Fort, Jouany and Cruz31. Recent studies have shown correlations between morphological root traits and growth strategies defined on the basis of leaves. For example, greater specific root lengths, proportions of biomass of fine roots and root N concentration were found in fast-growing speciesReference Roumet, Urcelay and Díaz32. This suggests a substantial capacity for nutrient uptake and assimilationReference Tjoelker, Craine, Wedin, Reich and Tilman29, low water transport capacityReference Kembel, De Kroon, Cahill and Mommer30 and fast root turnoverReference Eissenstat33. Such trait sets may be attributable to species living in nutrient-rich habitats, allowing rapid organ turnover and growth. In contrast, high root tissue density and large diameter were characteristic of plants exhibiting a long root-lifespanReference Ryser, Lambers, Poorter and van Vuuren34, Reference Craine, Froehle, Tilman, Wedin and Chapin35 and living in nutrient-poor habitats. More recent studiesReference Wilson, Thompson and Hodgson22, Reference Fort, Jouany and Cruz31 have shown correlations between leaf and root traits, revealing similar above- and below-ground plant strategies modulated by drought-tolerance capacity of species. Moreover, patterns of root traits, including decomposition rate, mirrored those of leaf traits, resulting in a similar species clustering. The highly correlated variation in root and leaf traits and potential decomposition rate also suggests that changes in functional composition of communities in response to anthropogenic changes should strongly affect biogeochemical cycles at the ecosystem levelReference Birouste, Kazakou, Blanchard and Roumet36.
High nutrient availability favors plant species with an acquisitive strategy and/or tall statureReference Garnier and Navas8, since competitive exclusion removes non-competitive species. In contrast, low nutrient availability favors conservative, stress-tolerant species, especially when facilitation existsReference Michalet, Brooker, Cavieres, Kikvidze, Lortie, Pugnaire, Valiente-Banuet and Callaway37. However, significant relations are expected between plant community functional structure and other environmental gradients such as climate constraints or water stress that may involve other combinations of traits. Moreover, functional traits related to plant phenology respond to defoliation but also to resource availabilityReference Duru, Ansquer, Jouany, Theau and Cruz38. Intermediate stress, however, favors the coexistence of both plant strategies for cutting as well as for grazingReference Duru, Theau and Cruz39. During the reproductive phase, canopy height before cutting or grazing best describes the effect of defoliation intensity and frequency upon plant functional compositionReference Duru, Ansquer, Jouany, Theau and Cruz38.
Community functional structure is usually defined by two components: community-level weighted mean (CWM) of trait values and functional divergence (FDg) indicesReference Garnier and Navas8, Reference Lavorel, Grigulis, McIntyre, Garden, Williams, Dorrough, Berman, Quetier, Thebault and Bonis40. The CWM calculation is based on the ‘mass-ratio’ hypothesis, which assumes that the extent to which the traits of a species affect ecosystem properties depends on the abundance of the species in the communityReference Grime41. FDg describes the dissimilarity in traits among individuals (species) coexisting within a communityReference De Bello, Lavorel, Díaz, Harrington, Cornelissen, Bardgett, Berg, Cipriotti, Feld, Hering, Martins Da Silva, Potts, Sandin, Sousa, Storkey, Wardle and Harrison42. Large values are often related to functional complementarity between speciesReference Eisenhauer43. Understanding diversity effects on ecosystem functioning usually occurs by partitioning plant diversity into two processes: selection versus complementarityReference Petchey and Gaston44. The former, assessed via CWM, occurs when plant species with particular traits dominate ecosystem processes [e.g., most of species having low or high leaf dry matter content (LDMC)], whereas the latter, assessed via FDg, results from better resource use due to trait differences (coexistence of species having low and high plant trait values). Such an effect is expected under intermediate levels of fertilityReference Littlewood, Stewart and Woodcock16, Reference Gross, Suding, Lavorel and Roumet45 and disturbance. Complementarity can occur among grasses and legumes, and among grass functional types with differing traits in relation to the timing, location and rate of resource use.
Convergent results among several studies show the relevance of the plant-trait approach for successfully evaluating forage provision by permanent grasslandsReference Quétier, Lavorel, Thuiller and Davies46, Reference Ansquer, Duru, Theau and Cruz47. More generally, it was shown that traits such as leaf dry matter content associated with response to nutrient gradients strongly overlapped with those determining net primary productionReference Lavorel and Garnier6. The same trends were found for tissue compositionReference Duru, Cruz and Theau48: PFTs with an acquisitive strategy have a low lignin and cellulose content. Furthermore, high FDg leads to a flatter growth curve, allowing flexibility in harvest date because one can vary the harvest date without greatly changing herbage yield or its qualityReference Duru, Cruz and Theau48. In addition, the balance between plant groups differing in their phenology (grass versus dicotyledonous species) allows the capture of more light over the growing seasonReference Baumont, Delmas, Violleau, Zapata, Chabalier, Picard, Louault, Andueza and Farruggia49.
Above-ground—below-ground biodiversity linkages: toward management of below-ground biodiversity
The rhizosphere is the interface between soils and plantsReference Hinsinger, Bengough, Vetterlein and Young50, i.e., a place where biotic interactions are intense between plants and soil microorganisms. Most processes associated with above- and below-ground interactions in ecosystems occur in this relatively limited soil volume, which is directly influenced by root exudates and functioningReference Wardle, Bardgett, Klironomos, Setälä, Putten and van der Wall11. Interactions also occur via above-ground litter inputs and decomposition and foliage-induced changes in soil microclimate. It has been shown that the diversity, abundance and/or functioning of soil microorganisms, in particular rhizospheric ones, can strongly depend on plant species or functional groupReference Patra, Abbadie, Clays, Degrange, Grayston, Guillaumaud, Loiseau, Louault, Mahmood, Nazaret, Philippot, Poly, Prosser and Le Roux51–Reference Le Roux, Schmid, Poly, Barnard, Niklaus, Guillaumaud, Habekost, Oelmann, Philippot, Salles, Schloter, Steinbeiss and Weigelt54. As feedback, soil micro-organisms play a fundamental role in the biogeochemical cycling of inorganic and organic PReference Richardson, Lynch, Ryan, Delhaize, Smith, Smith, Harvey, Ryan, Veneklaas, Lambers, Oberson, Culvenor and Simpson55 and NReference Ingham, Trofymow, Ingham and Coleman56 and consequently availability of these resources to plants. Thus, they ultimately affect plant functional compositionReference Wardle, Bardgett, Klironomos, Setälä, Putten and van der Wall11. In the context of our approach, the functional characteristics of rhizospheric microbial communities can thus be viewed as ‘extended functional traits’ of plant species. In a recent study, it was demonstrated that plant traits can be a powerful tool for understanding the mechanisms behind plant–soil interactions and ecosystem functioning and for predicting how changes in plant–species composition associated with global change will feed back into the soil systemReference Orwin, Buckland, Johnson, Turner, Smart, Oakley and Bardgett13. Associated microbial functional traits can have affinity for C or N substrates or maximum substrate use rate, as demonstrated for soil nitrite oxidizers along an N gradientReference Attard, Poly, Laurent, Commeaux, Terada, Smets, Recous and Le Roux57.
The multiple processes involved in plant–soil interactions largely determine the cycling of C via the forms of soil organic matter, from labile to recalcitrant, and nutrients, mainly N and P, which benefit ecosystem functioning. Accounting for soil microbial functional traits increasingly appears necessary to infer soil functioningReference Salles, Poly, Schmid and Le Roux7 and delivery of services properly, and to adequately define appropriate management practicesReference Orwin, Buckland, Johnson, Turner, Smart, Oakley and Bardgett13, Reference Fornara and Tilman58, Reference Le Roux, Recous, Attard, Lemaire and Chabbi59. For instance, symbiotic and free-living biological N fixation represents a sustainable N input into N-poor agrosystemsReference Fustec, Lesuffleur, Mahieu and Cliquet60. In addition, the balance between N mineralization, nitrification and denitrification determines, in relation with plants’ preference for N forms, soil fertility and potential N losses from the ecosystemReference Boudsocq, Lata, Raynaud, Loeuille, Mathieu, Blouin, Abbadie and Barot61. Thus, future agricultural practices should increasingly consider managing soil biota to enhance the delivery of a range of ecosystem services and to improve the resilience of agricultural systems. For instance, it was demonstrated that soil arbuscular mycorrhizal fungi communities from different agricultural fields vary in their impact on plant productivity and nutrient-leaching lossesReference Verbruggen, Kiers, Bakelaar, Röling and van der Heijden62. Similarly, inoculation of plant-growth promoting rhizobacteria, such as Azospirillum strains, is currently being tested to increase crop yieldsReference Martinez-Viveros, Jorquera, Crowley, Gajardo and Mora63. This paves the way for agricultural practices that will try to directly or indirectly manage soil organisms, even microorganisms, and their functional traits in the future.
An Integrated Framework and Operational Approach for Managing Grasslands
A trait-based framework to infer services delivered by grasslands
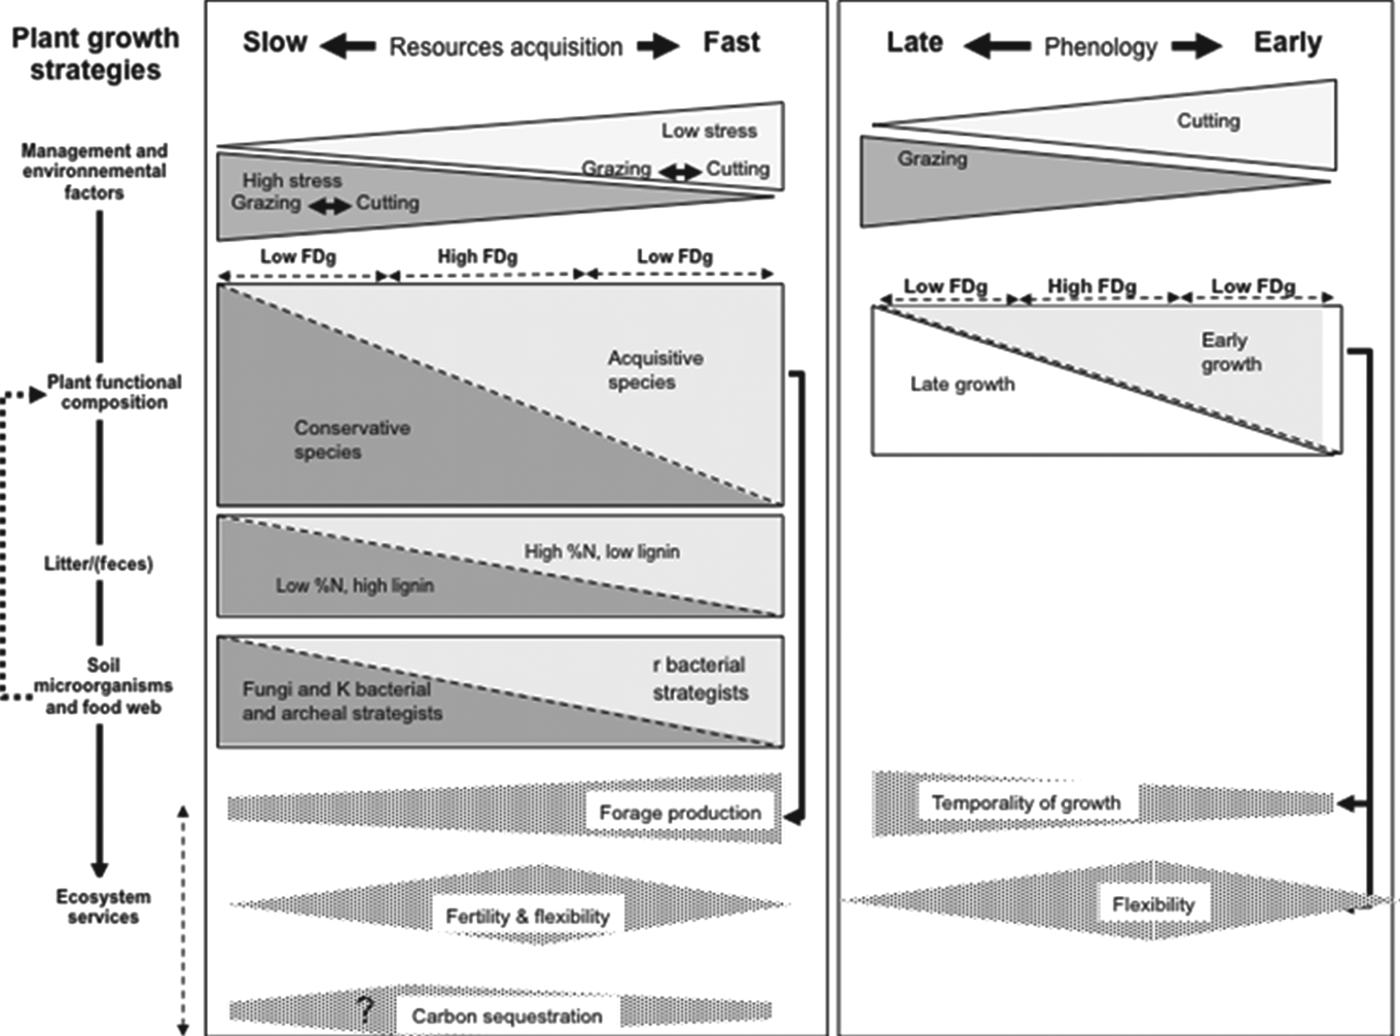
For managed grasslands, plant traits include key effect traits that can be used to predict services because they integrate the effect of a large range of ecological processes, including those occurring below ground. For the resource-use dimension, fast versus slow growth plant types display differences in their ability to capture and use resources due to differences in root-system architectureReference Comas, Goslee, Skinner and Sanderson64, quality of litterReference Fortunel, Garnier, Joffre, Kazakou, Quested, Grigulis, Lavorel, Ansquer, Castro, Cruz, Dolezal, Eriksson, Freitas, Golodets, Jouany, Kigel, Kleyer, Lehsten, Lepš, Meier, Pakeman, Papadimitriou, Papanastasis, Quetier, Robson, Sternberg, Theau, Thebault and Zarovali65, rhizospheric processesReference Harrison, Bol and Bardgett66 and periods when resources are required (e.g., differing minimum-temperature thresholds for growthReference Fornara and Tilman58). Low stress vis-à-vis resource availability (nutrients or water availability) favors acquisitive species. In this context, nutrient cycling is driven mainly by bacterial r-strategists with a high activity rate and a low affinity for substratesReference Attard, Poly, Laurent, Commeaux, Terada, Smets, Recous and Le Roux57, Reference Le Roux, Poly, Currey, Commeaux, Hai, Nicol, Prosser, Schloter, Attard and Klumpp67. This supports rapid, leaky nutrient cycles and low net accumulation C in soil. These drivers and associated soil processes lead to high forage production and quality at the leafy stage. In contrast, high resource-related stress, up to a certain extent, leads to slow nutrient cycling and promotes soil C sequestrationReference Graux, Lardy, Bellocchi and Soussana68. Intermediate levels of fertility allow different plant types to coexist, which allows overyielding due to complementary effects that reduce competition (input service)Reference Pontes, Maire, Louault, Soussana and Carrère69 and provides great flexibility in harvest or grazing datesReference Duru, Cruz and Theau48 (Fig. 2, left side). Disturbances may reduce or amplify the effect of stress. For given climate and soil conditions, mowing promotes species with an acquisitive strategy, whereas grazing promotes species with a conservative strategy. However, the magnitude of these effects depends on grazing intensityReference Pontes, Maire, Louault, Soussana and Carrère69. High grazing intensity favors the return to the soil of material with a C:N ratio lower than that of litter. In contrast, low grazing intensity increases the quantity of litter with approximately twice the C:N ratio of that of green plant tissue. The level of stress and disturbance required to maximize fertility and C sequestration is not well knownReference De Deyn, Cornelissen and Bardgett70. Nevertheless, the level of stress and disturbance that maximizes each service is likely to depend on the service consideredReference Rodríguez, Beard, Bennett, Cumming, Cork, Agard, Dobson and Peterson71. Defoliation regime is probably the main driver of plant-community composition for the timing of herbage growth, e.g., the time at which peak herbage occurs during regrowth (Fig. 2, right side). Coexistence within a community of late and early plant strategies smoothes the herbage growth patternReference Duru, Cruz and Theau48 and may help optimize light capture.

Figure 2. For two main axes of plant-growth strategies (left and right), the figure displays the relationships between (from top to bottom): management-induced stresses and disturbances; plant-community functional divergence (FDg); litter composition; soil microbial community and food web composition (fromReference Wardle, Bardgett, Klironomos, Setälä, Putten and van der Wall11); and several ecosystem services (forage production, soil fertility, flexibility for management and C sequestration); the height of the triangle or trapezium along the X-axis reflects the value of the criterion considered.
Previous versions of this framework have been used for teaching students and training experts involved in advising farmersReference Duru, Cruz, Jouany and Theau14. The current version of this framework can be extended to investigate plant traits associated with a stress factor or to identify functional groups of populations exhibiting similar responses to it (e.g., drought survivalReference Volaire72). More specifically, it can be used as a first step to qualitatively design custom communities for desired ecosystem services based on hypotheses of plant functioning in species assemblagesReference Comas, Goslee, Skinner and Sanderson64. However, complementary work should be done to design an operational approach that can be used by farmer advisors.
A salient operational approach for managing grassland agro-ecosystems
From plant traits to PFTs
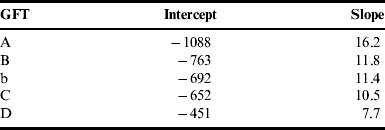
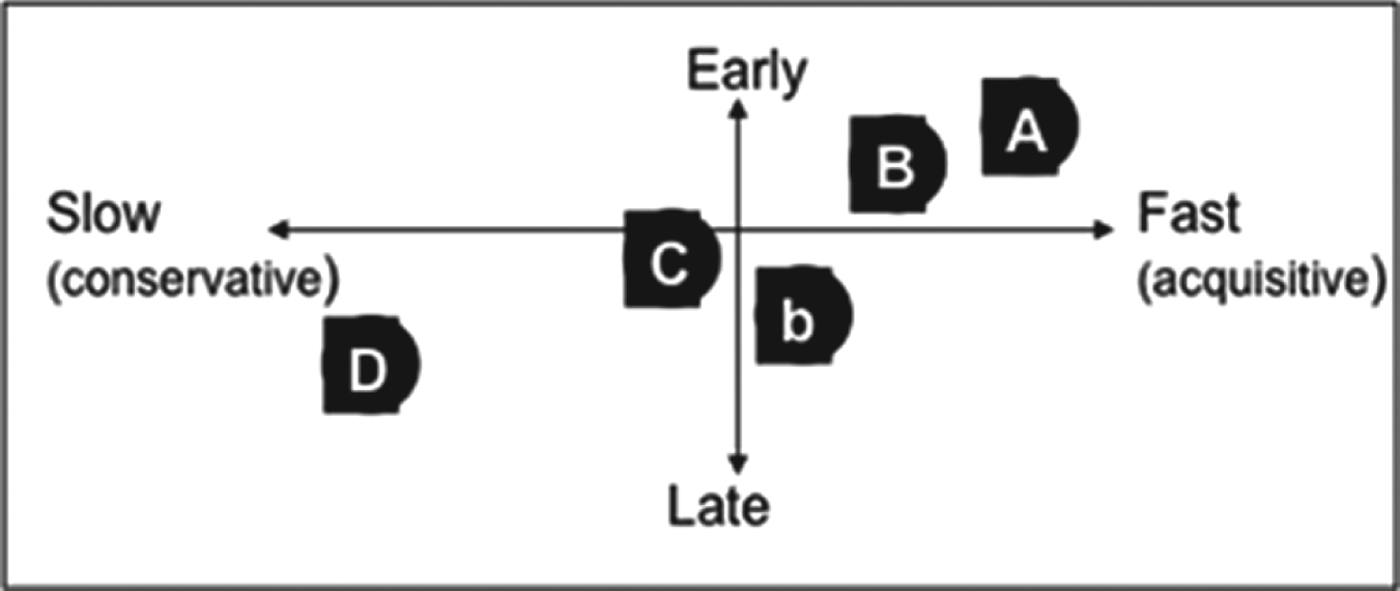
Although popular and successful in scientific arenas (e.g.,Reference Suding, Lavorel, Chapin, Cornelissen, Díaz, Garnier, Goldberg, Hooper, Jackson and Navas73), the plant-trait approach rarely prevails in non-scientific circles, even when delivering quantitative relations between land use, plant community composition and ecosystem processes and services. Although the approach works, stakeholder feedback shows that it is not relevant in practice because it is too time-consuming, and trait values such as LDMC and specific leaf area (SLA) are too abstract for end-usersReference Duru, Cruz, Jouany and Theau14. To address the approach's relevance to decision makers’ needsReference Cash, Clark, Alcock, Dickson, Eckley, Guston, Jäger and Mitchell74, we made two changes to the characterization of grassland vegetation compared with the framework presented above. First, we classified species into functional types (i.e., groups of species sharing the same collection of attributesReference Colasanti, Hunt and Askew75). We adopted five grass functional types (GFTs) covering the diversity observed in species growing in the same environmental conditions in France based on six plant traits (LDMC, SLA, flowering date, leaf lifespan, leaf tensile strength, plant height)Reference Cruz, Theau, Lecloux, Jouany and Duru76 (Appendix 1). These five GFTs were characterized by traits reflecting the two major growth strategies (flowering date to distinguish late versus early growth; LDMC to distinguish fast versus slow growth) (Fig. 3). We also verified that GFTs were consistently ranked according to herbage growth, i.e., slope and intercept of growth decreased (Appendix 2). Second, we focused on grass species because they have more similar plant-trait valuesReference Ansquer, Duru, Theau and Cruz77 and propertiesReference Duru, Cruz and Theau48 than dicotyledonous species coexisting in grassland communities. Consequently, we consider dicotyledonous species as a whole for estimating their overall impact on plant-community properties according to their percentage in the plant communityReference Duru, Cruz and Theau48. On this basis, the response of plant-community structure to management and environmental factors and its effect upon forage provision can be analyzed via GFT assemblages to develop a generic and low-input method for farm advisorsReference Gillison78. Thus, plant community structure can be characterized by:
– the percentage of grass species in the vegetation cover (G)
– the percentage of each of the five GFTs (pi)
– a diversity index, S, characterizing the evenness of GFT percentage and richness, calculated as a Simpson index:
 $S = 1 - \sum\nolimits_{i = 1}^n {\,p_i^2} $; it is an indicator of plant-strategy specialization within a plant community. Based on the analysis of 1378 plant communities from a range of temperate grasslands in France, the relative abundances of the different GFTs within plant communities are unimodalReference Duru, Jouany, Theau, Granger and Cruz79 and can be considered as an FDg index.
Such plant community characterization via PFTs has been recently extended to perennial tropical areas, where C3 and C4 species coexistReference Cruz, Quadros, Theau, Frizzo, Jouany, Duru and Carvalho80, and sown grasslandsReference Comas, Goslee, Skinner and Sanderson64, Reference Volaire72.

Figure 3. Mapping of five grass functional types (A, B, b, D, C) by two plant traits (leaf dry matter content, flowering date) representing two plant-growth strategies, fast versus slow, early versus late, respectively.
From PFTs to services
Forage production and quality can be assessed by the percentage of species having a fast growth strategyReference Duru, Jouany, Theau, Granger and Cruz79 because these types are composed of species with low LDMC (Table 1). Based on the framework proposed (Fig. 2), we assumed that the same was true for C sequestration. Furthermore, based on findings showing the existence of contrasted plant preferences for the different chemical forms of N (ammonium versus nitrate)Reference Wardle, Bardgett, Klironomos, Setälä, Putten and van der Wall11, Reference Kardol and Wardle12, we hypothesized that, in low soil N availability conditions, the coexistence of species having different growth strategies can allow higher N uptake in comparison to plant community composed only of plants with a conservative growth strategy.
Table 1. Indicators used for characterizing grassland properties and services.

GFTfast, grass functional types having a fast growth strategy; functional diversity index.
Flexibility in management allowed by the timing of herbage growth can be assessed by the proportion of GFT with a late growth strategy, which is related to late flowering dates (GFTlate). The flexibility allowed by within-plant-community diversity can be assessed by S, assuming that the more numerous these GFTs are, the flatter the growth curve around peak herbage is, as found using LDMCReference Duru, Cruz and Theau48, because these communities are a mixture of GFTs with early and late flowering dates and short and long leaf lifespan.
The GFTfast×S operational approach to characterize within- and between-grassland functional diversity
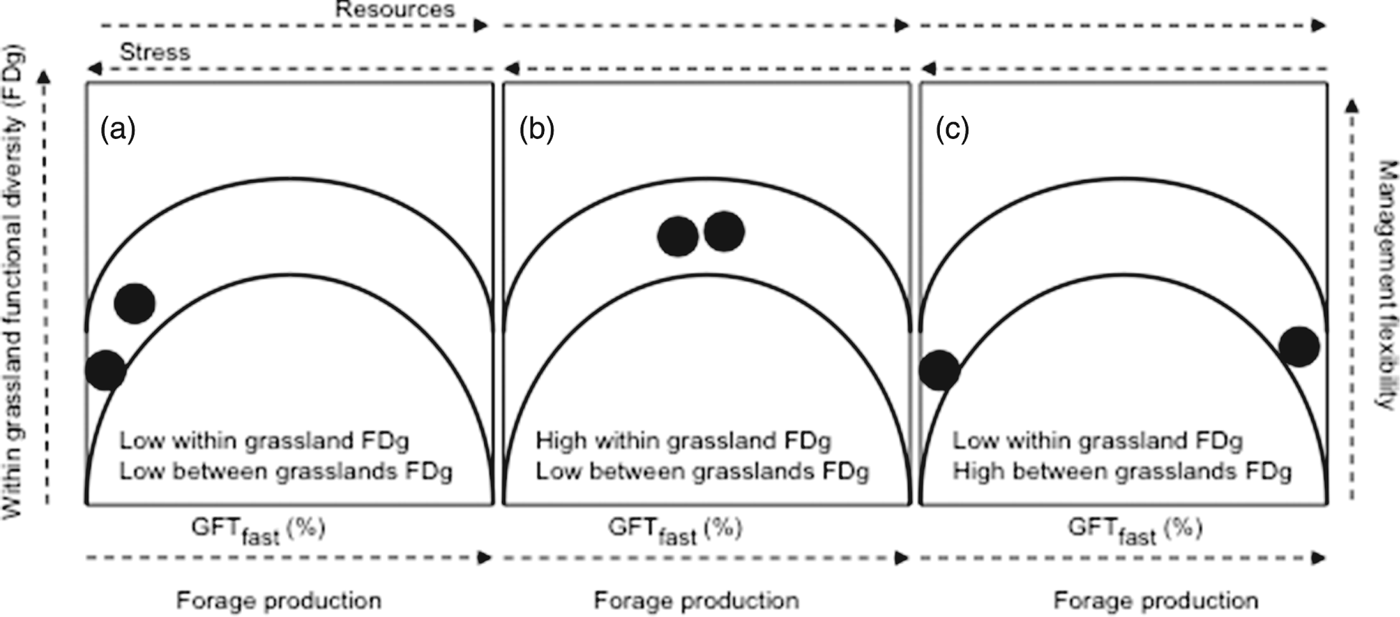
To propose an operational way to infer grassland responses to management and environmental drivers and their effects on ecosystem services, we considered the resource dimension of plant-growth strategy, represented by the percentage of GFTfast (instead of LDMC in the trait-based framework initially presented) and the S index for GFT diversity (instead of the FDg index for LDMC) (Fig. 4). As constructed, the relation between the S index and the percentage of GFTfast is parabolic, with maximum FDg expected for mean values of GFTfast and minimum FDg expected for low and high values. Three main patterns are possible according to the combination of scale and level of FDg (Fig. 4). However, there is large uncertainty, because when GFTfast=100%, S can theoretically vary from 0 (one GFT) to 0.5 (two GFTs with the same percentage).

Figure 4. Relationship between functional divergence (FDg: within grassland functional diversity on Y-axis) and between grassland functional diversity (FDv on X-axis, assessed through the percentage of grass functional types having a fast growth strategy: GFTfast) coupling with effects (forage production and management flexibility on X- and Y-axis, respectively) and drivers (resource availability and stress intensity on top of X-axis). Lines represent the enveloping curves, and circles illustrate three main patterns (a–c) considering two grasslands or sets of grasslands.
Case Studies
Objectives and data
Case studies were used to evaluate the operational approach proposed, examining relations between plant functional composition and either environmental and management variables, or ecosystem services. Most of these relations were previously established considering a single plant traitReference Duru, Ansquer, Jouany, Theau and Cruz38, Reference Duru, Theau and Cruz39, Reference Duru, Cruz and Theau48, Reference Cruz, Theau, Lecloux, Jouany and Duru76, Reference Ansquer, Duru, Theau and Cruz77: LDMC, which reflects well on the resource-use dimension and weakly on the reproductive pattern of plant-growth strategies. We re-examined these relations to evaluate whether considering the two dimensions of plant-growth strategy performed well and whether considering pre-established PFTs instead of plant traits provided similar results.
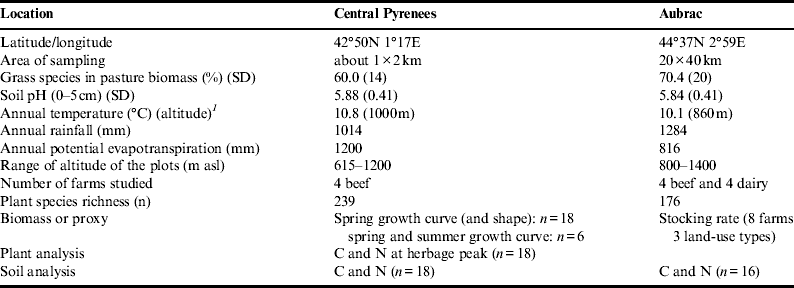
The study was based on the data from two mountainous regions in France (Table 2) dominated by unsown species-rich grasslands used for feeding cows (grazing and hay). In these regions of sufficient precipitation, temperature is the main climate characteristic affecting plant productivity. Farm surveys were performed to record management practices, such as three defoliation regimes: cutting, grazing then cutting, and grazing only. Surveys were supplemented by calculation of Ellenberg indicator values (EIVs) for nutrients (N), soil reactivity (R) and moisture (M)Reference Ellenberg, Weber, Düll, Wirth, Werner and Paulissen81. EIVs reflect the relation between each species and environmental factors, and management practices. The strengths of EIVs are that they integrate species behavior over several yearsReference Schaffers and Sykora82. Plant and soil analyses were also performed to verify the consistency between expectations of the framework and observations for leaf tissue composition (e.g., cellulose) and C:N ratio.
Table 2. Description of the two case studies used to test the framework.

1 Climate data are averages over the past 10 years.
m asl, meters above sea level; SD, standard deviation.
Evaluating the approach
From PFT composition to ecosystem services
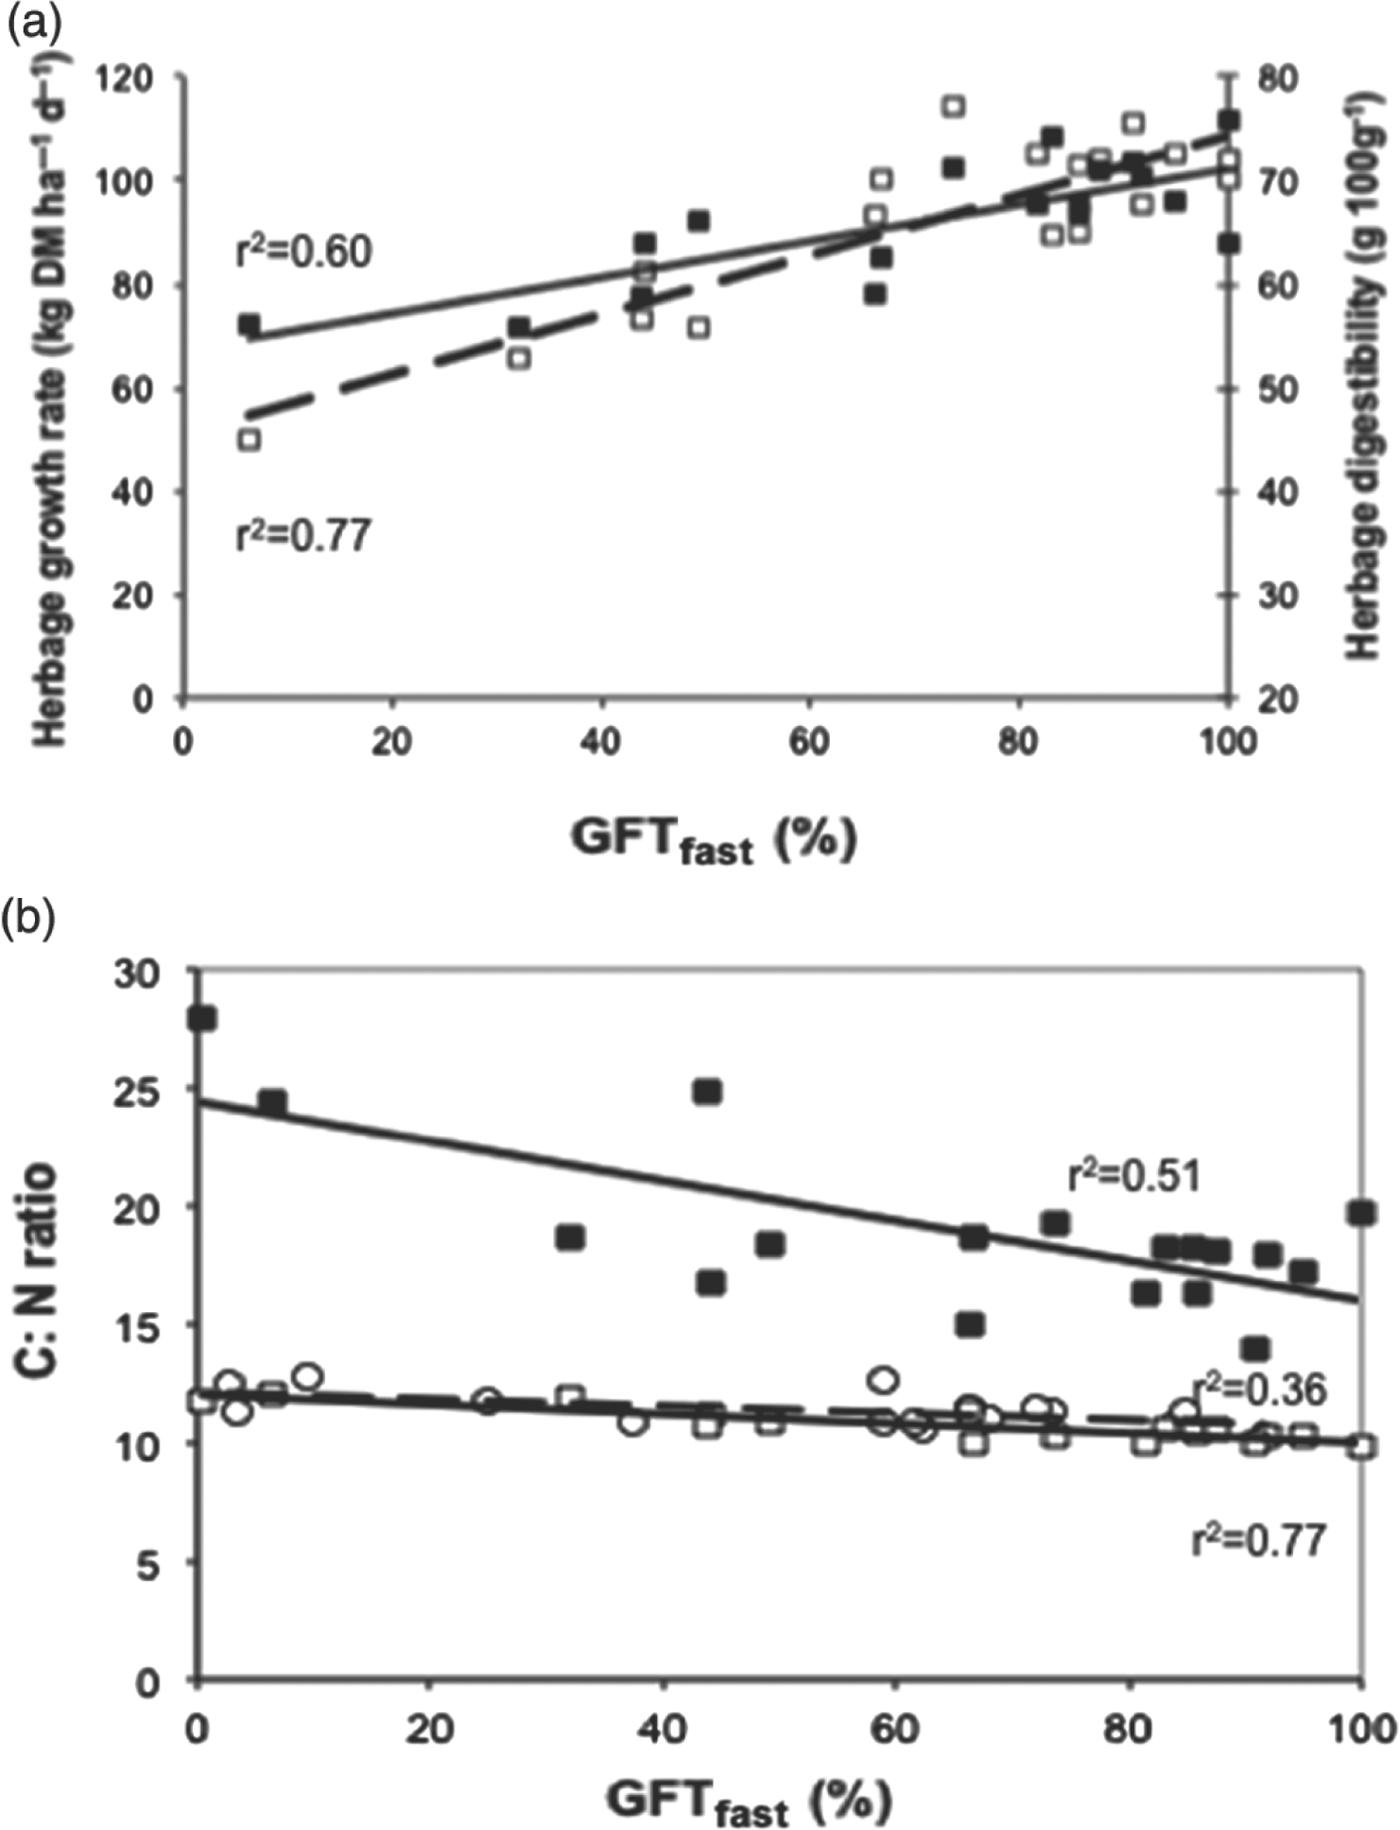
We verified that the percentage of GFTfast was a proxy for estimating forage production, herbage digestibility and several key variables of nutrient cycles. For example, it was significantly and positively correlated with spring herbage growth rate measured at the field level (network 1, Fig. 5a) as well as with stocking rate calculated for a set of fields at an annual scale (network 2, not shown, n=24; r 2=0.78). GFTfast was also positively correlated with herbage growth rate measured in spring (Fig. 6a). In contrast, it was significantly and negatively correlated with plant and soil C:N ratios, the slope and intercept being greater for plants than for soil (network 1, Fig. 5b).

Figure 5. Relations between indicators of services (Y-axis) and the percentage of grass functional types having a fast growth strategy: GFTfast at the land-management-unit level. (a) Herbage growth rate (closed symbols) and plant digestibility (open symbols) for the first growing cycle (grassland network 1). (b) C:N ratios for plants (closed symbols) and soil (open symbols); squares for grassland network 1, circles for grassland network 2.

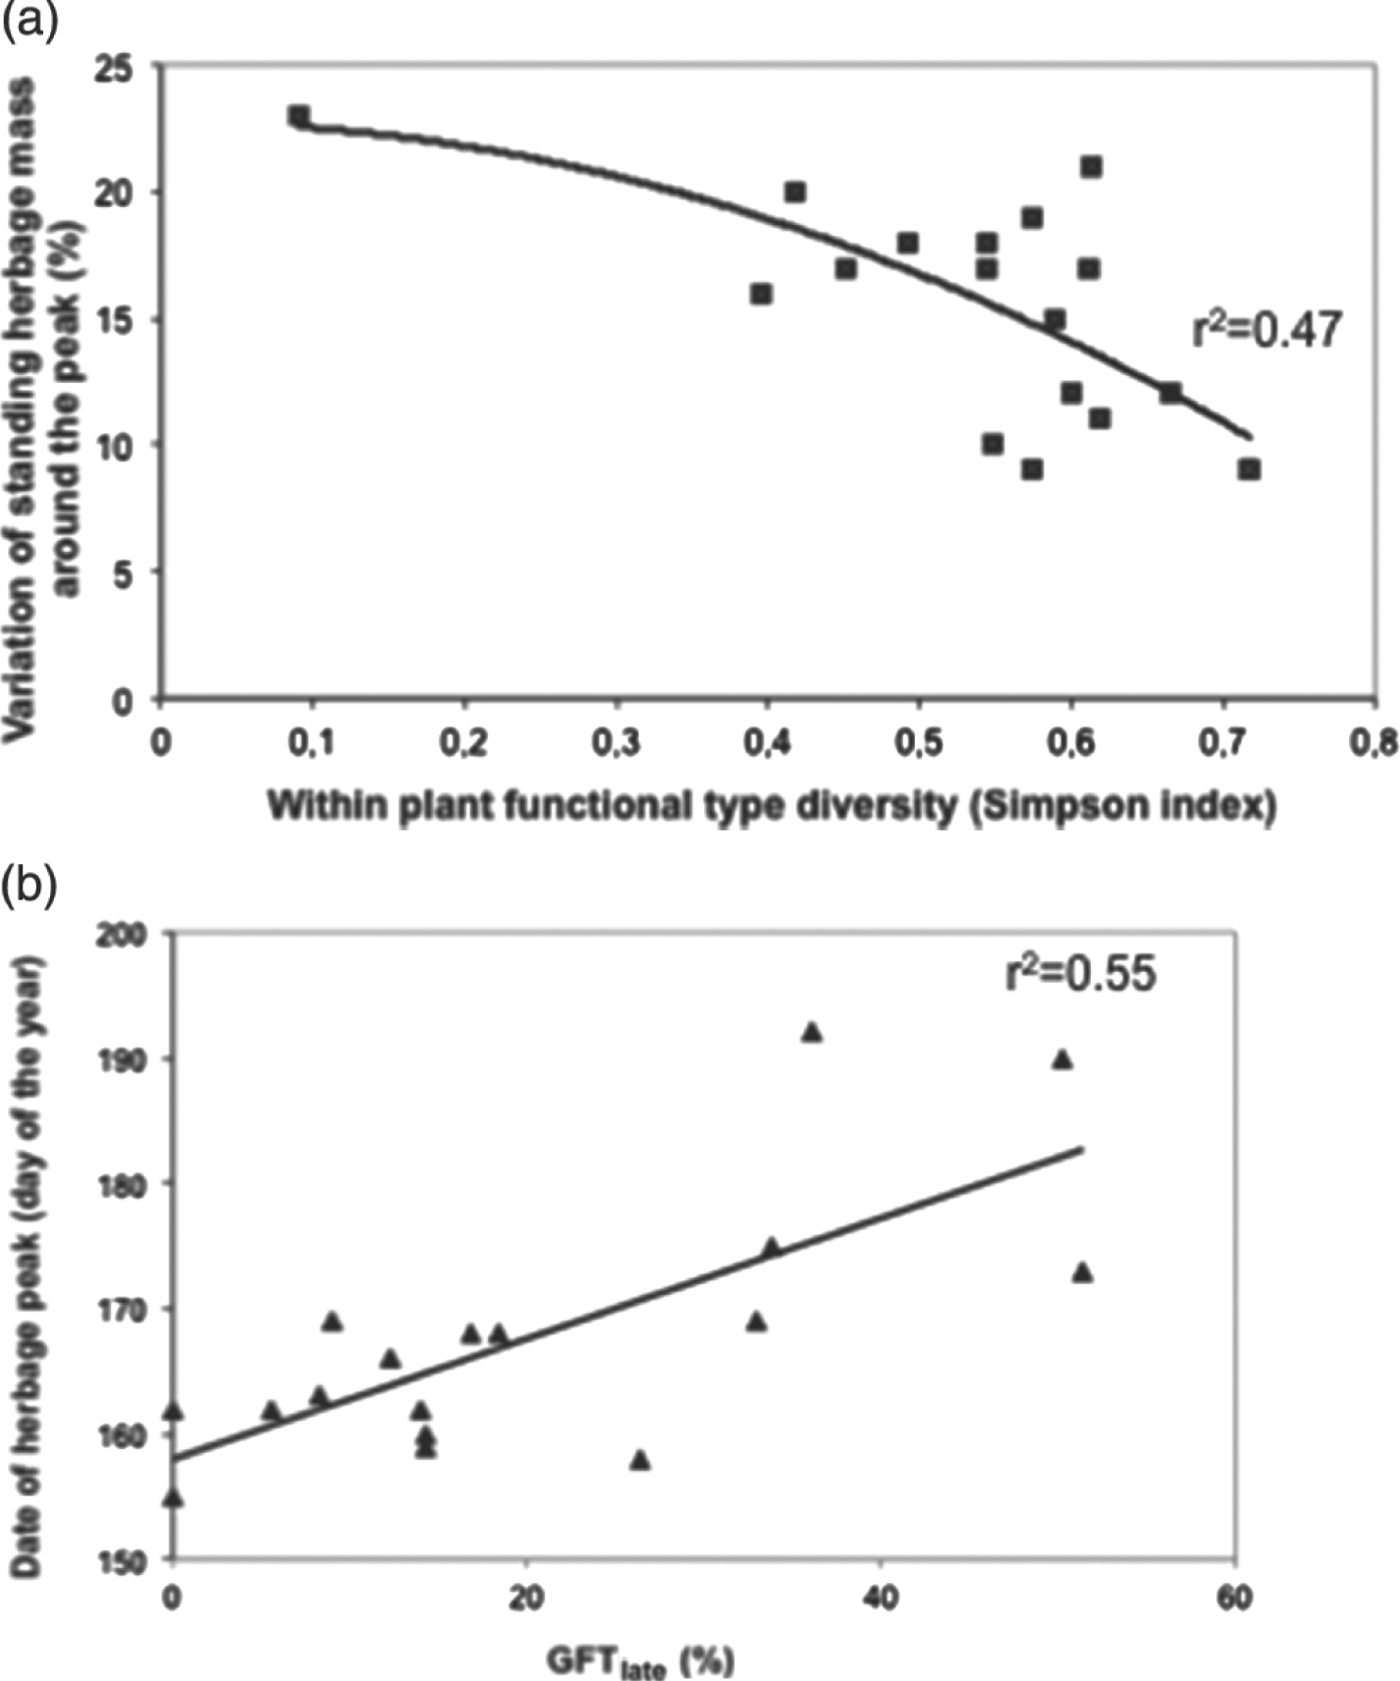
Figure 6. Herbage features related to plant functional-type composition. (a) Shape of the growth curve (±20 days around peak herbage) according to an index of grass functional-type (GFT) diversity (P<0.05 when the extreme value was not considered). (b) Date (Julian days) at which peak herbage occurred according to the percentage of grass functional types having a late growth strategy: GFTlate. The date at which the herbage peak occurred was significantly and positively correlated with GFTlate.
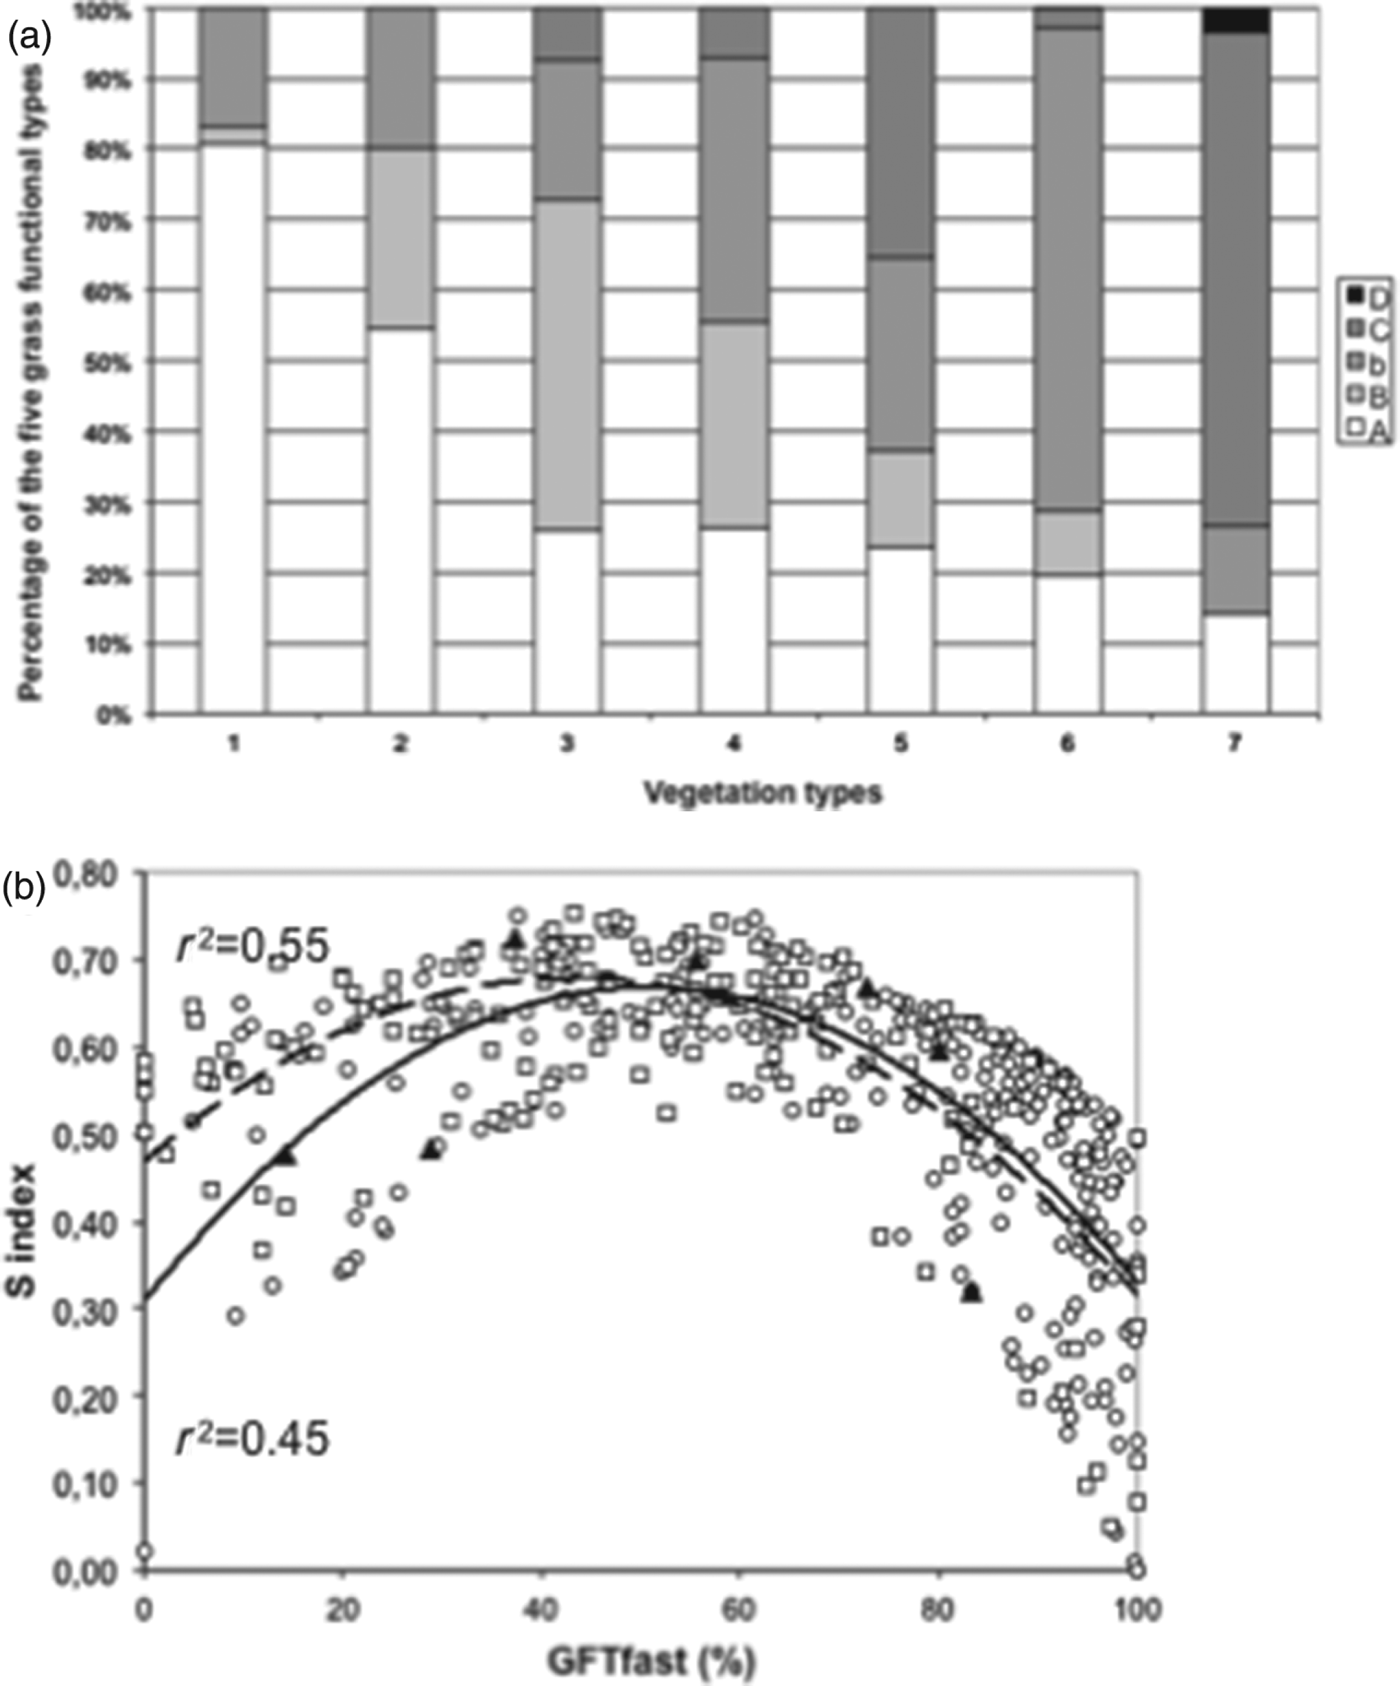
The S index being a proxy of within-field FDg, we examined its influence on temporal dynamics of grassland forage biomass. The shape of the growth curve around peak herbage was flattened when the S index was high (Fig. 6a). Indeed, a mixture of contrasting GFTs smoothed the growth curve because they have different leaf lifespans and flowering times (see Fig. 6b for network 1). In addition, we found that for less fertilized grazed grasslands (N supplied=24.4±26 kg ha−1), N uptake was significantly and positively correlated with S (r=0.4; P<0.05; n=38; network 2). Including soil pH and moisture with EIVs increased the correlation (r=0.66; P<0.001). We also verified that the percentage of GFTlate was a proxy for evaluating timing of herbage growth within and among growing cycles. For the first growth cycle, the higher the percentage of GFTlate, the later the date at which peak herbage occurred (Fig. 6b). However, the greater its percentage, the higher the herbage biomass ratio was between the second and first harvests performed in summer and in spring, respectively (r=0.93; P<0.01) (Table 3, network 1).
Table 3. Late grass growth strategy (type b in percentage) and herbage yield (t ha−1) at first and second harvests for six grasslands of network 1.

GFTlate, grass functional types having a late growth strategy.
Plant-community composition response to environmental and management factors
ANOVA of GFTfast percentage was calculated to compare the three defoliation regimes and two regions, with field altitude and applied N fertilizer as covariables. We found a significant effect of region (P<0.01) and defoliation regime (P<0.05); GFTfast percentages were 58, 60 and 68% for cut, grazed then cut, and grazed grasslands, respectively. Effects of field altitude and applied N fertilizer were also significant (P<0.01 and 0.1, respectively).
Correlations between the GFTfast percentages and raw data describing management and environmental factors were weak (Table 4). Including Ellenberg indicator values for nutrient and soil reactivity (pH) created more generic results (no effect of region) and resulted in higher correlations (Table 4). The direction of effects for temperature N (or N-EIV) and R-EIV were consistent with those expected. To test the hypothesis that FDg indices depended on levels of stress and disturbance (Fig. 4), we calculated linear regressions between each S and environmental (altitude, temperature and region) and management factors separately for percentage of GFTfast<45% or >45%. For network 2, we found significant effects (P<0.001): positive for N fertilization and negative for field altitude for GFTfast<45%, and the opposite sign for both variables when GFTfast>45%. However, this relation was not found for network 1. Therefore, this result, at least partly, validates the hypothesis that the coexistence of plants with different growth strategies captures more N.
Table 4. Regression analyses between the percentage of grass functional types having a fast growth strategy and environmental and management variables [e.g., Ellenberg indicator variables (EIV), R=soil reactivity, N=nutrients] considering raw variables or proxies of processes describing them.

Regressions were calculated separately for cut and grazed grasslands considering the two grassland networks together. **P<0.01; *** P<0.001.
1 Regression coefficient for each variable.
2 Standard error.
/: means not considered in the regression analysis.
Support tools for assessing ecosystem services from PFTs
Moving from the integrated framework to the operational approach requires shifting from the study of practices as factors for understanding agro-ecosystem functioning to mechanisms for managing multiple services in a given context, given environmental and data uncertainties. To illustrate this change, we portrayed typical grassland functional compositions using ascendant hierarchical clustering. As an example, we defined seven types of data from networks 1 and 2 (Fig. 7a). Forage services for each vegetation type can be assessed using previously established relationsReference Duru, Cruz, Theau and Jouany83. Vegetation types 1 and 7 have high and low herbage growth and digestibility as well as early and late flowering time, respectively; however, they have low functional diversity (Table 5). Vegetation types 3, 4 and 5 have the highest plant functional diversities but intermediate values for herbage growth and digestibility. Flowering time for vegetation type 6 is early, whereas herbage growth and digestibility are low. Other services can be assessed qualitatively using the framework (Fig. 4). Stakeholders may use these results confidently because species plant traits [leaf live span (LLS), tissue composition] used for defining functional types are ranked in the same order, regardless of the growing conditionsReference Al Haj Khaled, Duru, Theau, Plantureux and Cruz84. Furthermore, plant community functional composition correlates well with services, at least herbage production and digestibility (r 2>0.6). Applying the GFTfast×S framework (Fig. 4) to field data (Fig. 7b) portrays grassland at different scales (field, farm, region, etc.) by calculating the percentage of each vegetation type.

Figure 7. Support of relations between services and management and environmental factors; example based on 415 fields located in two regions. (a) Percentage of the five grassland functional types (GFTs) of seven assemblage types, ranked according to decreasing percentage of grass functional types having a fast growth strategy (GFTfast) established from cluster analysis. (b) Observed distribution of mean functional divergence (S index) as a function of percentages of GFTfast for Aubrac (squares) and Ercé (circles); triangles are for mean percentages of the seven assemblage types.
Table 5. Characterization of the seven grassland vegetation types for four features.

As found elsewhere (e.g.,Reference Michaud, Plantureux, Amiaud, Carrère, Cruz, Duru, Dury, Farruggia, Fiorelli, Kerneis and Baumont85), relations between grassland functional composition and management or environmental factors are usually weak. Fundamentally, PFT provides ‘average effects’ that fail to provide managers with the information they need to address site-specific conditions, as found for other issuesReference Eviner and Hawkes86. Thus, relations for predicting effects of plant composition on some components of the soil food web, such as decomposer communities, are context-dependentReference Wardle, Bardgett, Klironomos, Setälä, Putten and van der Wall11. In addition, replacing plant traits by PFT decreases the accuracy of estimates of the relation between plant functional composition and management and environmental factors.
Toward a trial-and-error method to cope with uncertainty
Uncertainty complicates management of grasslands to obtain specific ecosystem services. The main issues are (i) which management practices are relevant for changing a given service (as seen in the case study) and (ii) which PFTs should be associated in sown grasslands when considering the services desired. The integrated framework (Fig. 2) provides an overview of combined effects of climate and management practices. Modeling relations between plant functional composition and management practices in case studies provides only weak indications (Table 4 and Fig. 4). Therefore, to cope with these uncertainties, we suggest that farm advisors use an adaptive-management approach supported by research outcomes, such as that presented in this paper. Once plant-community composition is portrayed (e.g., by the GFTfast×S framework) and effects of environmental and management variables are roughly predicted to frame the action (e.g., using statistical models developed between plant community structure and management factors), it consists of a trial-and-error process based on monitoring plant functional structure to adjust management according to local soil and climate characteristics. Management practices can be viewed as ‘experimental treatments’ that are implemented according to the management design. Learning could occur by monitoring plant functional structure, even though changes in soil biota functional structure can require several years to occur, as shown after changes in grassland managementReference Klumpp, Fontaine, Attard, Le Roux, Gleixner and Soussana87 and in conservation agricultureReference Moore88.
Conclusion
Based on the analysis of plant-growth strategies influenced by resources and phenology, coupled with a review of above-ground–below-ground biodiversity linkages, we have shown that plant traits and associated soil microbial community and food web composition can be aggregated into an integrated framework. It shows how plant traits shape a large set of services provided by grassland agro-ecosystems (forage and management services, fertility, and magnitude of C sequestration) and how they respond to land use and management practices. To put this framework into practice, we developed an operational approach based on PFTs and showed how support tools can be built from it. We have shown that restricting grassland characterization to above-ground plant traits for simplicity and choosing PFTs in a management perspective lead to uncertainty in predicting services from management practices and environmental factors alone. To cope with this uncertainty, we suggested a trial-and-error approach.
To generalize the approach, relations between drivers and ecosystem services should be established across scalesReference Grimm and Railsback89, e.g., exploiting within- and among-site environmental heterogeneity of soil, climate and management. Additional sound relations between these drivers and ecosystem services can be expected. On the other hand, the applicability of the integrated framework and operational approach to sown grasslands must be evaluated in more depth. They can be used to define which species should be associated in mixtures according to the services targeted (e.g., to increase grazing season length or soil fertility) and to monitor plant-community composition to adjust defoliation management across seasons or years.
Acknowledgements
This work was funded by the French ANR project O2LA (Organismes et Organisations Localement Adaptés, ANR-09-STRA-08) and has benefitted from insights from the European FP7 project CANTOGETHER.
Appendix 1
Characterization of five pre-established grass functional types (GFT: A, B, b, C, D) for leaf dry matter content and flowering time (Table A1, Figure A1); analysis was done for the 30 most currently observed perennial grass species in FranceReference Duru, Jouany, Theau, Granger and Cruz79 among the 38 studied by CruzReference Cruz, Theau, Lecloux, Jouany and Duru76.

Figure A1. Ranking grass functional type according to decreasing LDMC (leaf dry matter content in mg g−1) and flowering time in degree-days (°C) values; bars on the figure are standard deviations.
Table A1. ANOVA of the five grass functional types for LDMC and flowering time.

Appendix 2
Analysis of spring growth of grass species (n=15) growing in a pure stand (Tables A2 and A3); for each species; sward was cut at two, three or four times at different places for measuring standing herbage mass (W), (number of data=55); afterReference Al Haj Khaled90.
Table A2. Comparison of slope and intercept of the relationship between W and day of year for the five GFTs.

Table A3. Regression coefficients.
