Introduction
Management of grassland ecosystems has been the focus of research on food production, livelihoods and ecosystem servicesReference Boval and Dixon1, with a goal of reducing environmental impact and improving economic value of these systems. Among alternative systems, one strategy is an integrated system of crop and livestock production. Integrated crop–livestock systems (ICLSs) are a challenge for farmers because of the difficulties in managing complex interactions between grain and livestock production during different seasons in a single area. In addition to maximizing interactions between crop and livestock production, ICLSs benefit the environment by enhancing nutrient cyclingReference Brummer2, Reference Hendrickson, Hanson, Tanaka and Sassenrath3, and are considered a good way to achieve sustainable intensification of agricultural systemsReference Ryschawy, Choisis, Choisis, Joannon and Gibon4.
During the 1990s, research in Europe on integrated systems focused mainly on crop production, where the use of crop rotation was successfully implemented to reduce fertilizer and pesticide useReference Jordan, Hutcheon, Donaldson and Farmer5, Reference Tanaka, Karn and Scholljegerdes6. Recent studies have shown that the integration of cattle and pasture with a grain crop rotation increases the quantity and quality of soil organic matter in comparison to continuous croppingReference Tracy and Zhang7, Reference Souza, Costa, Lima, Anghinoni, Meurer and Carvalho8.
In many regions of Brazil, there are degraded pastures that could benefit from integrated systems to increase agricultural output. Southern Brazil has 6.4 million hectares annually cultivated with soybean [Glycine max (L.) Merr.], maize (Zea mays L.) and rice (Oryza sativa L.)9. In the past few years, approximately 1.1 million hectares have been cultivated with winter crops such as wheat (Triticum aestivum L.), oat (Avena sativa L.) and barley (Hordeum vulgare L.)9. The remaining area (i.e. 5.3 million hectares) without crops in the autumn and winter seasons, represents potential income with soil being exposed or simply seeded to cover cropsReference Carvalho, Anghinoni, Moraes, Souza, Sulc, Lang, Flores, Lopes, Silva, Conte, Wesp, Levien, Fontaneli and Bayer10. An ICLS is a potential strategy to increase production in these areas and reduce financial risk for farmers through diversification. Producers make decisions about adopting alternative systems based on the price outlook for products, which can fluctuate both in the short and long term. Nevertheless, farmers are generally most concerned about deviations in yield below the mean or other target valuesReference Antle11, Reference Chavas12. Therefore, investigating ICLSs using both economic and production values is a key step to assess the performance of integrated systems over specialized systems.
When a farmer decides to adopt ICLS, a relevant factor is the use of adequate grazing intensity during the pasture phase, which is a key management variable influencing sward structure. Grazing intensity affects animal performance by influencing herbage intake through modifications in sward structureReference Hodgson13, as well as possibly affecting crop development by physically altering surface soil or changing nutrient recyclingReference Carvalho, Anghinoni, Moraes, Souza, Sulc, Lang, Flores, Lopes, Silva, Conte, Wesp, Levien, Fontaneli and Bayer10.
In general, farmers often use high grazing intensities and set stocking rates greater than pasture carrying capacity, which can negatively affect both pasture and crops in the rotationReference Carvalho, Anghinoni, Moraes, Souza, Sulc, Lang, Flores, Lopes, Silva, Conte, Wesp, Levien, Fontaneli and Bayer10. Determination of an optimum stocking rate must be balanced from trade-offs among several potential outputs that may conflictReference Arnalds, Rittenhouse and Gudmundsson14. There is evidence that grazing management promoting higher individual animal production (i.e. moderate grazing)Reference Carvalho, Bremm, Mezzalira, Da Trindade and Nascimento15 can also foster positive environmental outcomesReference Cruz, Quadros, Theau, Frizzo, Jouany, Duru and Carvalho16.
The objectives of this paper were: (i) to compare production and economic outcomes from a soybean cropping system with and without cattle grazing; and (ii) to analyze different sward management strategies for ICLSs, to determine optimal sward height.
Materials and Methods
Study area
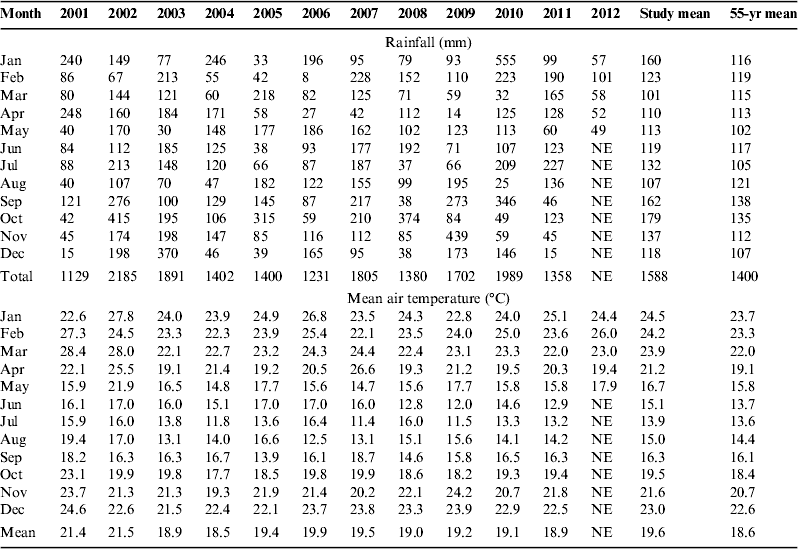
The study was conducted at Espinilho Farm (28°56′14.00″S, 54°20′45.61″W) in the state of Rio Grande do Sul, southern Brazil, between May 2001 and April 2012. The climate type is Cfa according to Köppen, humid subtropical with hot and humid summers and cool and humid wintersReference Moreno17; similar climates are found in the USA, primarily in the southeast. Climate data (Table 1) were taken from a nearby station maintained by the Agricultural and Livestock Research Foundation of Rio Grande do Sul, Brazil.
Table 1. Rainfall and mean air temperature recorded near the experiment (2001–2012).

NE, not evaluated.
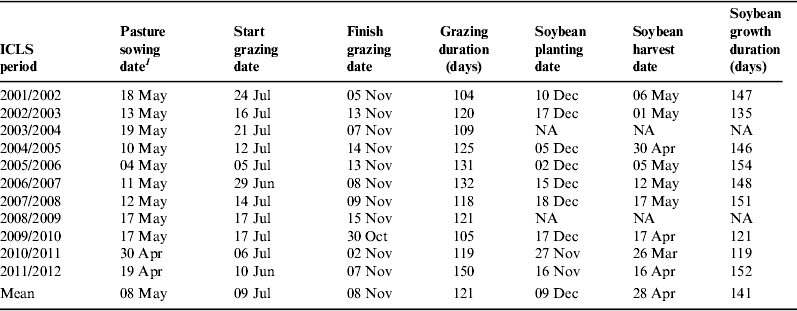
The soil at Espinilho Farm is classified as Rhodic Hapludox (Oxisol) with 540, 270 and 190 g kg−1 of clay, silt and sand, respectively, at 0–20 cm depth. The experimental area was managed since 2001 as an ICLS using no-till. Soybean [G. max (L.) Merr.] was rotated with a mixture of black oat (Avena strigosa Schreb) and ryegrass (Lolium multiflorum Lam) with or without grazing. After inoculation and treatment of soybean seeds with 5,6-dihydro-2-methyl-1,4-oxathi-ine-3-carboxanilide (75 ml ha−1 a.i.), methyl benzimidazol-2-yl-carbamate+methanal (30 ml ha−1 a.i.), molybdenum 10%+cobalt 1%+zinc 1% (75 ml ha−1 a.i.), and fipronil+thiophanate-methyl+pyraclostrobin (50 g ha−1 a.i.), soybean was sown at a density of 35 seeds m−2 with 0.45 m between rows. Black oat was sown in rows with 45 kg ha−1 of seeds, while ryegrass originated annually from natural reseeding. Fertilizers were applied to both soybean and pastures annually. In areas with inoculated soybean, phosphorus and potassium were applied both before and after establishment to achieve a goal of 4 t ha−1 of grain yield. In the pasture phase, 45 kg N ha−1 of urea was applied 40 days after pasture was sown (Table 2), with the objective of developing between 4 and 7 t ha−1 of dry matter (DM).
Table 2. ICLS dates from the experiment in Rio Grande do Sul, Brazil.

NA, not available.
1 The sowing date of black oat. Ryegrass originated from natural reseeding.
Treatments and experimental design
Soybean was planted in five treatments. Cropping system only (CS) was defined as a non-grazed area, whereas ICLS consisted of four sward management heights of 10 (G-10), 20 (G-20), 30 (G-30) and 40 cm (G-40) using put-and-take stocking. This method consisted of using three tester animals per experimental unit (permanent) and a variable animal number with periodic adjustment in an attempt to maintain desired sward heightReference Allen, Batello, Berretta, Hodgson, Kothmann, Li, McIvor, Milne, Morris, Peeters and Sanderson18. Sward height was measured at 100 randomized points in paddocks every 15 days using a sward stickReference Barthram19.
The experimental design was randomized blocks with three replicates, totaling 22 ha. The experimental unit areas ranged from 0.8 to 3.6 ha, according to treatments. Grazing start date generally occurred in July (Table 2) and was defined as the time when herbage mass reached 1500 kg ha−1 of DM. Animals used in the pasture phase were crossbreed steers that were approximately 10 months old and averaged 210 kg initial live weight. The strategy for the grazing period was for steers to graze until early November of each year, then steers were weighed [final live weight (LW)], and hauled to a commercial packing plant, where they were slaughtered for meat production.
Management of crop and livestock
Soybean yield (kg DM ha−1) was determined at the R8 stage (harvest maturity) according to phenology scale developed by Fehr et al.Reference Fehr, Cavines, Burmood and Pennington20. All plants from six samples of 2 m of rows in each paddock were collected. Plant samples were air-dried, and grain was threshed and weighed.
To evaluate livestock production with ICLS under different grazing intensities, average daily gain (ADG, kg d−1) and gain per hectare (GPH, kg ha−1) were calculated. The ADG was obtained by measuring the difference between the initial and the final individual LW of three tester animals throughout the grazing period. The GPH was obtained by multiplying the ADG by the number of animals per hectare each day.
Economic data and analysis
Monthly soybean prices (R$ 60 kg−1) and live cattle prices (R$ kg−1) in Rio Grande do Sul during May 2001 through May 2012 were obtained from the Management Planning Division (Rio Grande do Sul Emater/Ascar). Prices of inputs and operations were obtained from market places in Rio Grande do Sul. For crop inputs, the price survey was collected in November of each year, while May was used for harvesting. For livestock inputs, all values were collected in May. All information was converted into constant R$. Domestic price series were converted from current prices in R$ into constant R$ using the General Price Index (averaged across Brazil cities and all items, from Fundação Getúlio Vargas). To compare the values in US$ the long-term average conversion was made using current R$/US$ exchange rates (daily averages by month obtained from the Central Bank of Brazil/BACEN).
Economic performance was assessed from the five treatments on the basis of gross margin, which is widely used in economics to estimate the production potential of a farmReference Ryschawy, Choisis, Choisis, Joannon and Gibon4, Reference Veysset, Bebin and Lherm21. This represents the net revenue (excluding fixed costs) at the farm levelReference Hanley, Acs, Dallimer, Gatson, Graves, Morris and Armsworth22. In both phases, gross margin per hectare was calculated as follows:
 $$\eqalign{\hskip-50pt{\rm Overall \ gross}\;{\rm margin} = \tab\sum \;{\rm yearly}\;{\rm products} \cr \tab- \sum \;{\rm yearly}\;{\rm costs},}$$
 $$\eqalign{\hskip-40pt\sum {\rm yearly \ products} = \tab \sum \;{\rm crop}\;{\rm products}\,\cr \tab \times({\rm soybean}\;{\rm grains}\;{\rm sales}) \cr \tab + \sum {\rm livestock}\;{\rm products}\,\cr \tab \times({\rm animal\ sales}),} $$
 $$\hskip -5pt\eqalign{\tab \sum {\rm yearly}\;{\rm costs} \cr \tab \quad = \sum \;{\rm crop}\;{\rm operating}\,{\rm costs}\; ({\rm desiccant} \cr \tab \quad\quad+ {\rm soybean\ seed} + {\rm sowing} + {\rm fertilizer} + {\rm herbicide} \cr \tab \quad\quad+ {{\rm fungicide} + {\rm insecticide} + {\rm application} + {\rm harvesting})} \cr \tab \quad\quad+ \sum {\rm livestock}\;{\rm operating\ costs} \;({\rm black}\;{\rm oat}\;{\rm seed} \cr \tab \quad\quad+ {\rm sowing} + {\rm fertilizer} + {\rm animal}\;{\rm purchase} \cr \tab \quad\quad+ {\rm parasite} \; {\rm control} + {\rm application} + {\rm holding}\;{\rm cattle}).} $$
Crop, livestock and economic data in percentage terms
Mean values over the study period were calculated for ADG, GPH, soybean yield and gross margin. Mean values for each treatment were then transformed into percent deviation from the overall mean.
Statistical analysis
Analysis of variance was performed using mixed models (SAS Institute Inc., Cary, NC) with fixed effects for sward management, years (repeated measurements) and the interaction between sward management and year and random effects for blocks (paddocks). When differences between means were detected, treatments were compared using Tukey's HSD test at a significance level of 5%. Pearson correlation analysis was performed between climate data during crop development (December to April) and soybean yield (P<0.05).
Results
Total annual rainfall and its distribution varied greatly during the experimental period in comparison to the long-term average. The long-term mean annual rainfall was 1400 mm (55 years) and the study mean was 1588 mm, with a peak between September and October in both periods (Table 1). Two extreme years were 2010, with the greatest rainfall during the summer, and 2012, with the lowest rainfall. March was the driest month during the study period, with an average of 101 mm of rainfall, ranging from 32 (2010) to 218 mm (2005). The minimum and maximum average monthly temperatures during the experimental period were 13.9 and 24.5 °C in July and January, respectively.
Crop phase
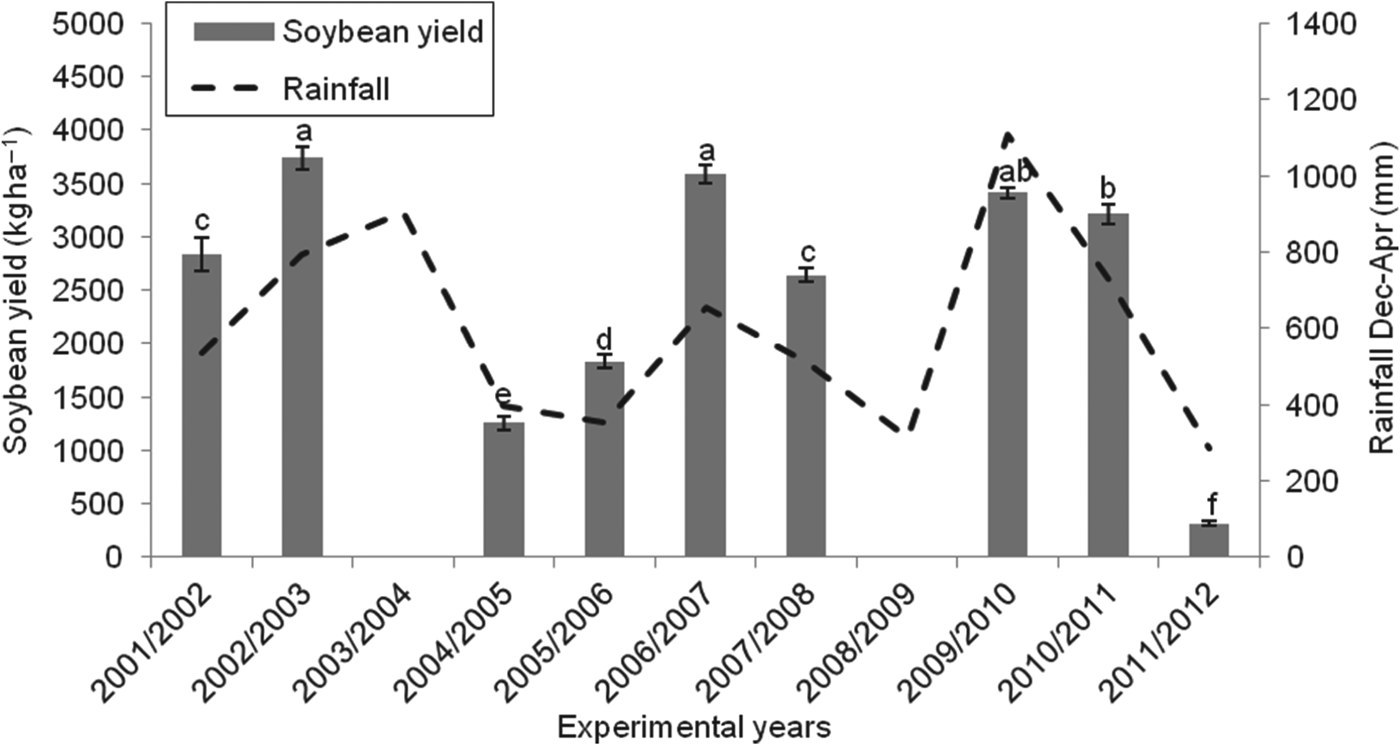
No difference (P>0.05) was observed in soybean yield between cropping system only and ICLS, nor among grazing intensities (2516±103 kg ha−1). There was also no interaction between sward management and experimental years (P>0.05). Soybean yield was affected by experimental years (P<0.001; Fig. 1), where higher values were observed in 2002/2003 (3738±82 kg ha−1), 2006/2007 (3586±82 kg ha−1) and 2009/2010 (3417±85 kg ha−1) and smallest value in 2011/2012 (311±82 kg ha−1). Variation in soybean yield was positively correlated with rainfall (r=0.82; P<0.001).

Figure 1. Soybean yield (kg ha−1) and rainfall from December to April in long-term ICLS experiment in Rio Grande do Sul, Brazil.
Livestock phase
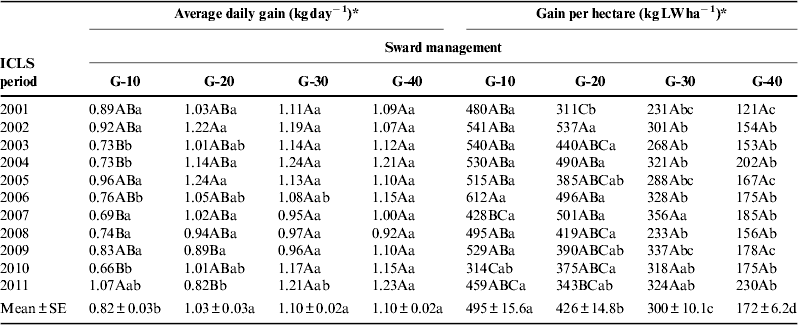
The variables of ADG and GPH showed interactions between sward management and experimental year (P<0.001; Table 3). The interaction for ADG was mainly due to no differences among treatments in 2001, 2002, 2005, 2007, 2008 and 2009, and lower ADG with lower sward heights in 2003, 2004, 2006, 2010 and 2011. Considering the mean values from the study period, ADG was lower when pasture was managed at 10 cm in comparison to sward heights between 20 and 40 cm. The interaction for GPH represented a difference in magnitude of treatment effects among years, in which the strongest decline of GPH with increasing sward height occurred in 2001, 2005 and 2009. In the mean of the study period, with increasing sward heights, a gradual reduction in GPH was observed (P<0.05). Treatment G-10 was the least stable during the 11 years of the study, ranging between 0.663 and 1.072 kg day−1 and between 314 and 612 kg LW ha−1 for ADG and GPH, respectively. Treatment G-20 had intermediate variation, while treatments G-30 and G-40 were most stable, presenting similar values for ADG and GPH among years.
Table 3. ADG and GPH in the long-term ICLS experiment in Rio Grande do Sul, Brazil.

Values followed by different upper-case letters in the column and lower-case in letters the row differ significantly according to the Tukey test (P<0.05). *(P<0.001) for interaction treatment×year. Grazing at 10 cm (G-10), grazing at 20 cm (G-20), grazing at 30 cm (G-30), grazing at 40 cm (G-40).
Economic data
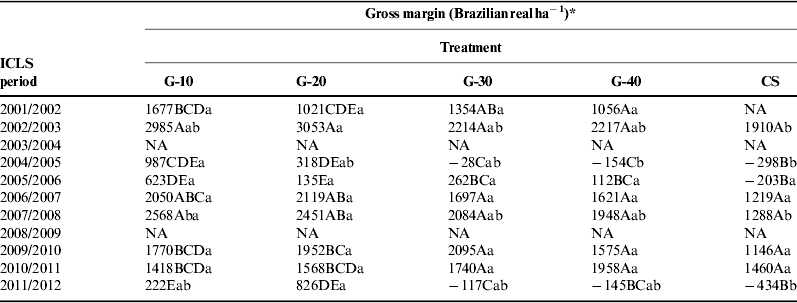
An interaction (P<0.001) between treatments and experimental years was observed for gross margin (Table 4). There was great variability in gross margin during the study period, with higher values observed in 2002/2003, 2006/2007 and 2007/2008 and smaller values in 2004/2005, 2005/2006 and 2011/2012 (Table 4).
Table 4. Gross margin in the long-term ICLS experiment in Rio Grande do Sul, Brazil.

Values followed by different upper-case letters in the column and lower-case letters in the row differ significantly according to the Tukey test (P<0.05). * (P=0.007) for interaction treatment×year. 1 US$=2.27 Brazilian real. Grazing at 10 cm (G-10), grazing at 20 cm (G-20), grazing at 30 cm (G-30), grazing at 40 cm (G-40) and CS (cropping system only). NA, not available.
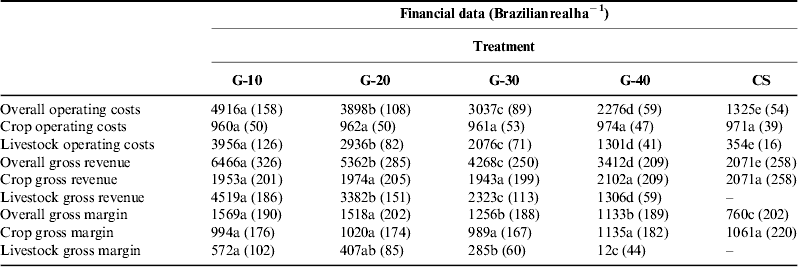
Considering means of the study period (Table 5), gross margin was lower in CS than ICLS (P<0.05). When comparing grazing intensities, greater gross margin was observed in G-10 and G-20 than in G-30 and G-40 (P<0.05). During the crop phase there were no differences in any of the economic factors among treatments. Treatment G-10 had the greatest overall operating cost per ha due to livestock operating costs (P<0.05), whereas CS had the lowest overall operating cost. Regarding revenue, overall and livestock phases showed similar behavior. Livestock gross margin was superior in treatments G-10 and G-20.
Table 5. Economic analysis in the long-term ICLS experiment in Rio Grande do Sul, Brazil.

Values followed by different lower-case letters in the row differ significantly according to the Tukey test (P<0.05). 1 US$=2.27 Brazilian real. Grazing at 10 cm (G-10), grazing at 20 cm (G-20), grazing at 30 cm (G-30), grazing at 40 cm (G-40) and CS (cropping system only).
Variations in treatments relative to overall mean
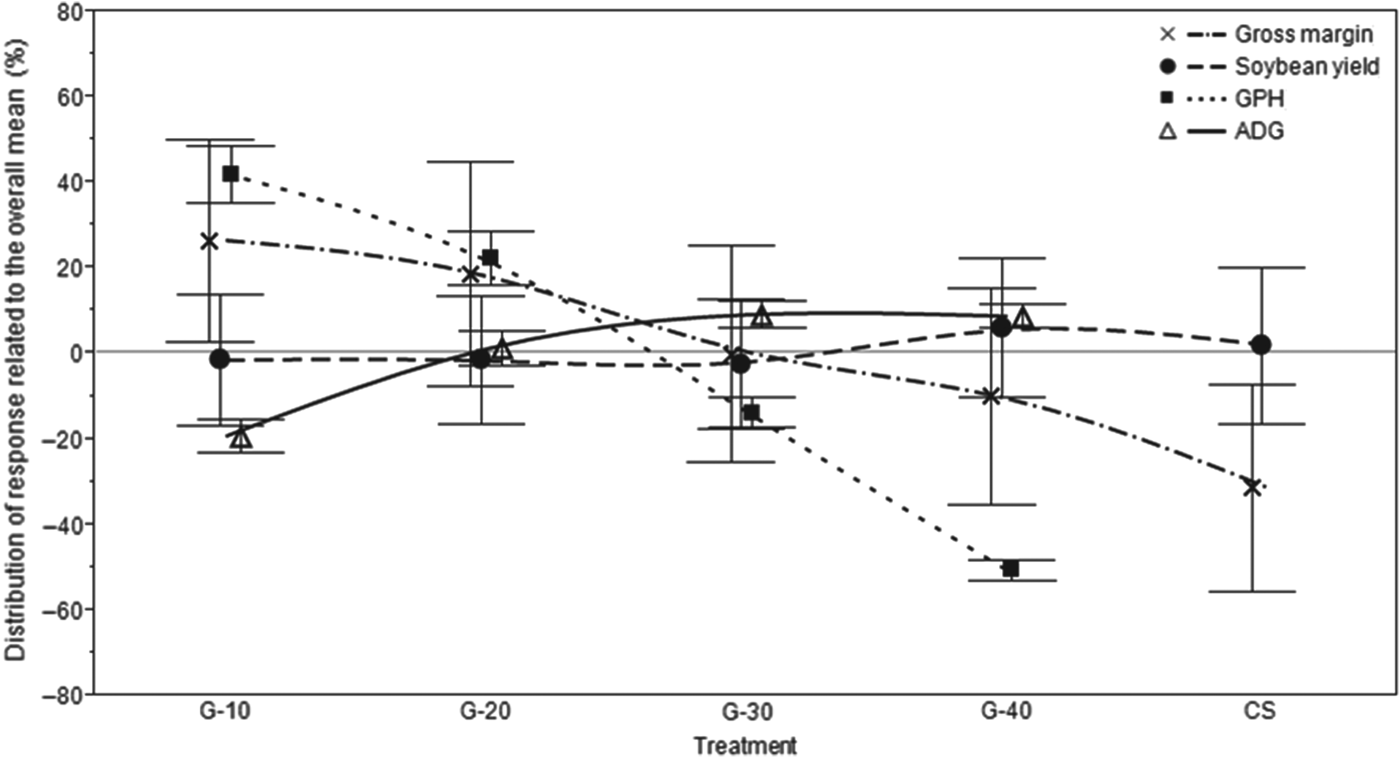
In percentage terms, all treatments were similar for soybean yield (Fig. 2). For GPH, treatments G-10 and G-20 had values superior to the overall mean of the long-term experiment. For ADG, treatment G-10 was inferior and the other treatments were similar to the overall mean of the experiment. Gross margin was superior to the mean of the long-term experiment in treatment G-10 and inferior in CS.

Figure 2. Influence of treatments from the overall mean (%) of gross margin, soybean yield, GPH and ADG in a long-term experiment of ICLS in Rio Grande do Sul, Brazil. Grazing at 10 cm (G-10), grazing at 20 cm (G-20), grazing at 30 cm (G-30), grazing at 40 cm (G-40) and CS (cropping system only).
Discussion
Long-term grazing intensities did not influence soybean yield responses, contradicting the paradigm that grazing animals negatively impact soybean yieldReference Carvalho, Anghinoni, Moraes, Trein, Flores, Cepik, Levien, Lopes, Baggio, Lang, Sulc, Pelissari, Gottschall, Silva and Rodrigues23. Use of no-till with constant presence of plants (soybean and pasture) promotes the stability of soil physical properties. Another study performed in this area showed that changes in soil physical properties observed in areas grazed at different sward heights and in the non-grazed area did not influence soybean establishment and yieldReference Flores, Anghinoni, Cassol, Carvalho, Leite and Fraga24. In a study from IllinoisReference Tracy and Zhang7, trampling and soil disturbance from cattle on cropland had no negative effect on subsequent corn yields and may have helped increase yield over continuous corn plots. A similar analysis found that winter grazing on corn residues had minimal effect on subsequent soybean yieldReference Clark, Russell, Karlen, Singleton, Busby and Peterson25.
Stability of soybean yield between sward management practices may be related to soybean reproductive plasticity and harvest index stability in response to variations in shoot biomassReference Vega, Sadras, Andrade and Uhart26. During soybean growth, rainfall and its distribution varied greatly over the period of this study (Table 1), and variation in annual soybean yield was associated with rainfall (Fig. 1). Similarly, in the main soya growing area of Argentina, soybean yield exhibited high inter-annual variation, with differences of 2000 kg ha−1 or moreReference Bacigaluppo, Bodrero, Balzarini, Gerster, Andriani, Enrico and Dardanelli27.
Considering livestock production, the negative relationship between ADG and stocking rate is well establishedReference Mott28. Therefore, decisions concerning grazing intensity are especially important because of the close relationship between ADG and animal production per hectareReference Diaz-Solis, Kothmann, Grant and Luna-Villarreal29. When increasing grazing intensity, ADG is normally reduced, but greater beef production per unit land area is observedReference Bement30, Reference Derner31. From an initial average LW of 210 kg and considering the grazing duration for each ICLS period (Table 2), G-10 had the lowest final LW (309±5 kg), with increasing weights for G-20, G-30 and G-40 (average of 340±5 kg). Considering the whole ICLS, it should be noted that low sward heights result in lower forage mass and therefore lower amounts of residual DM for no-till managementReference Rocha, Carvalho, Baggio, Anghinoni, Lopes, Macari and Silva32. In the other extreme, increasing sward height increases stem components and total biomass, with consequent reductions in green forage mass and nutrition valueReference Griffiths33. Animals can achieve greater ADG in high swards; however, GPH is significantly reduced (Table 3).
Profit is an important factor in decision making about land use, even in perception of long-term related to specific alternative practicesReference Cary and Wilkinson34. Generally, farmers seek land use and land management to maximize profits, subject to resource constraints and subject to factors beyond their control, including input costsReference Hanley, Acs, Dallimer, Gatson, Graves, Morris and Armsworth22.
Land-use decision making might consider revenue from differences in yields and the probability that crop/livestock yields will be higher than specialized systems. Independent of sward height management, gross margin was greater in ICLS than cropping system only. Comparing years with rainfall during crop development (December to April) above (2002/03; 2006/07; 2009/10; 2010/11) and below (2004/05; 2005/06; 2007/08; 2011/12) the study mean (Table 1), there was a greater difference observed in gross margin between sward height treatments and CS in years with lower rainfall. Gross margin in CS was negative in three of those four years. In years with higher rainfall, gross margin in CS was positive, but still only 72±11% of that in ICLS. The presence of the livestock phase was important to avoid economic loss in years with low rainfall, but important also in wet years to increase economic gain.
Mixed crop–livestock systems also generate higher economic efficiency in saving production costs through complementarities between crop and livestockReference Wilkins35. The CS treatment had an operating cost with cover crop establishment (Table 5) for soil and water conservation. Therefore, ICLS may be considered a strategy to improve economic performance and promote conservation practicesReference Eltun, Korsæth and Nordheim36. As for production, the combination of crops and livestock produces more food than either separately from the same areaReference Schiere, Ibrahim and van Keulen37.
In this long-term experiment, gross margin was optimized for G-10 and G-20 treatments (Table 5), which could be considered heavy and moderate stocking rates, respectively. In Wyoming, the most profitable stocking rate in years with favorable prices was between moderate and heavy, but in years with average or unfavorable prices, the optimum stocking rate was moderate or slightly lowerReference Manley, Hart, Samuel, Smith, Waggoner and Manley38. Environmental risks and costs increase with intensification, as does the level of disturbance and utilization of grasslands, leading to loss of soil resources which increases costs of replacing nutrients and species and in managing nutrient runoffReference Kemp and Michalk39.
Finally, aiming to reduce the economic dependence on single crops and specialized systems by considering grazing management in ICLS, a balance between economic and production outcomes for the system as a whole was achieved with a sward management strategy between treatments G-10 and G-20.
Conclusion
The ICLS investigated was an effective option for diversifying the soybean-cropping system. This long-term research addresses the positive influence of sward management on average daily gain, GPH and gross margin, while showing no effect on soybean yield. The optimal grazing intensity to achieve production and economic goals for this ICLS was reached at 10–20 cm sward height.
Acknowledgements
We gratefully acknowledge the Cerro Coroado Farm for providing the experimental area and animals, the Fundação Agrisus, CNPq and MAPA for financial support and CAPES and CNPq for student's scholarships.


