


Introduction
Economically, the olive tree is the most important fructiferous tree grown in Greece and at the same time is ranked third worldwide. Half of the Greek farmers have included the cultivation of olive trees in their agricultural activitiesReference Tzouvelekas, Pantzios and Fotopoulos1. It is well adapted to a wide range of climatic conditions and is drought resistantReference Tous, Ferguson and Janick2.
Many researchers have stated that olive grove ecosystems are more stable than other agricultural ecosystemsReference Loumou and Giourga3–Reference Fleskens, Duarte and Eicher6. CirioReference Cirio7 argues that this stability may be due to the general stability of the whole olive grove environment, the low level of infection, the resistance against damage caused by pests and the abundance of beneficial arthropod fauna. Generally, the organic olive-farming system seems to be clearly superior to the integrated and conventional ones with respect to biodiversityReference Parra-López and Calatrava-Requena8.
The development of intensive agriculture has focused at maximizing the production, but resulted in severe environmental degradation, as well as degradation of product quality. In conventional farming some objectives are the increase of production, profits through monoculture and intensive soil treatment, irrigation and use of agrochemicals and fertilizers. It should be noted that conventional agriculture is inferior compared to organic agriculture regarding soil ecology and fertility, and this has resulted in the reduction of diversity and abundance of soil organismsReference Kampoyrakis9.
The adoption of modern conventional agriculture is considered to be among the main threats to global biodiversity. A dramatic reduction in the number and abundance of many species associated with farmland has been reported for the last quarter of the 20th century. This reduction leads to increasing concern regarding the sustainability of current intensive production practicesReference Hole, Perkins, Wilson, Alexander, Erice and Evans10.
Organic farming is a low-intensity farming system implemented through the use of biological and mechanical cultivation methods, excluding the use of chemicals and contributing to biodiversity conservation11, Reference Hyvönen, Ketoja, Salonen and Tiainen12. According to European Council Regulation (EC) 834/2007 and Commission Regulation (EC) 889/2008, the aims of an organic production system are to enhance the biological diversity and activity, maintain long-term soil fertility, minimize non-renewable sources and all pollutants and treat agricultural products in a way to maintain the organic integrity and vital substances13.
In 2009, the total organic area accounted for 4.72% of the total agricultural area in the EU27. The highest proportions of organic area were recorded in Austria (18.5% of the total agricultural area), Sweden (12.56%) and Estonia (10.49%). In Greece, the percentage of organic farming was 3.94% of the total agricultural area14, 15 (Fig. 1).
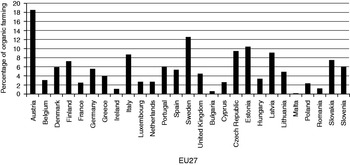
Figure 1. Organic farming (%) in the EU27 in 2009.
In Europe, many studies have been conducted regarding organic farming and wildlifeReference Hole, Perkins, Wilson, Alexander, Erice and Evans10, Reference Ducey, Rauscher, Wiederspan, Miller, Koheler and Mazour16–Reference Chappell, Vandermeer, Badgley and Perfecto26. Specialized research with regard to the effects of management of agricultural ecosystems on the floraReference Moreby, Aebischer, Southway and Sotherton27–Reference Cotes, Castro, Cárdenas and Campos32, avifaunaReference Beecher, Johnson, Case, Brandle, Case and Young33–Reference Hole, Whittingham, Bradbury, Anderson, Lee, Wilson and Krebs36, arthropodsReference Booij and Noorlander37–Reference Sónia, Santos, Pereira, Torres and Nogueira40, butterfliesReference Feber, Firbank, Johnson and MacDonald41 and spidersReference Pfiffner and Niggli42, Reference Reddersen43 has been accomplished.
The role of birds as biodiversity indicators has been widely recognized in biodiversity studiesReference Furness, Greenwood, Jarvis, Furness and Greenwood44–Reference Donald, Pisano, Rayment and Pain47. Bird communities representing the total biodiversity, were considered to be the most appropriate biodiversity indicators because they are easily identifiable, their classification and systematics are well established and their ecology and behavior have been thoroughly studied, making the risk of misinterpretations low. Birds also tend to be high in the food chain and this would help to detect any ‘signals’ that accumulate through the chainReference Furness, Greenwood, Jarvis, Furness and Greenwood44.
In Greece there are a few studies concerning various aspects of biodiversity in conventional and organic farming systemsReference Nikolaidou48–Reference Hadjicharalambous, Kalburtji and Mamolos52. However, there is a lack of comparative studies on biodiversity between conventional and certified organic olive groves in GreeceReference Berki53–Reference Tzaneli56.
The main aim of our study was to assess the effects of conventional and organic farming systems on some aspects of biodiversity of olive grove ecosystems in a typical Mediterranean environment. Plant and bird communities and species were used as a tool to indicate the effects of different management schemes on olive groves. The specific objectives of the study were to compare conventional and certified organic olive grove ecosystems on the basis of: (a) their yield, (b) plant diversity (herbaceous and woody vegetation), (c) diversity and abundance of avifauna, (d) finding easily measurable parameters indicating bird diversity within organic and conventional management systems and (e) the role of integration time of olive groves into the organic farming procedure. All the above objectives are investigated and conclusions are drawn under the restriction of the one-year duration of the study.
Materials and Methods
Study area
Among the olive grove farms of western Magnesia Prefecture, central Greece (39°06′54.80″N, 22°55′16.32″E) a set of 16 farms was randomly selected (eight certified organic and eight conventional). The subset of conventional olive groves included four sprayed and four non-sprayed farms (C1–C4 and C5–C8 farms, respectively) and the subset of organic ones was divided into two groups (four farms in each group), one certified organic for 6 years and one for 10 years (O1–O4 and O5–O8 farms, respectively) (Fig. 2). The area (mean±SE) of farms was respectively (in ha): 39.25±20.95, 43.00±21.11, 29.25±18.64 and 31.00±12.74. The sampling farms were at least 200 m away from each other and the sampling points 100 m away from the farm edge to avoid farm edge effects. The sampling farms are surrounding by olive groves, pastures and natural ecosystems composing a diverse landscape.

Figure 2. Study area (western Magnesia Prefecture, central Greece).
The characteristics and management practices applied to the selected farms are presented in Table 1. The purpose of this selection was to minimize the influence of ‘external’ environmental factors and to allow a better comparison among the four farm management systems.
Table 1. General characteristics and management practices applied to the olive grove farms surveyed.

The study area is included in the Quercetalia ilicis vegetation zone, and Quercion ilicis and Oleo-Ceratonion subzones. The main rock substrate of the study area is metamorphic schist. The climate is characterized as continental with relatively cold winters and hot and dry summers. The mean annual temperature is 18.8°C, the warmest month is July and the coldest January and February (Fig. 3). The mean annual precipitation reaches 350.3 mm and the mean annual air humidity 62%, ranging for the winter between 69 and 77% and for the summer between 55 and 66%57.

Figure 3. Ombrothermic diagram of the study area.
Plant and bird survey
The sampling of herbaceous vegetation was carried out in May 2007 in randomly selected plots of 0.25 m2 (0.5 m×0.5 m), where the number of species, frequency of occurrence and their biomass were estimatedReference Theodorakis58. Woody vegetation was inventoried during the same period in randomly selected sampling plots of 100 m2 (10 m×10 m). In each plot, the number of species, the number of individuals per species (density) and their coverage were measuredReference Koutsidou59.
The avifauna was censused from early May until the middle of June 2007 so as to include the breeding periodReference Farina60, Reference Jobin, Choiniere and Belanger61. For bird counting, the point count method was followedReference Bibby, Burgess, Hill and Mustoe62. The counts were conducted from early morning until 10.30 am and only during the days without rain or wind. Only breeding pairs, represented by territorial males, in each plot of 50 m radius were recorded by two observers. Each count lasted for 10 min. The species diversity and abundance, expressed as breeding pairs per ha (bp/ha), were estimatedReference Blondel, Castri, Goodall and Specht63–Reference Collin, Burgess and Hill65. The number of sampling plots for each treatment (management practice) was: 60 in the 10-year certified organic olive groves, 60 in the 6-year certified organic olive groves, 90 in the sprayed conventional ones and 90 in the non-sprayed conventional ones for each parameter (herbaceous plants, woody plants and birds).
Statistical analysis
Vegetation and bird data were evaluated for normality and homogeneity with the Kolmogorov–Smirnov and Shapiro–Wilk tests. Data were transformed using log10(x+1) when necessary to meet normality assumptionsReference Zar66. For the analysis of vegetation and bird data, the parametric one-way analysis of variance was used. Turkey's HSD (Honestly Significantly Different) pairwise comparison tests were used with P<0.05. Correlations between variables within each taxonomic group were examined using Pearson correlation coefficientsReference Sokal and Rohlf67. Alpha, beta and gamma diversity were calculatedReference Whittaker68. Alpha diversity refers to the diversity within a particular area or ecosystem, and is expressed by the number of species (species richness, Shannon–Weiner index, Simpson index and Berger–Parker index) and evenness (evenness index) in that ecosystem. We also examined the similarity in species diversity (Jaccard index and Sorensen index) between the different olive grove types expressing the beta diversity. Gamma diversity is a measure of the overall diversity of the different ecosystems within a region, whereas HunterReference Hunter69 defines gamma diversity as ‘geographic-scale species diversity’. All relationships between herbaceous plant variables were analyzed by using the Pearson's product moment correlation coefficient r, whereas the description of correlation between woody plant variables was analyzed by using Principal Component Analysis (PCA)Reference Oglethorpe and Sanderson70.
For the definition of biotic indicators of bird species richness on organically and conventionally managed olive groves the calculation of linear regressions between the goal parameter (species richness) and potential indicator parameters was realizedReference Sokal and Rohlf67, Reference Sachs71. High positive correlation of a potential indicator with the goal parameter is considered as a measure of indicator reliability (R 2>0.5, P<0.05)Reference Ekschmitt, Stierhof, Dauber, Kreimes and Wolters72. Seven parameters were chosen as potential indicators of bird species richness: (1) density of all breeding birds, (2) number of herbaceous plant species, (3) biomass production of herbaceous plant species, (4) number of woody plant species, (5) density of the woody plants, (6) percentage cover of woody plant species and (7) altitude. The above indicators were used for predicting the variability of bird diversity within each management system. Accordingly, the correlation between potential indicators and the goal parameter for organic and conventional olive groves was calculated separately. All data analyses were performed using PASW version 18.0 software73.
In order to study changes in generic composition, we used the (indicator value IndVal) method of Dufrêne and LegendreReference Dufrêne and Legendre74. We used Ward's clustering method to group hierarchically the records of birds of the point counts into clusters, expressing the different bird community of each farming system. We also identified the typical species characterizing each of the clusters using the IndVal procedure. These calculations were carried out using the IndVal softwareReference Dufrêne75. A species is considered a ‘symmetrical indicator’ (IndVal>50%) for one cluster, when it is present in >70% of the sites of the cluster and when >70% of its individuals occur in the cluster. A random reallocation procedure (999 iterations) of sites among site groups was used to test IndVal significance (alpha=0.01).
Results
Olive and olive oil production
In the study area during the production period 2006–07, the mean edible olive yield in conventional olive groves reached 56.8±0.99 kg tree−1, while in the certified organic ones the yield was 51.5±3.94 kg tree−1. The olive oil yield in conventional olive groves was, on average, 11.1±0.52 kg tree−1, whereas in the certified organic ones it was 10.0±0.42 kg tree−1. However, neither edible olive yield (P=0.20) nor olive oil yield (P=0.12) showed significant statistical differences between conventional and certified organic olive groves76 (Table 2).
Table 2. Olive and olive oil yield (kg per tree) in organic and conventional olive groves of the study area.

Herbaceous plants
Frequency of occurrence
In total, in the olive groves studied [certified organic (10 years), certified organic (6 years), conventional (non-sprayed), conventional (sprayed)] 56 species of herbaceous plants belonging to 20 families were recorded (Table 3).
Table 3. Frequency of occurrence (%) of the herbaceous plant species in the olive groves under different management system (asterisk (*) denotes significant difference in the frequency of occurrence of herbaceous plants among farming systems).

Independently of the management practices applied, Poaceae and Asteraceae were the most important families in terms of number of plant species structuring the herbaceous plant community of the olive groves studied, including 30 and 23% of the total plant species recorded, respectively. All the families represented by a unique species were grouped into one category. Other families recorded include Zygophyllaceae, Hypericaceae, Chenopodiaceae, Linaceae, Liliaceae, Rosaceae, Cistaceae, Lamiaceae, Dispacaceae, Scrophullariaceae, Amaranthaceae, Malvaceae and Apiaceae (%) (Fig. 4).

Figure 4. Families of herbaceous plants (%) recorded in the olive groves of the study area.
The most frequently occurring plants in each farming system were Daucus carota (28.3%) in the 10-year certified organic olive groves, Aegilops geniculata (55%) in the 6-year certified organic ones, D. carota and Scabiosa stellata (20%) in the sprayed conventional ones and S. stellata (30%) in the non-sprayed conventional ones.
Alpha, beta and gamma diversity
The 10-year certified organic olive groves exhibited the highest values of species richness (38), Shannon diversity index (0.28), Simpson index (0.26), evenness index (0.27) and Berger–Parker index (0.17), whereas the sprayed conventional olive groves had the lowest values (15, 0.03, 0.04, 0.04 and 0.10, respectively) (Table 4).
Table 4. Values of alpha diversity indexes of the herbaceous vegetation in olive groves under different management systems.

* Different letters (row) mean statistically significant differences for significance level P<0.05.
Concerning the alpha diversity of herbaceous plants, significant statistical differences of the species richness, Shannon diversity, Simpson, Evenness and Berger–Parker indexes (P<0.05) were found between the different management systems.
The highest values of the Jaccard and Sorensen indexes were found between the 10-year certified organic olive groves and the 6-year certified organic ones (0.59 and 0.74, respectively), whereas the lowest value was estimated between the 10-year certified organic olive groves and the sprayed conventional ones (0.18 and 0.31, respectively) (Table 5). As concerning the total number of herbaceous species of all olive groves it was 56, representing the gamma diversity.
Table 5. Values of beta diversity indexes of the herbaceous vegetation in olive groves under different management systems.

* C j, Jaccard index; ** C s, Sorenson index; *** different letters (column) mean statistically significant differences for significance level P<0.05.
Biomass production
The highest biomass production of herbaceous plants (g m−2) was estimated in the 10-year certified organic olive groves (1.53±0.02) and the lowest was in the sprayed conventional olive groves (0.88±0.04). Significant statistical differences (F=53.10 and P=0.00) were detected in the biomass produced among the different types of olive groves of the study area (Fig. 5).

Figure 5. Herbaceous plant biomass production (g m−2) in the different types of olive groves (different letters mean statistically significant differences for significance level P<0.05).
Species richness and diversity relationships
A very strong linear correlation was found between the number of species of herbaceous plants and the Shannon diversity index (r=0.96 and P=0.00) (Fig. 6), whereas a moderate linear correlation was found between the Shannon diversity index and biomass (r=0.50 and P=0.00). A weak linear correlation was detected between the number of species of herbaceous plants and biomass (r=0.42 and P=0.00), the number of species of herbaceous plants and altitude (r=0.23 and P=0.00), biomass and altitude (r=0.17, P=0.00) and the Shannon diversity index and altitude (r=0.22 and P=0.00).

Figure 6. Linear correlation between the number of plant species and the Shannon diversity index.
Woody plants
Frequency of occurrence
A total number of 17 species of woody plants were recorded in all types of olive groves of the study area [certified organic (10 years), certified organic (6 years), conventional (non-sprayed), conventional (sprayed)].
The most frequently occurring woody species were: Olea europaea var. sylvestris (55.2%) in the certified organic (10 years), O. europaea var. sylvestris (42.6%) and Vitex agnus castus (42.6%) in the certified organic (6 years), Pistacia terebinthus (45.0%) in the conventional (sprayed) and Pistacia lentiscus (36.1%) in the conventional (non-sprayed) (Table 6).
Table 6. Frequency of occurrence (%) of woody plant species in the different olive grove types (asterisk (*) denotes significant difference in the frequency of occurrence of woody plants among farming systems).

Alpha, beta and gamma diversity
As regards the woody plant alpha diversity, the highest value of the species richness (17) was estimated in the sprayed conventional olive groves, whereas the highest values of Shannon diversity index (0.31), Simpson index (0.26), evenness index (0.29) and Berger–Parker index (0.21) were estimated in the 6-year certified organic olive groves. Significant statistical differences in the species richness, Shannon diversity, Simpson, evenness and Berger–Parker indexes were found (P<0.05) among the different management systems (Table 7).
Table 7. Values of alpha diversity indexes of the woody vegetation in olive groves under different management systems.

* Different letters (row) mean statistically significant differences for significance level P<0.05.
As concerning the Jaccard index and Sorensen index, their highest values were calculated between the 10-year certified organic olive groves and the 6-year certified organic olive groves (0.92 and 0.9, respectively) (Table 8). The total number of species recorded in all olive groves was 17, which represent the gamma diversity.
Table 8. Values of beta diversity indexes of woody vegetation in olive groves under different management systems.

* C j, Jaccard index; ** C s, Sorenson index; *** different letters (column) mean statistically significant differences for significance level P<0.05.
Density
The highest density (individuals per ha) of woody plants (7.00±0.32) was recorded in the 10-year certified organic olive groves, whereas the lowest density (2.91±0.16) was recorded in the sprayed conventional olive groves. Significant statistical differences were detected (F=55.18 and P=0.00) in the density of woody plants among the farming treatments (Fig. 7).

Figure 7. Mean density (individuals/ha) of woody plants in the different types of olive groves (different letters mean statistically significant differences for significance level P<0.05).
Cover
The highest percentage (%) cover of woody plants was recorded in the 10-year certified organic olive groves (0.60±0.02), whereas the lowest percentage cover was in the sprayed conventional olive groves (0.34±0.01). Significant statistical differences (F=25.81 and P=0.00) in the percentage of woody plant cover among the different types of olive groves were detected (Fig. 8).

Figure 8. Percentage of woody plant cover (%) in the different types of olive groves (different letters mean statistically significant differences for significance level P<0.05).
Relationships between variables of woody plants
According to the PCA results (Table 9) five axes explain the whole variability observed among the five variables of woody plants tested (number, density, Shannon diversity index, percentage of cover of woody plant species and altitude). The first two axes (components) together explain 75.56% of the variance in variables of woody plants relation (component 1=57.48% and component 2=18.07%). For component 1, correlation between the number, density and Shannon diversity index of woody plant species was detected, whereas for component 2 moderate correlation between percentage cover and altitude was observed (Fig. 9).

Figure 9. Relationships among selected variables of woody plant species tested with PCA.
Table 9. Summary results of the axes of PCA for selected variables of woody plants.

The PCA resulted in the following equalization: for the component 1, 0.95 number of species + 0.91 Shannon diversity index + 0.86 density + 0.43 cover + 0.43 altitude; and for the second component, − 0.20 number of species − 0.30 Shannon diversity index − 0.02 density + 0.67 cover + 0.54 altitude.
Breeding birds
Frequency of occurrence of breeding bird species
In total 24 species of breeding birds were recorded in the olive groves under different farming systems [certified organic (10 years), certified organic (6 years), conventional (non-sprayed), conventional (sprayed)] (Table 10). Four of them are Species of Conservation Concern (SPEC) according to the Birds Directive (2009/147/ EC, former 79/409). More specifically, the Olive-tree warbler (Hippolais olivetorum) and Red-backed shrike (Lanius collurio) are included in the Annex I of the Directive and the European turtle dove (Streptopelia turtur) and Common blackbird (Turdus merula) in the Annex II/2. A clear trend in the number of breeding bird species in relation to the specific farming system was not detected (F=0.78 and P=0.50). All olive grove types as a whole exhibited high ornithological importance, as three and eight species of unfavorable conservation status concentrated or not in Europe (SPEC 2 and SPEC 3) were recorded, respectively (Table 10).
Table 10. Frequency of occurrence (%) of breeding bird species in olive groves under different management systems.

1 ‘SPEC 1’ Species of global conservation concern, i.e., classified as globally threatened. Near threatened or data deficient; ‘SPEC 2’ for species with unfavorable conservation status in Europe whose global populations are concentrated in Europe; ‘SPEC 3’ for species with unfavorable conservation status in Europe whose global populations are not concentrated in Europe; ‘SPEC 4’ for species with a favorable conservation status in Europe whose global populations are concentrated in Europe.
2 I, insectivorous; G, granivorous; I/G, insectivorous/granivorous.
On the basis of their feeding preferences (food category) only slight differences in the number of bird species per food category among the different farming systems were observed. More specifically, 15 insectivorous, six granivorous and three insectivorous/granivorous bird species were observed in the study area. Among them nine insectivorous species were recorded in the 10-year certified organic olive groves and ten insectivorous species in each of the rest olive grove types.
Regarding the granivorous birds, six of them were recorded in the non-sprayed conventional olive groves and five species in each of the rest olive grove types. Furthermore, three insectivorous/granivorous species were observed in the 10-year certified organic olive groves and two in each of the other farming systems.
The Eastern olivaceous warbler was the most frequently occurring species in the study area, accounting for 35% of the frequency of occurrence in the 10-year certified organic olive groves, 41.7% in the 6-year certified organic ones, 38.3% in the sprayed conventional ones and 41.4% in the non-sprayed conventional ones.
Species diversity
Almost the same number of species was found in all types of olive groves. On the basis of diversity indexes the highest bird diversity was recorded in the 6-year certified organic olive groves [Shannon diversity index (0.21), Simpson index (0.20), Evenness index (0.21) and Berger–Parker index (0.19)]. No significant statistical differences in the species richness, Shannon diversity, Simpson, Evenness and Berger–Parker indexes, were detected among the olive groves of different farming systems (P>0.05) (Table 11).
Table 11. Values of alpha diversity indexes of the breeding bird species in olive groves under different management systems.

Different letters (row) mean statistically significant differences for significance level P<0.05.
As concerning the Jaccard index and Sorensen index, their highest values were calculated between the non-sprayed conventional olive groves and the sprayed conventional ones (1.0 in both cases) (Table 12). The overall number of breeding bird species recorded in the olive groves of all management systems (24) represents the gamma diversity.
Table 12. Values of beta diversity indexes of breeding bird species in olive groves under different management systems.

* C j, Jaccard index; ** C s, Sorenson index; *** different letters (column) mean statistically significant differences for significance level P<0.05.
Density
In Fig. 10, the average number of breeding pairs (bp) of birds per hectare (density) in the different management systems of olive groves are presented. The highest density of breeding birds (bp/ha) was recorded in the 10-year certified organic olive groves (7.07±0.3) and the lowest one in the sprayed conventional olive groves (4.9±0.16). However, no significant statistical differences (F=1.82 and P=0.14) in the breeding density among the different types of farming systems were recorded.

Figure 10. Mean breeding bird density (b.p. ha−1) in the different types of olive groves (different letters mean statistically significant differences for significance level P<0.05).
Biotic and abiotic indicators of bird species richness
The density of breeding birds proved to be the best predictor of the number of breeding bird species within certified organic and conventional olive groves, explaining 71 and 93% of the number of breeding species variance, respectively (R 2=0.71 and 0.93) (Fig. 11a,b). Also, number and biomass production of herbaceous species, number, density and cover of woody species, as well as altitude could not be used to predict the numbers of breeding bird species (Table 13).

Figure 11. Correlation between the number and density of breeding birds (b.p. ha−1) in a) organic and b) conventional olive groves.
Table 13. Number of breeding bird species (y) as a function of seven potential indicators.

Typical bird species
Among the 24 species included in the analysis, nine had a significant IndVal index at one or several levels of the typology (Fig. 12 and Table 14). Two species [Eurasian Jay (100.00)–Northern wheatear (50.00)] had their maximum value in the 10-year certified organic olive groves, three species [Common cuckoo (100.00)–Orphean warbler (75.00)–Red-backed shrike (75.00)] in the 6-year organic ones, four species [Common linnet (50.00)–Pied flycatcher (50.00)–Whinchat (50.00)–Eurasian hoopoe (50.00)] in the non-sprayed conventional ones, but no species were found as typical and characteristic of the sprayed conventional olive groves.

Figure 12. Hierarchical clustering of the bird records in the sampling sites produced by Ward's method in relation to the different farming systems.
Table 14. Results of the IndVal analysis for bird species. Typical species (IndVal>50%) underlined.

1 1, Organic olive groves (10 years); 2, organic olive groves (6 years); 3, conventional olive groves (non-sprayed). 4, conventional olive groves (sprayed).
Discussion
Yield of olive groves
During our study period (2007) neither extreme climatic conditions nor plant diseases or pests were recorded in the study area, indicating a favorable year for the olive production. The conventional olive groves gave slightly higher, but not significant, mean yield in comparison with the certified organic ones, concerning both the olive oil and the edible olive production (kg tree−1). This differentiation may be due to the systematic use of inputs in conventional olive groves or/and the relatively short period of organic farming practices applied to the rest of the olive groves. Another possible reason may be the proximity of conventional to certified organic olive groves that may have delayed the equilibrium between trees and pests and diseases in the organic ones. Parra Lopez and Calatrava RequenaReference Parra-López and Calatrava-Requena8 stated that organic techniques applied in olive groves of Spain was inversely related to the yield due to a reduction in productivity inherent to organic farming, particularly in the first steps of the conversion process.
Herbaceous plants
The analysis of herbaceous flora of the olive groves studied showed that families Poaceae and Asteraceae exhibited higher proportions in frequency of occurrence. The families Poaceae, Asteraceae, Fabaceae, Caryophyllaceae and Labiatae, among the richest of the Greek flora, were represented in our study by more than 50 taxa eachReference Karetsos77, Reference Dimopoulos78. Similar observations have been made by Uysal and KarabacakReference Uysal and Karabacak79 and UremisReference Uremis80 in Turkey and TzaneliReference Tzaneli56 in Greece.
The highest frequency of occurrence (%) was recorded for the species A. geniculata in the 6-year certified organic olive groves, a species frequently occurring in olive grovesReference Wilson81. The highest alpha diversity was recorded in the 10-year certified organic olive groves. More specifically, they exhibited the highest number (species richness), diversity (Shannon, Simpson and Berger–Parker index) and evenness (Evenness index). Based on alpha diversity values there is an indication that 10 years of organic process in olive groves is a significant period for the creation of favorite conditions for the establishment of relatively rich herbaceous plant diversity. Similar results have been reported by a number of other studies conducted in various types of agroecosystems. Also, the species diversity, the total and mean numbers of species are usually higher in organic than in conventional farming systemsReference Rydberg and Milberg82, Reference Hyvönen and Salonen83. Pleasant and SchlaterReference Pleasant and Schlater84 also reported that the organic fertilization can increase the diversity of weed species by introducing additional species. Moreover, the abundance of herbaceous species has been found to be higher in certified organic fields than in conventional fields in 16 out of 17 studies reported by Hole et al.Reference Hole, Perkins, Wilson, Alexander, Erice and Evans10 in a relevant literature review.
On the basis of the Jaccard index and Sorensen index of similarity (beta diversity) the 10-year certified organic olive groves and the 6-year certified organic olive groves showed the highest values of similarity among all olive grove types as regards the plant diversity of understorey. Obviously, the similar management practices applied and the possible similarity in soil composition were responsible for this result. Conclusively, organic farming practices have resulted in a more diverse herbaceous layer in the olive groves of our study area. Although this is a general conclusion, in similar studies HaldReference Hald85 and Hyvönen et al.Reference Hyvönen, Ketoja, Salonen and Tiainen12 found high similarity in the herbaceous plant community among organic and conventional fields.
Biomass is a basic characteristic of vegetation, which reflects the fertility of soil resources used by specific plant speciesReference Bonham86. Among all the olive groves managed in different ways a significantly higher amount of herbaceous plant biomass (g m−2) was produced in the 10-year certified organic olive groves. It is supposed that the non-use of agrochemicals might have a positive effect on biomass production in certified organic olive groves, where the soil after 10 years of organic farming may have been differentiated to a large extent in comparison to the conventional system, but even the inorganic olive groves with shorter period of integration (6 years). The time that is necessary for radical changes to appear in the soil parameters varies greatly. In some cases a few years of organic farming are enough for the appearance of this differentiationReference Drinkwater, Letoumeau, Workneh, Van Bruggen and Shennan87, while in other cases even a 10-year period of organic agriculture is not sufficientReference Ryan88. According to various studies on organic agriculture, a higher density and biomass of herbaceous plants has been estimated in comparison with those found in conventional agricultureReference Maeder, Fliessbach, Dubois, Gunst, Fried and Niggli89–Reference Roschewitz, Gabriel, Tsharntke and Thies91. In contrast to this, Poveda et al.Reference Poveda, Dewenter, Scheu and Tscharntke92 found that plant biomass of conventional farms exceeded that of certified organic ones, presumably became of the higher nutrient input in the conventional farming system.
Furthermore, positive correlations were found between the following pairs: number of species of herbaceous plants and Shannon diversity index, Shannon diversity index and biomass, number of species of herbaceous plants and biomass, number of species of herbaceous plants and altitude, biomass and altitude, and the Shannon diversity index and altitude. Kharkwal et al.Reference Kharkwal, Mehrotra, Rawat and Pangtey93 have pointed out that altitude and climatic variables are determinants of species richness. The diversity of life forms usually decreases with the increase in altitude and only one or two life forms remain at extreme altitudesReference Pavón, Hernandez-Trejo and Rico-Gray94. Also, many studiesReference Grace95–Reference Symstad, Chapin, Wall, Gross, Huenneke, Mittelbach, Peters, Thebault and Loreau99 have shown that the relationships between plant species diversity and productivity are strongly scale dependent. Furthermore, at an individual species level, all relationships between plant diversity and above-ground biomass from local scale to landscape and regional scales are positive and non-linearReference Ni, Wang, Bai and Li100. Vujnovic et al.Reference Vujnovic, Wein and Dale101 considered altitude, aspect and slope as important factors in configuration of biodiversity, in contrast to HashemiReference Hashemi102, considering altitude as a non-meaningful parameter for biodiversity.
Woody plants
The wild-type olive tree (O. europaea var. sylvestris) as expected, was the most frequently (%) appearing woody plant species, more specifically in the 10-year certified organic olive groves. The species is abundant through the Mediterranean regionReference Wilson81. Some parameters, such as seed abundance, seed dispersal, possible soil fertility due to organic matter deposition and adaptability to poor soil conditions and dry and hot climate, have favored the dense development of the species, especially in the certified organic olive groves. This is the reason for the use of the wild olive tree as a source of cultivated varietiesReference Therios103.
Species richness is a simple and easily interpretable indicator of biological diversityReference Peet104. In the present study, the highest value of the woody species richness were estimated in the sprayed conventional olive groves, justified by the fact that herbicides applied in this type of olive groves had no effect on the woody species. The highest values of Shannon diversity index, Simpson index, Evenness and Berger–Parker index were observed in the 6-year certified organic olive groves. According to Petersen et al.Reference Petersen, Axelsen, Tybirk, Aude and Vestergaard105 flora abundance, richness and diversity indexes were higher in certified organic farms than in conventional ones. Positive effects of organic farming on the flora and fauna diversity have been well documented for various cropsReference Hole, Whittingham, Bradbury, Anderson, Lee, Wilson and Krebs36, Reference Ahnström106.
On the basis of the Jaccard index and Sorensen index (beta diversity) for the woody plants, the 10-year and 6-year certified organic olive groves showed the highest values of similarity. This differentiation could be attributed to the farming methods applied to the certified organic olive groves being quite different to those applied to the conventional ones.
In our study, an increased woody plant cover (%) and density (individuals/ha) were observed in the 10-year certified organic olive groves. This may be due, in addition to the farming practices applied, to the soil conditions configured under this system. There is scientific evidence that organic farming can improve soil physical and biological properties related to the build-up of organic matterReference Condron, Cameron, Di, Clough, Forbes, McLaren and Silva107, Reference Fliessbach, Oberholzer, Gunst and Mäde108. Possibly, the manure applied to the 10-year certified organic olive groves favored the growth of the foliage of woody species resulting in increased cover and density.
According to PCA, a positive correlation between the species number, density and Shannon diversity index of woody plants was recorded. Also, a correlation between percentage of woody plant cover and altitude was detected. Diversity has been recognized as a community attribute related to stability, productivity and trophic structureReference McIntosh109–Reference Tilman111. Species richness or the number of species is currently the most widely used diversity measure. Relative species abundance of a community is another factor that affects diversityReference Hurlbert112. AlataloReference Alatalo113, Schluter and RicklefsReference Schluter, Ricklefs, Ricklefs and Schluter114 and HustonReference Huston115 have long argued that species abundance and proportional diversity are simply and directly related to the species richness.
Breeding bird species
Our results indicated that the ornithological importance of the study area, independently of the different farming practices applied to olive groves, seemed to be high. The Eastern olivaceous warbler was the most frequently observed bird species, with the highest percentage of occurrence (%) in the 6-year certified organic olive groves. The species is common in the olive groves, breeding in dry scrub areas, shrub parks, uncultivated land, riverine zones and orchardsReference Mullarney, Zetterstrom and Grant116.
It is remarkable that almost the same number of breeding bird species was found in all types of olive groves, whereas the highest values of Shannon, Simpson and Berger–Parker indexes and Evenness diversity were recorded in the 6-year certified organic ones. The highest value of overall breeding bird density (b.p. ha−1) was observed in the 10-year certified organic olive groves. The lack of differentiation in the number of breeding bird species between certified organically and conventionally managed olive groves was possibly due to the relatively short period of conversion to organic system (6 and 10 years for the two organic types, respectively). This period, under the specific environmental conditions, may not be sufficient for the creation of additional niches and subsequent establishment of more numerous species. Although herbicide use in conventional olive groves probably results in decreased foraging opportunities, direct effects on birds appear unlikely to be the main factor determining the number of bird species in this case. Generally, herbicides commonly used in agriculture may not be acutely toxic to birds, but they may have direct harmful effects to some insects that the birds feed uponReference Freemark and Boutin117. However, Round et al.Reference Round, Gale and Brockelman118 found that mixed fruit orchards were about 75% as rich in bird species as the nearby natural forest. Moreover, in spite of the benefits of certified organic fields to birds, their use by them does not necessarily mean higher reproductive successReference Van Horne119. Also, the wider the differentiation of vegetation the more species take advantage of the area for their food, reproduction and coverReference Cody64.
According to Genghini et al.Reference Genghini, Gellini and Gustin34 the differentiation of the avifauna between orchards managed conventionally and organically could be attributed mostly to the different pest management and secondarily to some aspects of environmental differentiation (height, density, cover of trees and increased presence of hedgerows and woodlots). Also, Weibull et al.Reference Weibull, Östman and Granqvist120 stated that the main factor affecting bird communities is the supply of insects, the density of which is probably reduced in conventional farms due to chemical treatments. Moreover, effects of herbicides on weed seed resources are suspected to have contributed to the decline of seed-eating birds. Although effects on winter densities have been shown,Reference Bradbury, Bailey, Wright and Evans121 population level effects are yet to be demonstrated, partly because of analytical difficultiesReference Boatman, Brickle, Hart, Holland, Milsom, Morris, Murray, Murray and Robertson122. However, Wolnicki et al.Reference Wolnicki, Lesinski and Rembiakowska123 found that insectivorous and granivorous birds were more abundant on the organic farms, where their mean density was at least twice as high as that of conventional farms. The most likely reason that our certified organically managed fields support richer bird communities is the better foraging opportunities associated with vegetation diversity.
Concerning the presence of species with unfavorable conservation status (SPEC 2 and SPEC 3 species), no clear differentiation among the specific olive grove types was observed. This could be attributed to the selection by these species of a wider habitat rather than a specific olive orchard treated in organic or conventional way.
The reduced density of breeding birds in the conventional olive groves in comparison with the certified organic ones may be due to the increased use of pesticides which lead to the decrease of food (insects, seeds). Herbicide use in conventionally managed fields, which removes broad-leaved herbaceous plants, is listed as a cause of population decline of some farmland birds in EuropeReference Newton, Marzluff and Sallabanks124.
As regards the bird diversity, on the basis of the Jaccard index and Sorensen index (beta diversity), the sprayed conventional olive groves and the non-sprayed conventional ones exhibited the highest value of similarity. Determinants of beta diversity include dispersal and niche limitationReference Gaston, Evans, Lennon, Storch, Marquet and Browm125, Reference Qian126. Stais and PyrovetsiReference Stais and Pyrovetsi127 reported that structure of vegetation, human activities, abundance of food and weather conditions can affect the spatial distribution and diversity of bird species.
Indicators of bird species richness
The density of breeding bird species (b.p. ha−1) was correlated significantly with the goal parameter ‘number of breeding bird species’ in our study, being proved as an indicator of the density. Species richness and density of animals can be affected by numerous environmental factors such as habitat, soil type and weatherReference Møller and Mousseau128. NilsonReference Nilson129 in Sweden, Stirling and WilseyReference Stirling and Wilsey130 in Chicago, USA, Verhulst et al.Reference Verhulst, Báldi and Kleijn131 in Hungary and Ding et al.Reference Ding, Yuan, Geng, Lin and Lee132 in Taiwan found in their studies that bird species richness was correlated with bird density. Also, Kissling et al.Reference Kissling, Field and Böhning-Gaese133 suggested that bird and woody plant species richness are linked via functional relationships. In contrast, Ranjit Daniels et al.Reference Ranjit Daniels, Daniels, Joshio and Gadgil134 found that bird species richness was inversely related to woody plant species diversity. However, from similar studies poor relationships between taxa have been reported from groups believed to be good indicatorsReference Vessby, Soderstrom, Glimskar and Svensson135–Reference Wolters, Bengtsson and Zaitsev137.
Typical species
The characterization of nine species, occurring almost exclusively in specific farming systems and with high abundances, as typical species of those farming systems, can serve as a conservation tool for the management and monitoring of the study area. Two of them (Eurasian jay, Northern wheatear) were considered as 10-year certified organic olive grove indicators, three species (Common cuckoo, Orphean warbler and Red-backed shrike) as indicators of the 6-year certified organic olive groves and four others (Common linnet, Pied flycatcher, Whinchat and Eurasian hoopoe) as indicators of the non-sprayed conventional olive groves.
The species Eurasian jay, Common cuckoo, Orphean warbler, Pied flycatcher, Whinchat and Eurasian hoopoe prefer as habitat woodlands, orchards, olive groves and cultivations and the species Red-backed shrike, Common linnet and Northern wheatear, prefer shrubs, pastures and firewoodsReference Mullarney, Zetterstrom and Grant116, 138.
Conclusions
In our study area, the yield (edible olives and olive oil) of the certified organic olive groves was not significantly different from that of the conventional ones. In the whole study area, 56 species of herbaceous plants belonging to 20 families were recorded. Significant differences in alpha diversity of the herbaceous plants among the different farming treatments were found, with the highest values recorded in the 10-year certified organic olive grove system. Moreover, the highest herbaceous plant diversity expressed by the Jaccard index and Sorensen index was found in both types of certified organic olive groves (10- and 6-years). The highest biomass production of the herbaceous layer was measured in the 10-year certified organic olive groves.
In total, 17 species of woody plants were recorded in our study area. Similarly, significant differences in alpha diversity among the different farming systems were found, with conventional olive groves (sprayed) and 6-year certified organic olive grove systems exhibiting the highest values. However, concerning the Jaccard index and Sorensen index, their highest values were calculated in both types of certified organic olive groves. The highest density and cover of woody plants were observed in the 10-year certified organic olive groves.
In the olive groves studied, 24 species of breeding birds were recorded (15 insectivorous, six granivorous and three insectivorous/granivorous species). Four of them are species of conservation concern according to the EU Birds Directive (2009/147). More specifically, the Olive-tree warbler and Red-backed shrike are included in Annex I, and European turtle dove and Common blackbird in the Annex II/2, of the Directive. No significant differences in bird diversity were found among the different types of olive groves based on the Berger–Parker dominance index, the species richness, Shannon diversity index, Simpson index and Evenness index. However, according to Jaccard and Sorensen indexes, conventional olive groves (sprayed and non-sprayed) showed the highest values. Moreover, no significant differences in the breeding density among the different types of farming systems were recorded. It is important that the density of all breeding birds within certified organic and conventional olive groves proved a good indicator of species richness of breeding birds.
Four species of birds, Eurasian jay, Common cuckoo, Orphean warbler and Red-backed shrike, were strongly associated with a specific farming system. Eurasian jay and Common cuckoo–Orphean warbler–Red-backed shrike were associated with 10-year certified organic olive groves and 6-year certified organic ones, respectively, and could be regarded as ‘characteristic’ species for the two farming systems.
Consequently, according to our findings there is a trend for increasing alpha diversity of herbaceous plant species in the 10-year certified organic olive groves and beta diversity in the 10- and 6-year certified organic olive groves. Similar trends were detected for alpha diversity of woody plants in the 6-year certified organic olive groves, beta diversity in both types of organic farming, density and cover of woody plants and density of breeding birds in the certified organic olive groves. It seems that the effect of time since the integration of the organic farming procedure was very important for defining the benefits for the herbaceous and woody plants.
We finally conclude that, given the restrictions of our study area (relative small field size, proximity of certified organic and conventional olive groves, short period of organic farming procedure), organic farming favors some aspects of diversity of herbaceous and woody plants of olive grove ecosystems. On the contrary, similar effects on breeding bird diversity and density were not clearly documented. However, breeding bird density proved a good indicator of their richness. Therefore, more comparative research on herbaceous and woody plant species diversity and abundance, as well as on bird and other faunal diversity and abundance, in certified organic and conventional olive groves is needed. Such research has to be based on large-sized farms or, better, on extended areas of uniform management, aiming at the extermination of any possible effects of neighboring farms. Other components of olive grove biodiversity (insects, small mammals, reptiles and soil fauna) must also receive emphasis. Finally, the research should be extended to more biotic and abiotic parameters serving as potential indicators for bird species richness within certified organic and conventional olive groves.


