Introduction
‘Pastured’ or ‘free range’ poultry is an alternative production system where chickens, turkeys or other poultry types are raised completely on fenced-in pasture or small, open-air moveable pens where birds have access to fresh pasture dailyReference Sossidou, Dal Bosco, Elson and Fontes 1 . The birds forage for up to 20% of their food while receiving supplemental grain-based feeds 2 . In recent years, the demand by consumers for free-range or pasture-based poultry has increased concern with a growing awareness of animal welfare issues, as well as human health and nutritional concernsReference Sales 3 . Additionally, the market price for all-natural and organic broilers averages 200% more than conventional broilers, which gives an indication of the potential profitability of pastured poultry (PP) production systemsReference Oberholtzer, Greene and Lopez 4 , Reference Van Loo, Caputo, Nayga, Meullenet and Ricke 5 .
Although the actual number of PP operations in the USA is uncertain due to the lack of a national database, it is estimated by the US Department of Agriculture (USDA) that these types of production systems are being adopted by small to medium-sized farms (<30,000 broilers annually) 6 . The US 2012 Census of Agriculture indicates 6 that these small farms sell only about 0.07% of the 8.5 billion boiler chickens sold annually in the USA but account for 52% (17,053) of the farms. Of importance, the authors of the present study are assuming that farms selling less than 30,000 broiler chickens per year are using an alternative production system such as free-range or pasture-based. However, there are exceptions to this cut-off based on a report from 2001 on larger PP operations with farmers producing and selling 50,000 broilers per year though this is not the norm 7 . Conversely, there are approximately 15,900 conventional poultry producers across the USA with farmers primarily concentrated within five states in the Southeastern USA 6 . Here the authors of the present study are assuming that farms selling 30,000 to >500,000 broilers per year are using conventional production systems.
The majority of research involving the environmental impact of poultry production has focused on conventional production systems with a primary emphasis on best practices for land application of spent poultry litter for mitigation of phosphorus (P) runoffReference Pierson, Cabrera, Evanylo, Kuykendall, Hoveland, McCann and West 8 , Reference Sharpley, Kleinman, Heathwaite, Gburek, Weld and Folmar 9 . These systems account for more than 99.9% of the broilers sold annually but only 48% (15,882) of poultry operations—indicative of high-density, confined production associated with geographical concentration of manure products (i.e., poultry litter) often containing excess nutrients and pathogens of concern to public health 6 , 10 . Conventional systems are reported to have their biggest environmental impact from the practice of applying used poultry litter to agricultural lands resulting in runoff of excess nutrients, especially P, which can be detrimental to nearby surface water resourcesReference Pierson, Cabrera, Evanylo, Kuykendall, Hoveland, McCann and West 8 , Reference Sharpley, Kleinman, Heathwaite, Gburek, Weld and Folmar 9 . These negative environmental impacts have resulted in deterioration of nearby surface and ground water resources in Arkansas, Georgia and the Delmarva (Delaware, Maryland, Virginia) Peninsula which all have areas of high density, conventional poultry productionReference Pierson, Cabrera, Evanylo, Kuykendall, Hoveland, McCann and West 8 , Reference Sims, Rechcigl and MacKinnon 11 , Reference Slaton, Brye, Daniels, Daniel, Norman and Miller 12 . With respect to poultry processing (the focus of the present study) used by conventional poultry production systems, waste management by ‘fixed facility’ (i.e., not on-farm and not mobile) is described in detail by O'Bryan et al.Reference O'Bryan, Gibson, Crandall, Ricke, Ricke, Johnson, O'Bryan and Van Loo 13 . Briefly, liquid and solid waste streams are separated at each processing step. Solids wastes (i.e., feathers, head, feet, offal, etc.) may be sold or transferred to a landfill or incinerator, whereas liquid wastes (i.e., blood not collected, suspended solids, solubilized fats, proteins, wastewater, etc.) are discharged into either a municipal waste stream for further treatment at a municipal wastewater treatment plant or directly into the environment after on-site treatment at the processing facilityReference O'Bryan, Gibson, Crandall, Ricke, Ricke, Johnson, O'Bryan and Van Loo 13 . Importantly, disposal of liquid wastes from a conventional processing plant into the municipal waste stream or surface waters following on-site treatment require a discharge permit.
In contrast, no studies have been published on the environmental impacts related to production practices and processing options available to small and medium-sized poultry farms—primarily PP systems—in the USA. As defined by the USDA, small farms are places that sell less than US$100,000 in agricultural products annually 2 . The majority of small farms producing poultry products sell less than US$18,000 yr−1 14 . As stated previously, the actual number of PP producers is not well-known due to the lack of a national database.
In general, it is understood that the rotation of poultry on pasture is a key best management practice (BMP) in order to avoid over grazing and buildup of excess nutrients and pathogensReference Sossidou, Dal Bosco, Elson and Fontes 1 , Reference Trimble, Alali, Gibson, Ricke, Crandall, Jaroni and Habteselassie 15 . However, BMPs for handling the processing of associated wastes (i.e., wastewater, feathers, offal) are not so well established. Typically, PP operations implement land application of wastewater from on-farm slaughter operations and for finished compost (partially derived from processing wastes). However, there is evidence that these practices—if not managed properly—can lead to contamination of surface water and ground water because of precipitation runoff and soil leachingReference Burkholder, Libra, Weyer, Heathcote, Kolpin, Thorne and Wichman 16 . Therefore, it is important to evaluate the potential environmental impacts of various processing options utilized by PP growers.
As indicated, these PP producers often process their birds on the farm in a fixed facility. Other options include transporting birds for processing to an independent USDA-inspected facility or utilization of a mobile poultry processing unit (MPPU) which may go from farm to farm processing birds or may be set up in a centralized locationReference O'Bryan, Crandall, Davis, Kostandini, Gibson, Alali, Jaroni, Ricke and Marcy 17 . In contrast to conventional systems, very few studies have been conducted on the potential environmental impacts of PP farms especially in relation to on-farm processing practices and MPPUs. Though not directly related to small-scale poultry processing, a single study conducted by the University of Hawaii Cooperative Extension Service investigated the sustainability of PP production in Hawaii in 1999Reference Fukumoto and Replogle 18 . In that study, the authors modeled the potential nutrient cycling of a 1000 broilers per year system on a single acre of pasture and concluded that PP production would result in enhanced forage production and improved animal performance. Boggia et al.Reference Boggia, Paolotti and Castellini 19 conducted a life cycle assessment of conventional, organic and organic-plus (i.e., organic standards plus some other value-added component such as more humane conditions, sustainable practices, etc.) poultry systems, but did not include slaughter and processing in their study, instead focusing strictly on the impact of production systems; moreover, organic systems are more similar to conventional poultry when compared with the PP operationsReference Hu, Zhang and Wang 20 . Overall, researchers in this area agree that raising birds on pasture offers mostly mutual benefits for the birds and the environment though, again, only the production aspects of these systems have been consideredReference Sossidou, Dal Bosco, Elson and Fontes 1 .
As almost all environmental research has been limited to conventional poultry operations, a study was initiated with PP growers in the Southeastern USA in order to provide important baseline information on the environmental impacts of processing methods used by PP production systems. As this study was part of a larger project involving food safety, economic aspects and consumer preference related to PP, the primary objective here was to assess the impact of MPPU and on-farm processing waste disposal on the environment and to establish a baseline set of data for future research.
Materials and Methods
This study was conducted over an 11-month production period at five small-scale, independent, PP farms in the southern USA. Each farm produced approximately 1000 broilers per year. Participation of the farms was voluntary by the farmers and based on the condition of privacy. Birds were processed at the site of production (on-farm; n = 3 farms) or at a MPPU pilot plant (n = 2 farms). In addition, though not specifically characterized in this study, soils found in the regions where the PP farms were located have been described as primarily well-draining and loamy (i.e., combination of sand and silt) or clayey depending on the exact area 21 .
On-farm processing and sampling
Processing set-up
As described in Trimble et al.Reference Trimble, Alali, Gibson, Ricke, Crandall, Jaroni and Berrang 22 on-farm processing involved manual processing of broilers either in an open-air setup or in an enclosed shed. Unfortunately, there is no information available on the location of the on-farm processing operations with respect to production fields or proximal surface waters. Poultry processing typically involves the following steps as described by FanaticoReference Fanatico 23 : pre-slaughter (catching and transport); immobilizing, killing and bleeding; feather removal (scalding and picking); removal of head, oil glands and feet; evisceration (i.e., removal of internal organs); and chilling. Typical processing equipment was used including kill cones, a single-stage static scalder and a mechanical batch picker, while evisceration was done manually on stainless steel tables. For more detailed information, Fanatico providesReference Fanatico 23 detailed descriptions of each processing step used in typical on-farm processing. On-farm processing wastewater from the scalder, picker and runoff from the evisceration table emptied directly into the soil surrounding the processing area. Processing offal was collected and added to an on-site compost pile that was also used to compost dead chickens from the production operation. A passive composting method was utilized for all compost piles 24 . Compost ingredients included a mixture of manure from farm animals, wood chips or straw, dead birds and other small animals. The approximate age of the piles ranged from 6 months to 2 yr old.
Soil sampling
Soil samples were collected from the areas around the scalder discharge hose (Site 1), the picker (Site 2) and the evisceration table (Site 3). Soil samples were collected on the following dates: Farm 1 (November 8, 2011, November 15, 2011, February 14, 2012 and May 20, 2012), Farm 2 (June 2, 2012 and June 23, 2012), Farm 3 (June 19, 2012 and July 8, 2012). These dates were determined by the production cycles of the farms we partnered with; therefore, the start date of November 2011 was based on the completion of an 8-week growing cycle on Farm 1 whereas the other participating farms were not growing broilers at that time.
Three 24-cm soil cores (2 cm wide) were collected at each of the three disposal areas using a soil auger. Samples were placed in Whirl-Pak bags (Nasco, Fort Atkinson, WI) on ice for transport to the laboratory where they were combined into three composite samples (approximately 100 g each) and stored at −20°C until analysis. All soil samples were analyzed for nutrients [nitrogen (N) and P] and moisture levels. Methods used to analyze soil total nitrogen (TN; measure of N in all organic and inorganic forms) and Mehlich-3 P (M3-P) followed standard protocols described by Miller and SononReference Miller, Sonon, Sikora and Moore 25 and MehlichReference Mehlich 26 , respectively, with modifications for TN. TN and M3-P were reported as % TN (as-received basis) and mg kg−1 (dry basis), respectively. Briefly, after thawing at 4°C, samples were mixed and TN was analyzed using an elementar varioMax CN (Elementar Americas, Laurel, NJ). For M3-P, followed by thawing and mixing, samples were air-dried, ground and sieved (2 mm) and analyzed using a SPECTRO ARCOS ICP-OES spectrometer (SPECTRO Analytical Instruments Inc., Mahwah, NJ). Soil moisture was measured gravimetrically and determined as percentage moisture on a dry weight basis by calculating the difference in sample weight (wet versus dry) after drying at 105°C for 16 hReference Gardner and Black 27 .
Compost sampling
Three 30–40 g samples in each of three areas of the compost pile were collected during each farm visit. The three samples from each were then combined into one composite sample therefore three composite compost samples per sampling date were collected from each farm. Compost samples were collected from each farm on the same dates as collection of soil samples. A large sterile metal scoop was used to collect the samples at a depth of 24–36 cm. Samples were placed in sterile Whirl-Pak bags on ice for transport to the laboratory where they were combined into three composite samples (approximately 100 g each) and stored at −20°C until analysis. Compost samples were essentially treated as manure samples and were analyzed for TN, total P (TP), water extractable P (WEP) and moisture levels. TN, TP and moisture levels were determined using methods described in Peters et al.Reference Peters, Combs, Hoskins, Jarman, Kovar, Watson, Wolf and Wolf 28 while WEP was determined as described by Kleinman et al.Reference Kleinman, Sullivan, Wolf, Brandt, Dou, Elliott, Kovar, Leytem, Maguire, Moore, Saporito, Sharpley, Shober, Sims, Toth, Toor, Zhang and Zhang 29 . Methods used to measure compost TN were analyzed ‘as-received’ (i.e., thawed and mixed, but not dried, ground and sieved). For TP analysis, after thawing at 4°C, samples were mixed, acid digested and analyzed ‘as-received’ by SPECTRO ARCOS ICP-OES spectrometer (SPECTRO Analytical Instruments Inc.). WEP was analyzed at 1:100 sample to water ratio (i.e., 2 g dry weight equivalent to 200 ml water) and analyzed by SPECTRO ARCOS ICP-OES spectrometer. Results for WEP were reported on dry basis (mg kg−1). Compost moisture was measured gravimetrically and percentage moisture was determined on a wet weight basis by calculating the difference in sample weight (wet versus dry) after drying at 105°C for 16 h.
Wastewater sampling
For each farm on each processing day, three composite wastewater samples (1 L each per 10–20 birds processed) were collected into sterile plastic field bottles (Nalgene, Rochester, NY) from the scalder, picker and runoff from the evisceration table and combined into a single sample as described in a companion paper by Trimble et al.Reference Trimble, Alali, Gibson, Ricke, Crandall, Jaroni and Habteselassie 15 on pathogen concentrations. More specifically, a sample was collected upon emptying of the scalder, picker and during runoff from the evisceration table.
After collection, samples were placed on ice for transport to the laboratory. Total Kjeldahl N (TKN) and TP were determined using American Public Health Association (APHA) method 4500-P J using autoclave digestion 30 . Wastewater was collected on three occasions from Farm 1 (November 8, 2011, November 15, 2011 and May 20, 2012); however, samples collected in November were compromised and thus not included in the data presented here. Farms 2 and 3 wastewater samples were collected on the same dates as for soil and compost samples.
MPPU Processing and sampling
Processing set-up
The MPPU pilot plant was located on the University of Arkansas (UA) campus at the UA-Agriculture Experiment Station in Fayetteville, AR. Similar to full-scale, commercial processing, this batch processing system included a killing tunnel, shackles, scalder with an attached immersion unit and Spin-Pik picker (Pickwick Company, Cedar Rapids, IA). Evisceration was again performed manually though birds were hung on shackles over an evisceration trough as opposed to being placed on a stainless steel table. Wastewater from the primary steps of scalding, picking and evisceration was collected and analyzed separately as described in the following section.
Wastewater sampling
At the MPPU, wastewater samples were taken from the scalder, the picker and from evisceration runoff and analyzed individually. Similar to collection of samples for on-farm sampling, TKN and TP were determined using APHA method 4500-P J using autoclave digestion 30 . The MPPU was sampled four times from June to August 2012: Farm 4 (June 6, 2012, July 25, 2012), Farm 5 (July 18, 2012, August 15, 2012). Similar to samples collected from on-farm processing, these dates were determined by the production cycles of the farms we partnered with. In addition, the processing schedule was also dictated by the availability of the MPPU. Samples were collected: (1) directly from the scalder tank (basically a large tank filled with water and heated to a temperature of 63–66°C); (2) from a container placed under the batch picker for collection of wastewater; and (3) from a container placed at the runoff point of the evisceration line where water is used to rinse the carcasses prior to chilling and periodically remove offal from the table.
Statistical analysis
Descriptive statistics (i.e., means and ranges) were calculated and graphed using JMP® Pro 11.0 (SAS Institute Inc., Cary, NC). One-way analysis of variance (ANOVA) was performed to determine significant difference in average nutrient (i.e., TKN and TP) levels in MPPU wastewater by processing step. Sample means were compared for all pairs using Tukey–Kramer honestly significant difference. Statistical significance was set at α ≤ 0.05 and P < 0.05.
Results and Discussion
Soil—on-farm processing
Two primary measurements were taken for all soil samples including TN and M3-P. In addition, soil moisture was also determined. Both N and P are primary macronutrients needed for normal plant growth and reproduction. Overall, soil moisture decreased for some farms and increased for others and ranged from 6 to 45% depending on the farm (Fig. 1). Sampling dates occurred from November 2011 to July 2012 (depending on the farm); therefore it is very likely that changes in soil moisture were influenced by seasonal variation. For instance, the Southeastern state where the on-farm processing facilities were located typically has a humid subtropical climate with moderate to heavy rain (45–75 inches yr−1) with Spring being the rainiest time of year and Fall being the driest. The level of moisture in soil may be of importance in the on-farm processing environment since moisture is an important parameter regulating biological activity in soilReference Schnürer, Clarholm, Boström and Rosswall 31 . In the present study, soil moisture levels were on average highest in the areas near the scalder (24.6%) and picker (25%) followed by the area impacted by evisceration runoff (18.5%) though slight differences in these trends were seen across farms and sampling dates.

Figure 1. Characterization of moisture content, total nitrogen and Mehlich-3 extractable phosphorus in soil samples collected from Farms 1, 2 and 3 by sampling date. Boxplots represent the distribution of data. The vertical line represents the median sample value. The ends of the box represent the 75th and 25th percentiles, or 3rd and 1st quartiles, and the interquartile range (IQR) is the difference between the 1st and 3rd quartiles. The whiskers extend to the outermost data point within the computed ranges as follows: 3rd quartile + 1.5 × IQR and 1st quartile + 1.5 × IQR. Points outside the whiskers are outliers.
With respect to soil nutrient levels, soil TN tended to slightly increase over time for Farm 1 with a slight decrease between the two sampling dates for Farm 3 (Fig. 1). Nitrogen in the nitrate form (NO3 −) is a mobile nutrient in soil and thus also highly soluble in water. In addition, most soils across the USA require the addition of N for the optimum production of cropsReference Espinoza, Norman, Slaton and Daniels 32 . In the present study, only TN was measured. The TN levels reported here are comparable with TN levels reported for various soils in the Southeastern USAReference Sharpley, Smith and Bain 33 – Reference Craft and Chiang 35 ; thus, there is nothing exceptional about the TN levels measured in soils impacted by poultry processing wastewaters analyzed in the present study.
M3-P analysis was applied to all soil samples and involves the use of an extracting solution to determine the amount of extractable P. M3-P correlates well (i.e., R2 of 0.83–0.99) with plant uptake of P from soilsReference Watson and Mullen 36 ; therefore, M3-P is a good measurement of plant-available P. Here, it is also important to note that by selecting to analyze a composite sample from 24-cm core samples the reported M3-P levels may be biased lower since P is likely to be retained near the surfaceReference Sharpley, McDowell, Weld and Kleinman 37 . In the present study, soil M3-P tended to remain the same within a farm, but differed greatly between farms. For instance, soil M3-P at Farms 2 and 3 was approximately 45 mg kg−1—dry basis at both sampling site locations and for each sampling date. Conversely, soil samples collected from Farm 1 were consistently higher than Farms 2 and 3 with a range from 84 to 428 mg kg−1 (Fig. 1). There were also notable fluctuations for M3-P levels between sampling sites and sampling dates (data not shown for specific sampling sites). For example, Site 1 on Farm 1 had M3-P levels that changed more than 3.5-fold between sampling dates (i.e., from 117 to 428 mg kg−1—dry basis during a 2-month period). The authors of the present study do not have an explanation for this 3.5-fold increase in M3-P at a single sampling site though we acknowledge that this level of M3-P is very high given the short time frame between sampling. In addition, some of the differences between farms could be related to how frequently and how long (i.e., number of years) the producers have been processing on-farm; unfortunately, this information was not collected at the time of the study.
As noted in the Trimble et al.Reference Trimble, Alali, Gibson, Ricke, Crandall, Jaroni and Berrang 22 (a companion paper on pathogens in environment and part of the same study presented here), most of these PP farmers did not vary the location of processing and wastewater disposal for different processing days because there was no concern about the potential negative impact on the soil. Based on these data, on average, it does not seem that nutrient levels measured in the soils at the participating farms were adversely impacted by on-farm processing at this time; however, some soil M3-P levels were quite high, indicating that this could be some source for concern.
Compost—on-farm processing
Mean values for compost moisture, TN, TP and WEP by farm and sampling date are shown in Fig. 2. None of the farms had enclosed or structured compost bins, but rather were simply piles near wooded areas or other debris pilesReference Burkholder, Libra, Weyer, Heathcote, Kolpin, Thorne and Wichman 16 . The moisture levels in compost are important for the process to work properly. Pace et al. indicatedReference Pace, Miller and Farrell-Poe 38 that compost moisture levels should be maintained at 40–65% moisture content with a preferred range from 50 to 60% depending on the specific compost materials, pile size and weather conditions. In the present study, average compost moisture content of composite samples was maintained within the recommended range for the most part with the exception of Farm 3 (67 and 69%) and the June 2, 2012 sampling data at Farm 2 (71%) (Fig. 2). However, the moisture content of all compost sampling sites decreased across subsequent sampling dates, with the exception of Farm 3, where moisture remained constant (i.e., mean values of 67–69% across two sampling dates). However, in the present study, the compost samples were collected from a fairly shallow depth (24–36 cm), and these depths may not be representative of the true moisture of the compost pile.

Figure 2. Characterization of moisture content, total nitrogen, total phosphorus and water extractable phosphorus in compost samples collected from Farms 1, 2 and 3 by sampling date. Boxplots represent the distribution of data. The vertical line represents the median sample value. The ends of the box represent the 75th and 25th percentiles, or 3rd and 1st quartiles, and the interquartile range (IQR) is the difference between the 1st and 3rd quartiles. The whiskers extend to the outermost data point within the computed ranges as follows: 3rd quartile + 1.5 × IQR and 1st quartile + 1.5 × IQR. Points outside the whiskers are outliers.
Similar to soilReference Espinoza, Norman, Slaton and Daniels 32 N and P—as well as carbon and potassium—are the primary nutrients required by the microorganisms involved in compostingReference Pace, Miller and Farrell-Poe 38 . The expected level of N and P in compost is approximately 2% of eachReference Pace, Miller and Farrell-Poe 38 though this is primarily driven by the composting materials usedReference Goyal, DHull and Kapoor 39 . The compost collected from the participating farms revealed levels well below what is recommended or expected in typical compost piles (Fig. 2). As reported by Murphy and HandwerkerReference Murphy and Handwerker 40 compost from commercial poultry operations—containing dead birds, straw and poultry litter—was found to be well suited for use as a fertilizer with approximately 2.9 and 1.4% of TN and TP, respectively. This may indicate an opportunity for the PP producers to add materials that are richer in N (e.g., fresh grass clippings, feathers, fruit) and P (e.g., bone meal, poultry manure) in order to make their composts more valuable for land application or to apply their compost at a higher rate to meet crop needs when compared with compost from commercial operations.
WEP was also determined for all compost samples (Fig. 2) in order to understand the potential for P runoff from land-applied compostReference Peters, Combs, Hoskins, Jarman, Kovar, Watson, Wolf and Wolf 28 . Levels of WEP in compost were generally below 1500 mg kg−1—dry basis with the exception of one compost sample collected from Farm 1 with a measured WEP of >5000 mg kg−1 (Fig. 2). Although compost is not exactly the equivalent of manure—composted or not—WEP levels in compost collected from the farms in the present study are similar to WEP measured in municipal biosolids (~100–2000 mg kg−1) as reported by Kleinman et al.Reference Kleinman, Sullivan, Wolf, Brandt, Dou, Elliott, Kovar, Leytem, Maguire, Moore, Saporito, Sharpley, Shober, Sims, Toth, Toor, Zhang and Zhang 29 while generally lower than WEP of chicken litter (~200–3000 mg kg−1) and chicken manure (~5500 mg kg−1). As indicated by Carpenter et al.Reference Carpenter, Caraco, Correll, Howarth, Sharpley and Smith 41 manure-amended soils—especially during recent applications—are an important source of P in eutrophic water bodies impacted by runoff with elevated levels of P. Additionally, several studies have confirmed that WEP is strongly correlated with, and therefore an effective indicator of, total dissolved P loss in runoff from land-applied manures and biosolidsReference Kleinman, Sullivan, Wolf, Brandt, Dou, Elliott, Kovar, Leytem, Maguire, Moore, Saporito, Sharpley, Shober, Sims, Toth, Toor, Zhang and Zhang 29 , Reference Brandt and Elliott 42 – Reference Maguire, Sims and Applegate 45 .
Wastewater—on-farm and MPPU processing
On-farm samples from the scalder, picker and evisceration table were combined into one composite sample and analyzed. Results from the farm wastewater are shown in Table 1. Both TKN and TP levels for wastewater from the on-farm samples were variable between farms but were consistent for the same farm on different processing days. Kiepper foundReference Kiepper 46 that composite poultry processing wastewater (untreated) from commercial processing plants in the Southeastern USA contained on average 120–250 mg L−1 of TKN and 34 mg L−1 of TP. Values of TP reported in the present study for on-farm processing were below this reported level for commercial processing though quite variable ranging from 2.95 to 27.47 mg L−1 (Table 1).
Table 1. On-farm processing wastewater composites.

TP, total phosphorus; TKN, total Kejldahl nitrogen.
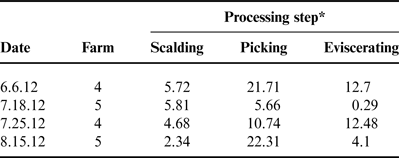
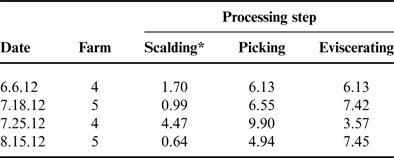
The MPPU samples for scalder, picker and eviscerator were analyzed separately and these results are listed in Tables 2 and 3. The decision to analyze the samples separately during each processing enabled the researchers to understand which processing step may be contributing the highest levels of N and P to the overall nutrient load. Values from the MPPU varied between processing days for both TKN and TP. Similar to wastewater from on-farm processing, TP levels reported here for MPPU were below the commercial processing levels reported by KiepperReference Kiepper 46 ranging from 13.03 to 17.94 mg L−1 (Table 3). With respect to the wastewater discharged from poultry processing facilities the US Poultry and Egg Association (USPEA) states that typical poultry plants release 5 mg L−1 of TKN in treated, filtered effluent 47 as required by the US environmental regulatory compliance limits 48 . However, USPEA does not specifically address TP in these guidelines.
Table 2. Total Kejldahl nitrogen (mg L−1) in wastewater by processing step for the mobile poultry processing unit.

*No significant differences were detected in total Kjeldahl nitrogen when processing steps were compared.
Table 3. Total phosphorus (mg L−1) in wastewater by processing step for the mobile poultry processing unit.

*Total phosphorus was significantly lower in the scalding step as compared with both picking and eviscerating (P < 0.05).
A study by Plumber and KiepperReference Plumber and Kiepper 49 specifically measured TKN in commercial processing scalder wastewater and reported mean values of 49–70 mg L−1 depending on the carcass bleed out times (i.e., 120 or 60 s, respectively). Compared with the scalder TKN levels reported in Table 2, the levels reported by Plumber and KiepperReference Plumber and Kiepper 49 are over tenfold greater. This may be partially due to the broiler bleed out times during processing at the MPPU which were generally greater than 120 s. Moreover, the data presented by Plumber and KiepperReference Plumber and Kiepper 49 were based on 4.09 kg (9 lbs)—live weight birds compared with the relatively smaller live weight of pasture-raised birds used in the present study—1.4–1.6 kg (3–3.5 lbs)—live weight. The impact of the feathering process on poultry processing wastewater has also been evaluatedReference Williams, Barker and Sims 50 ; however, results for TKN were reported as grams per kilogram live weight as opposed to milligrams per liter therefore direct comparison with the TKN levels measured for the picking step in the MPPU experiments is not available (Table 2). Even though in the present study there was no significant difference in the average TKN values by processing step for the MPPU, the processing water collected from the picking step resulted in two of the highest TKN levels—21.71 and 22.31 mg L−1. As explained by Kiepper et al.Reference Kiepper, Merka and Fletcher 51 feathers have a high water capacity holding 75–80% water after the scalding process and these wet feathers can substantially increase the concentration of organic nutrients in wastewater due to the feces, dirt and external debris that can be captured in the feathers. These characteristics could certainly explain the higher measurements of TKN in wastewater collected from the picking process.
CONCLUSIONS
The by-products of raising and on-farm slaughtering of poultry are potential pollutants and concerns include adverse impacts on soil quality and possible runoff into proximal surface waters resulting from excessive loading of nutrients such as N and PReference Kiepper, Plumber and Ritz 52 . The authors have found no published studies on the environmental impacts of PP operations 6 . When levels of nutrients found in PP production systems are compared with those of conventional systems, it is clear that a single conventional system would have much greater nutrient inputs than a 1000 broilers per year PP operation. However, the primary goal of this study was to establish baseline levels of N and P related to on-farm processing and MPPUs. Clearly, there will be differences between producers—as shown here—as well as differences depending on the production scale (i.e., 1000 versus 30,000 broilers per year). Moreover, the authors aimed to better understand the cumulative impact of various processing venues that are available to these smaller production systems. Overall, the present study provided baseline data on soil and compost nutrients related to on-farm processing as well as the wastewater composition of on-farm processing and MPPUs.
Acknowledgements
This research was funded by a grant from the USDA-Southern Sustainable Agriculture Research and Education (SSARE) Program (Project # LS11–245) to authors Jaroni, Ricke and Crandall. The authors thank all the participating farms in this study. The authors also thank Dr. Andrew Sharpley for his advice and guidance on the analysis of soil and compost samples.