


Introduction
In organic systems, farmers must integrate ecological approaches into crop management. Crop improvement through selection has emerged as an agroecological practice that allows for greater success in low-input environments, providing a buffer against environmental stresses. The development of crop varieties specifically for organic environments allows for more effective integration of this agroecological strategy by organic farmers. Developing varieties for organic systems through plant breeding in conventional systems is a form of indirect selection, in which the selection environment as assumed to be a sufficient representation of the target environment. However, research in multiple crop species has found that organic agriculture is distinct from conventional agriculture as a selection environment for plant breeding, and that direct selection in organically managed environments will result in higher yielding varieties in those systems than would indirect selection in conventional environments (Murphy et al., Reference Murphy, Campbell, Lyon and Jones2007; Singh et al., Reference Singh, Terán, Lema and Hayes2011; Kirk et al., Reference Kirk, Fox and Entz2012; Lammerts van Bueren and Myers, Reference Lammerts van Bueren, Myers, van Bueren and Myers2012; Entz et al., Reference Entz, Kirk, Vaisman, Fox, Fetch, Hobson, Jensen and Rabinowicz2015). These findings suggest that plant breeding for organic production should include organic trial sites either exclusively or in combination with sites under conventional management (Burger et al., Reference Burger, Schloen, Schmidt and Geiger2008; Renaud et al., Reference Renaud, Lammerts van Bueren, Paulo, van Eeuwijk, Juvik, Hutton and Myers2014).
Breeding for organic agriculture, though still a small proportion of plant breeding efforts, is now being conducted in the private, public and nonprofit sectors (Mazourek et al., Reference Mazourek, Moriarty, Glos, Fink, Kreitinger, Henderson, Palmer, Chickering, Rumore, Kean, Myers, Murphy, Kramer and Jahn2009; Myers et al., Reference Myers, McKenzie, Mazourek, Tracy, Shelton and Navazio2012a, Reference Myers, McKenzie, Voorrips, van Bueren and Myers2012b; Shelton and Tracy, Reference Shelton and Tracy2015). Efforts to breed for organic agriculture have highlighted the importance of on-farm evaluation and selection of crop varieties, a strategy that has been successfully employed in participatory plant breeding (PPB) to produce varieties that are well-adapted to local environmental stresses and farming communities’ needs. In contrast to centralized approaches in which breeding is carried out solely by trained plant breeders on a research station or breeding facility, the decentralized approach of on-farm selection in PPB incorporates farmers’ knowledge, practices, and environmental contexts in the selection process (Frossard, Reference Frossard, Cleveland and Soleri2002; Soleri and Cleveland, Reference Soleri and Cleveland2002). Although PPB methods were developed in the context of subsistence agriculture and marginal environments (Ceccarelli et al., Reference Ceccarelli, Grando and Hamblin1992; Ceccarelli, Reference Ceccarelli1994), plant breeding for organic agriculture can also benefit from on-farm variety testing and selection (Baenziger et al., Reference Baenziger, Salah, Little, Santra, Regassa and Wang2011) and farmer-research collaboration (Chable et al., Reference Chable, Conseil, Serpolay and Lagadec2008). Organic farms tend to experience higher farm-to-farm variation due to the lack of synthetic inputs and emphasis on biological management, compared with more environmental uniformity across conventional farms (Dawson et al., Reference Dawson, Rivière, Berthellot, Mercier, Kochko, Galic, Pin, Serpolay, Thomas, Giuliano and Goldringer2011). Additionally, the smaller scale and diversified nature of many organic vegetable farms fosters the development of individualized cropping practices to adapted to local environments and markets (Drinkwater et al., Reference Drinkwater, Letourneau, Workneh, van Bruggen and Shennan1995; Przystalski et al., Reference Przystalski, Osman, Thiemt, Rolland, Ericson, Østergård, Levy, Wolfe, Büchse, Piepho and Krajewski2008; Wolfe et al., Reference Wolfe, Baresel, Desclaux, Goldringer, Hoad, Kovacs, Löschenberger, Miedaner, Østergård and Lammerts van Bueren2008; Renaud et al., Reference Renaud, Lammerts van Bueren, Paulo, van Eeuwijk, Juvik, Hutton and Myers2014). On-farm evaluation allows for more accurate representation of the broad range of environmental and cropping systems characteristic of organic farms. In addition, some results have shown that variety performance is less correlated between farms and research stations in organic agriculture than in conventional agriculture (Singh et al., Reference Singh, Terán, Lema and Hayes2011). Whether a further reflection of the higher degree of organic farm-to-farm variation mentioned above, or a disconnect between station-managers’ practices and the practices of experienced organic farmers, this discrepancy highlights the value of evaluation conducted on working organic farms. Finally, on-farm evaluation facilitates farmer involvement and leadership in determining the most valuable crop traits to measure and characterizing variety performance, a critical aspect to ensure that breeding and evaluation methods align with farmer's diverse organic seed and variety development priorities (Lyon et al., Reference Lyon, Silva, Zystro and Bell2015). For all of these reasons, organic agriculture stands to benefit from on-farm crop evaluation, whether at the beginning of a crop breeding project or after variety development to test finished varieties and determine the best varieties for specific regions or market sectors.
Researchers have elaborated different strategies for on-farm variety testing, many of which have focused on grain or pulse crops (Snapp, Reference Snapp, Bellon and Reeves2002; Bellon et al., Reference Bellon, Berthaud, Smale, Aguirre, Taba, Aragón, Díaz and Castro2003; Ceccarelli et al., Reference Ceccarelli, Grando, Singh, Michael, Shikho, Al Issa, Al Saleh, Kaleonjy, Al Ghanem and Al Hasan2003; Murphy et al., Reference Murphy, Lammer, Lyon, Carter and Jones2005; Dawson et al., Reference Dawson, Rivière, Berthellot, Mercier, Kochko, Galic, Pin, Serpolay, Thomas, Giuliano and Goldringer2011). On-farm evaluation of grains and pulses can be considered more straightforward compared to vegetable crops, as the harvested crop is more easily transported or stored, allowing wider windows to accomplish evaluation activities. This flexibility can be critical to allow farmers to engage in these activities amidst their busy farming schedules. Vegetable crops often have narrower temporal windows in which evaluation must take place, and the timing of these with farmers’ seasonal workloads, particularly on diversified farms, can hinder farmers’ ability to participate. Further, quantitative yield measures such as weight are more straightforward in grain and pulse crops which yield a single harvest, unlike many vegetable crops with indeterminate growth patterns and multiple harvests. Approaches to on-farm variety testing must consider the feasibility of their implementation for farmers and these unique characteristics of vegetable crops.
The response of varieties to environmental variation can be characterized in terms of stability and adaptation, both of which are commonly evaluated in variety trials (Abidin et al., Reference Abidin, van Eeuwijk, Stam, Struik, Malosetti, Mwanga, Odongo, Hermann and Carey2005). Stability can be assessed by linear regression of variety performance on an environmental index (EI). The EI of a given environment is defined as the mean performance of all varieties at that environment. The resulting regression coefficient, b i, provides a numerical description of stability. Finlay and Wilkinson (Reference Finlay and Wilkinson1963) define a stable variety as one with b i approaching zero—in other words, with similar variety performance across low- and high-yielding environments. Alternatively, Eberhart and Russell (Reference Eberhart and Russell1966) define a stable variety as one with b i = 1.0. A stable variety in this definition has a relative performance that tracks with the trial mean across lower-yielding and higher yielding environments, and that performance can be either consistently above or below the trial mean in all sites.
Building on these two separate definitions, Becker and Leon (Reference Becker and Leon1988) describe two concepts of stability: static/biological stability, characterized by similar performance across all environments (the Finlay–Wilkinson definition); and dynamic/agronomic stability, characterized by increasing yields in more optimal environments (the Eberhart–Russell definition). Selecting for dynamic stability by regressing yield on EI, in combination with testing in a wide array of marginal environments, contributed to the gains in yield potential demonstrated in maize breeding in the 1960s–1990s (Bradley et al., Reference Bradley, Knittle and Troyer1988; Tollenaar and Lee, Reference Tollenaar and Lee2002). Subsequent authors have proposed stability parameters to incorporate multiple concepts of stability across genotypes (G), as well as indicators of average yield and genotype by environment (GE) interactions (Shukla, Reference Shukla1972; Francis and Kannenberg, Reference Francis and Kannenberg1978; Lin et al., Reference Lin, Binns and Lefkovitch1986; Yan and Kang, Reference Yan and Kang2003). A comparison of the Finlay–Wilkinson regression coefficient, Shukla's stability variance, Francis and Kannenberg's covariance and Yan and Kang's Genotype (G) and Genotype × Environment (GE) Interaction, or GGE biplot found the results generally to be in agreement (Murphy et al., Reference Murphy, Lee, Woodrow, Seguin, Kumar, Rajcan and Ablett2009). Additive main effects and multiplicative interaction (AMMI) has also been widely used to analyze variety trials. AMMI and GGE biplot are both based on singular value decomposition, but while AMMI treats the effects of G and GE separately, GGE biplot combines them (Yan, Reference Yan2014, p. 102). The relative merits of AMMI vs GGE biplot for analyzing crop trials have been debated: Gauch (Reference Gauch2006) maintains that AMMI is more reliable across datasets and that G and GE should be considered separately because of their different implications for agricultural objectives while Yan et al. (Reference Yan, Kang, Ma, Woods and Cornelius2007) argue that G and GE must be considered together because specific adaptation is based on both.
While these methods of stability analysis offer strong potential, their use in PPB and on-farm evaluations can be challenging due to unbalanced data, high inherent variability and challenges to implementing trial designs (Raman et al., Reference Raman, Ladha, Kumar, Sharma and Piepho2011). In particular, analysis of variance (ANOVA), AMMI and GGE biplot require multiple replicates in each environment in order to provide enough degrees of freedom to analyze the GE interaction terms. By contrast, on-farm variety trials such as those in the Northern Organic Vegetable Improvement Collaborative (NOVIC) project frequently consist of single replicates on each farm, because multiple replicates can be prohibitively time consuming and expensive to plant and evaluate in farmer-managed trials. For these situations, Hildebrand and Russell (Reference Hildebrand and Russell1996) proposed adaptability analysis that employs the Finlay–Wilkinson regression but shifts the interpretation of the resulting figures to identify specific adaptation to high- or low-yielding environments rather than selecting for general adaptation as it was used by Finlay and Wilkinson. Decisions about which kind of adaptation is preferable, then rest on farmers’ tolerance of risk and an evaluation of the farm environment (Fig. 1). Hildebrand and Russell contend that the widespread use of stability parameters to identify varieties with broad adaptation (agronomic stability), to the exclusion of varieties better-adapted to poor environments, is motivated by an assumption that farmers will use conventional agronomic practices that suppress variability. For many of the world's resource-limited farmers, though, ‘risk avoidance and average yields in poor environments (and seasons) are far more important than above-average yields in all environments’ (Hildebrand and Russell, Reference Hildebrand and Russell1996, p. 23). This framing shows the potential of adaptability analysis for the types of agroecosystems that also benefit from PPB: those that tend to experience high farm-to-farm and season-to-season variability, from organic farming to marginal environments (Ceccarelli et al., Reference Ceccarelli, Erskine, Hamblin and Grando1994; Haussmann et al., Reference Haussmann, Fred Rattunde, Weltzien-Rattunde, Traoré, vom Brocke and Parzies2012). Snapp (Reference Snapp, Bellon and Reeves2002) recommends Hildebrand and Russell's approach to stability analysis as a method to evaluate variety performance across many on-farm environments in mother–baby trials, which pair larger ‘mother’ trials at research stations with smaller ‘baby’ trials. The mother–baby trial design has been influential in participatory variety trialing and selection, particularly in grain crops, and has been implemented in variety trials for organic agriculture including in our research. Yet while Snapp used adaptability analysis to assess adaptation to environment in mother–baby trials of grain crops, this method had not been applied to vegetable crops, which present unique challenges for the reasons discussed earlier.

Fig. 1. Idealized example of three varieties plotted against EI. Variety B, with slope = 1, is broadly adapted. A is specifically adapted to high-yielding environments, while C is specifically adapted to low-yielding environments. Adapted from Hildebrand and Russell (Reference Hildebrand and Russell1996, p. 6).
In order to contribute to the further development of on-farm trialing and the use of stability analysis for vegetable crops, we assessed adaptability analysis as a method of evaluating variety trials through the experience of the NOVIC. NOVIC is a multi-institution participatory variety trialing project, involving researchers and organic farmers in Washington, Oregon, Wisconsin and New York. Beginning in 2010, variety trials were conducted under certified organic conditions at research stations and on working organic farms, in coordination with organic breeding programs of partnering land grant universities and a non-profit organization. The NOVIC trials used an adapted version of the mother–baby trial discussed earlier (Snapp, Reference Snapp, Bellon and Reeves2002). This design included the incorporation of on-farm evaluations consisting of a single replicate on each farm and replicated research station trials, allowing for a robust experimental design while minimizing time requirements for farmers. In order to address the question of the appropriateness of adaptability analysis as a tool to inform both plant breeders and farmers as to the utility of a specific variety to be included in organic management, we used selected data from the NOVIC trials in order to achieve the following objectives:
(1) Assess differential responses of varieties included the NOVIC trials grown in high- and low-yielding environments.
(2) Assess the feasibility of simple graphic methods to analyze adaptation and performance in a participatory vegetable variety trialing project.
(3) Inform recommendations on participatory trialing methods that would be valuable to both farmers and plant breeders.
Thus, this paper describes a novel way in which both farmers and plant breeders can assess the organic management suitability of both new and existing vegetable germplasm, for which more widely applied methods used for grain and cereal crops may not be most appropriate or useful.
Methods
Experimental design and data collection
From 2010 to 2013, the NOVIC variety trials were conducted across four production seasons on research stations in Ithaca, NY; Madison, WI; Corvallis, OR and Sequim, WA; as well as at five farm sites in New York, 10 in Wisconsin (including one in Minnesota), seven in Oregon and 14 in Washington. Research station trials consisted of three replicates of all varieties in randomized complete block design, while on-farm trials consisted of a single replicate of each variety. Although farmers received a small stipend for participation, they were essentially volunteering their time and land to participate in the variety trials while also managing the rest of the production activities on their farms. Planting and maintaining multiple replicates of the trial would have been prohibitively time consuming for most of the famers involved; single replicate on-farm trials allowed farmers to participate and provide feedback and data on trial varieties. Of the 36 total participating farms, some grew trials every year of the project, while others participated for only some growing seasons. The five core crops, which were grown on all research stations, included broccoli (Brassica oleracea), sugar snap and snow peas (Pisum sativum), carrots (Daucus carota subsp. sativus), sweet corn (Zea mays) and butternut squash (Cucurbita moschata). Farmers chose which of these they would trial each season on their farms, depending on their interests and capacity.
Research station trials were managed by staff from each participating institution. On-farm trials were co-managed by farmers and research staff, with farmers responsible for planting and growing the crop as well as conducting mid-season and harvest evaluations as their time permitted. Researchers distributed trial seed and seedlings to farmers and assisted with some mid-season evaluations, the majority of harvest evaluations, and all storage evaluations. Data were collected in each state by researchers at the research stations and researcher–farmer teams at the farm sites, with some variation by state. For qualitative scores, evaluators were given an explanation of the trait and then asked to view or taste every plot and establish the extremes of the scale (1 and 5). In general, the same individual researchers were present for all evaluations within each of the four states, but different farmers were part of the evaluation team on each farm site. Data from the four participating regions were compiled each year by Organic Seed Alliance (a Washington State-based nonprofit organization) staff to create a multi-site, multi-year dataset.
Statistical analysis
Crops were selected for inclusion in the analysis upon review of the NOVIC dataset to identify the crops and variables with the most complete data. Causes of missing data included failure of all varieties of a crop, destruction of individual varieties by animals, farmers harvesting the crop before data was collected, farmer reluctance to commit space for trialing the same varieties over multiple seasons or other similar issues common to participatory variety trials. With each of the crops satisfying these criteria (squash, broccoli and carrots), we selected two variables to include in the analysis based on completeness of the data and relevance of the trait for crop improvement. We selected two continuous variables for squash: marketable number of fruit per plant and marketable fruit weight per plant. For broccoli, we used one continuous variable (head diameter), and one ratio (uniformity of maturation). For carrots, we used two variables measured as 1–5 scores: root smoothness and sweetness (Table 1).
Table 1. Variables evaluated through adaptability analysis of squash, broccoli and carrot varieties in participatory organic trials in NY, WI, OR and WA, 2010–2013

An environment is one site in 1 year; the number of varieties and environments evaluated varies due to data availability from participating farms.
For each trait of interest, we used R software (R Core Team, 2014) to identify varieties within each crop that provided data in the majority of environments tested (Table 2). Because farm sites and varieties changed from year to year, we were not able to consider the influence of years and locations separately. Rather, we treated each year-by-location combination as a distinct environment. In order to analyze research station sites (which had three replications of each variety) and on-farm sties (which had only one replication) in the same analysis, we used the average of the three replications from the research station sites. Given that a trade-off existed between including more varieties and evaluating them in more environments, we chose the combination that balanced both factors. To ensure this approach was valid, we performed the analysis with fewer or greater environments to assess impact on results on the variables we had previously selected. Using this approach, analysis of squash variables included seven varieties in 11 environments and analysis of broccoli variables included seven varieties in 23 environments and analysis of carrot variables was conducted with six varieties in 22 environments. Notable changes in results with different inclusion of sites were only observed with the two carrot variables that we had previously identified. For these variables analysis was conducted with six varieties in 22 environments as an illustration of the limitations of this type of analysis for qualitative variables, as we will discuss.
Table 2. Squash, broccoli and carrot varieties included in adaptability analysis of participatory organic trials in NY, WI, OR and WA, 2010–2013

The two broccoli entries described as ‘OP Breeding Stock’ were discrete populations in the late stages of a participatory breeding project led by Oregon State University. Dates of release are based on American Society for Horticultural Science vegetable variety lists or PVP documents but those that are preceded by ~ are based on when they first appear in seed catalogs on the internet. Introduction into the USA may happen later than when first introduced into Europe.
ANOVA was conducted on environment (location × year) means using the PROC GLM procedure in SAS® 9.1.3 (SAS Institute, Inc., 2000)Footnote 1. All effects were treated as fixed. Because only one replication of each variety was available for the on-farm trials, insufficient degrees of freedom prevented the inclusion of G × E interactions when conducting ANOVA for the research station and on-farm sites combined. For each response variable, we used the complete dataset (research station and on-farm sites) to calculate environment means (performance of all varieties within an environment), grand variety means and least significant differences (LSD), treating each environment as a replication and using the different environments for each variety to calculate within-group error. Tukey's range test was used to control for the effect of multiple comparisons. We then created a linear regression of variety performance on EI, which was calculated as the mean value of the trait of interest for all varieties under consideration in that environment. The x-axis in the resulting scatterplots thus represents a continuum from poor-quality to high-quality environments as determined by observed mean variety performance in that environment. We also calculated the regression coefficient (β) and coefficient of determination (R 2) for each variety, and tested whether regression coefficients were significantly different from a slope of one.
In order to fully utilize the replicated data collected at the research station sites, we conducted a separate an AMMI analysis of these data using the agricolae package for R (de Mendiburu, Reference de Mendiburu2017). We produced ANOVA models including effects of G, E, GE and within environment replicates, and biplots of the first two principal components of the GE interactions as an indication of stability.
Results
Analysis of variance
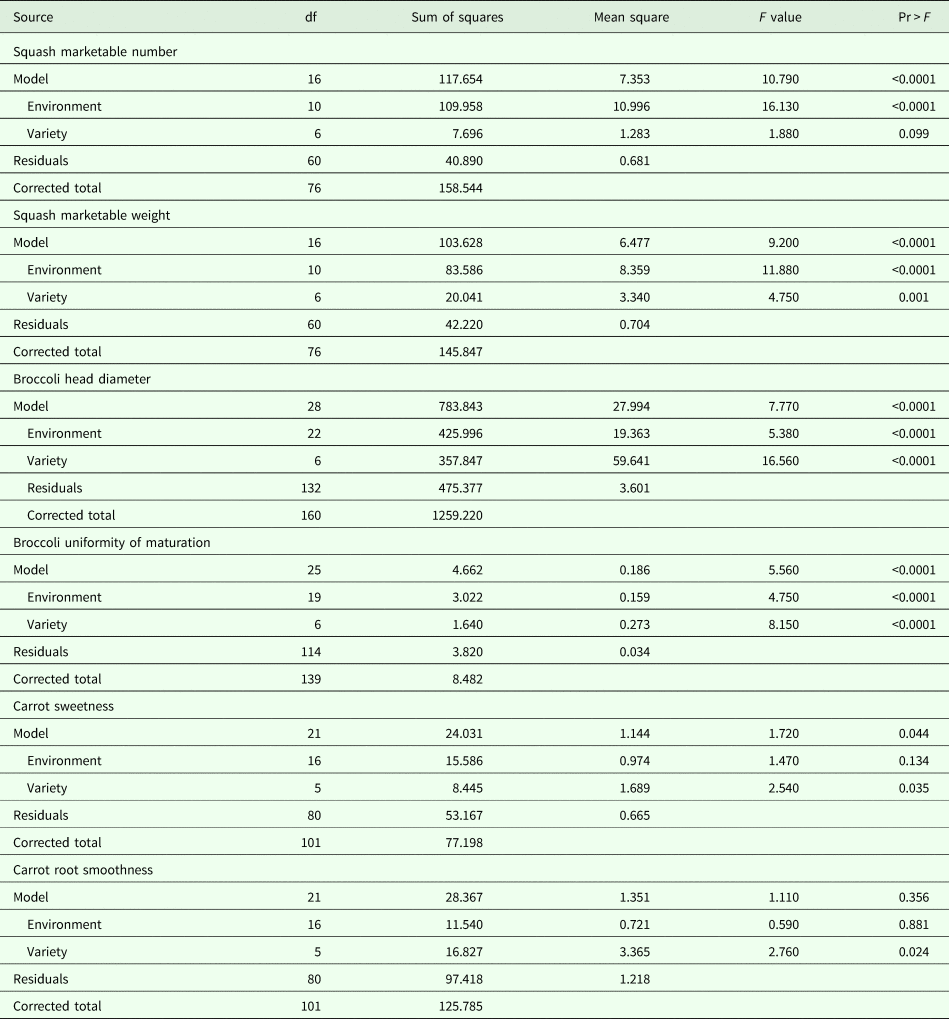
The ANOVA model that includes both research station and on-farm sites was significant for both squash yield variables (marketable fruit per plant and marketable weight per plant). For squash marketable fruit per plant, environment was highly significant (P < 0.0001) but variety was not (P = 0.099). For squash marketable weight per plant, both effects were significant, with P ⩽ 0.0001. In other words, while environmental variation seems to have had equal effect on both fruit number and fruit size, genetic variation was important for fruit size but hardly at all for fruit number. In broccoli, the ANOVA model as well as environment and variety effects were significant (P < 0.0001) for both response variables. Variety was a significant source of variation for carrot sweetness (P = 0.035) but environment was not (P = 0.134). The model was not significant for carrot root smoothness (P = 0.356) (Table 3).
Table 3. ANOVA of six variables in organic trials of squash, broccoli and carrot varieties in NY, WI, OR and WA, 2010–2013
Variety means
Though the ANOVA results provided strong evidence of a variety effect on some traits (e.g., marketable weight per plant P = 0.001), and marginal evidence for others (e.g., marketable fruit per plant P = 0.099), when making pairwise comparisons of variety performance using Tukey's LSD with a family-wise α = 0.05, no pairwise differences were significant. Though these differences did not reach statistical significance, ‘Metro,’ and ‘Tiana’ performed better than other varieties in terms of average number of marketable fruit per plant while ‘Waltham’ was a top performer for fruit weight but not fruit number (Table 4). ‘Tiana’ performed better than other varieties for both response variables. In broccoli, ‘Belstar,’ ‘Gypsy’ and ‘Arcadia’ had significantly larger average head diameter than the three open-pollinated entries, ‘OSU Composite,’ ‘Solstice’ and ‘Common Ground Population.’ ‘Gypsy’ displayed more uniformity in maturation (percent prime on harvest day) than ‘Common Ground Population’ and ‘Solstice.’ Differences between carrot varieties also did not reach statistical significance, ‘Yaya’ and ‘Bolero’ were tied for the top rating for sweetness and ‘Yaya’ rated highest for root smoothness. The carrot traits were evaluated using one to five scores, resulting in data that were strongly clustered between two and four, possibly accounting for the lack of significant differences between varieties and environments for these traits.
Table 4. Variety means by crop and trait for squash, broccoli and carrot in NY, WI, OR and WA, 2010–2013

Fisher's least significant distance is displayed for each trait, and letters represent significance groupings calculated using Tukey's range test was used to control for the effect of multiple comparisons.
Environment means
In order to create the EI, which comprises the y-axis for regression in adaptability analysis, environments are arranged in order of their respective mean variety performance (Fig. 2). Error bars in this figure represent standard error, though it should be noted again that quantitative variables (squash fruit number and weight, broccoli head size) were measured as a sum per plot rather than subsampling within plot, and qualitative variables (broccoli uniformity, carrot sweetness and flavor) were evaluated as a single rank per plot. Standard error here thus represents error between plots only, rather than within plots. This figure demonstrates that the rank of environments differed by crop and response variable. For example, OR1-11 was a high-quality environment for squash in terms of marketable fruit number, but not for marketable fruit weight, while WI1-11 was a high-quality site for fruit weight but not fruit number. Except for two low-performing New York sites (NY4-12 and NY3-12), broccoli uniformity was strongly grouped between 0.25 and 0.75, characteristic of variables measured as a proportion. For both carrot variables there was a high amount of variation (standard error) within environments and little separation between environments, particularly for root smoothness.

Fig. 2. Variety performance means by location 6 response variables in broccoli, carrot and squash. Environments represent year-by-location combinations. The last two digits of each site code represent the trial year; WI1, NY1, OR1 and WA1 are all research station sites (average of three replications) and other codes are on-farm sites (one replication). Broccoli head size, squash marketable weight and squash marketable fruit represent plot averages. Bars represent standard error.
Adaptability analysis
For squash marketable fruit per plant, linear regression against EI suggested that ‘Metro’ was specifically adapted to high-yielding environments, with a regression coefficient greater than and significantly different from one (β = 1.4, P = 0.034) and relatively little deviation from the regression (R 2 = 0.9) (Fig. 3). ‘Tiana,’ which had similar overall average fruit numbers, was more broadly adapted with somewhat more variable performance (β = 0.99, P = 0.96, R 2 = 0.61). Comparing the two varieties with average overall performance, ‘JWS 6823’ was very broadly adapted (β = 1.0, P = 0.87, R 2 = 0.70) while ‘Waltham’ displayed more specific adaptation toward low-yielding environments (β = 0.66, P = 0.071, R 2 = 0.64). ‘Bugle’ (β = 1.2, P = 0.27, R 2 = 0.82) and ‘Pilgrim’ (β = 0.98, P = 0.92, R 2 = 0.77) appeared to be more responsive to improvements in environment than ‘Early’ (β = 0.7, P = 0.0015, R 2 = 0.92). A caveat is that the Oregon research station in 2011 (OR1-11) had very high numbers of fruit in all varieties, so with only 11 environments this site may have an exaggerated influence on the results.

Fig. 3. Linear regression of mean marketable fruit numbers of seven squash varieties on an EI composed of the mean of all varieties in each environment, from participatory organic vegetable trials in NY, WI, OR and WA, 2010–2013. Varieties are shown from top left in order of mean performance in all sites. Dashed gray lines represent a reference slope of 1; solid black lines represent the regression line a given variety on EI. Regression lines with slope >1 (e.g., ‘Metro’) show specific adaptation to higher-yielding environments, while those with slope <1 (e.g., ‘Waltham’) show specific adaptation to lower-yielding environments. The null hypothesis for the regression equation is that the regression coefficient (slope) is not significantly different from one.
Linear regression revealed different patterns of adaptation for the two squash yield metrics (Fig. 4). Where ‘Tiana’ showed broad adaptation for fruit number, in terms of weight it was more specifically adapted to high-yielding sites (β = 1.6, P = 0.088, R 2 = 0.74). ‘Waltham’ displayed the opposite, with broad adaptation in terms of marketable weight (β = 1.1, P = 0.75, R 2 = 0.7). Among the lower-yielding varieties, ‘Pilgrim’ (β = 0.96, P = 0.83, R 2 = 0.74) and ‘Bugle’ (β = 0.76, P = 0.094, R 2 = 0.79) appeared to be more responsive to improved environments while ‘Early’ (β = 0.67, P = 0.0015, R 2 = 0.91) and ‘JWS 6823’ (β = 0.51, P = 0.039, R 2 = 0.42) appeared to be less responsive. For both yield metrics, the higher-performing varieties displayed greater variation in terms of performance across environments than lower-yielding varieties.

Fig. 4. Linear regression of mean marketable weight of seven squash varieties on an index of 11 environments, from participatory organic vegetable trials in NY, WI, OR and WA, 2010–2013. Varieties are shown from top left in order of mean performance in all sites. Dashed gray lines represent a reference slope of 1; solid black lines represent the regression line a given variety on EI. The null hypothesis for the regression equation is that the regression coefficient (slope) is not significantly different from one.
For broccoli head size, ‘Gypsy’ (β = 1, P = 0.93, R 2 = 0.51) and ‘Belstar’ (β = 0.85, P = 0.53, R 2 = 0.53) were broadly adapted, with regression coefficients equal to or very close to one, though ‘Gypsy’ had head sizes more consistently above site averages (Fig. 5). ‘Arcadia’ and ‘Windsor’ also displayed broad adaptation. The three open-pollinated entries, though genetically related, displayed markedly different patterns of adaptation. The variety ‘Solstice’ showed specific adaptation to higher-yielding environments (β = 1.4, P = 0.013, R 2 = 0.79), while ‘Common Ground Population’ showed broad adaptation across environments (β = 1, P = 0.86, R 2 = 0.86) and ‘OSU Composite’ seemed to display better adaptation to more challenging environments (β = 0.5, P = 0.028, R 2 = 0.21).

Fig. 5. Linear regression of mean head diameter of seven broccoli varieties on an index of 23 environments, from participatory organic trials in NY, WI, OR and WA, 2010–2013. Varieties are shown from top left in order of mean performance in all sites. Dashed gray lines represent a reference slope of 1; solid black lines represent the regression line a given variety on EI. The top four varieties in terms of head size all showed broad adaptation (slope not significantly different from 1). The null hypothesis for the regression equation is that the regression coefficient (slope) is not significantly different from one.
Regression on EI for broccoli uniformity of maturity was less informative than for the preceding variables. The variation among varieties was small enough that we may not have had the statistical power to detect differences between varieties with this sample size. A contributing factor was that environmental means were strongly grouped between 0.25 and 0.75. Measuring variables as proportions may have obscured the variation between environments. We have included regression analysis for broccoli uniformity of maturity (Fig. 6) as a demonstration of what AA looks like under these circumstances. Similarly, the use of one-to-five rankings for both carrot variables resulted in data strongly clustered around three and therefore not capturing a wide range of average performance. Inclusion of more or fewer environments in the linear regression for the carrot variables demonstrated that the results of regression on EI were highly influenced by which sites were included. Because of this and because ANOVA showed environment not to be a significant source of variation for either carrot variable, regression analysis was not conducted.

Fig. 6. Linear regression of maturation uniformity of seven broccoli varieties on an index of 20 environments, from participatory organic trials in NY, WI, OR and WA, 2010–2013. Varieties are shown from top left in order of mean performance in all sites. Dashed gray lines represent a reference slope of 1; solid black lines represent the regression line a given variety on EI. The null hypothesis for the regression equation is that the regression coefficient (slope) is not significantly different from one.
AMMI analyses of replicated hub sites
Biplots of the first two principal components (with each variety and environment plotted) for all traits, as well as stability statistics and ANOVA have been included as Supplementary material. When considering research station sites only (because sufficient replication at those sites provided enough degrees of freedom to analyze GE interactions), ANOVA models showed a significant treatment (i.e., genotype and environment) effect for all traits. In addition, the GE interaction was highly significant for squash marketable weight (P = 0.0001), squash marketable number (P = 0.0001), broccoli average head size (P < 0.0001) and carrot root smoothness (P = 0.0001), and marginally significant for broccoli maturation uniformity (P = 0.0554). The GE interaction was non-significant for carrot sweetness (P = 0.4317).
Because the number of GE interaction terms is the product of the number of varieties and environments, it can be challenging to interpret this large number of terms. AMMI reduces these interactions to their principal components to simplify interpretation. If the first two principal components capture >50% of the variability in the GE interaction terms, an AMMI biplot may be interpreted such that varieties plotted near the origin are considered to be more stable than those plotted further from the origin. Varieties close to the origin in AMMI biplots should therefore be expected to correspond to regression slopes close to 1.0 in the adaptability analysis. However, this was not always borne out in our analysis. For example, the AMMI biplot for broccoli average head size (Fig. 7) showed that ‘Windsor,’ ‘Arcadia’ and ‘Gypsy’ were plotted far from the origin, implying lower stability. In the adaptability analysis (Fig. 5) however, none of these varieties had a slope significantly different from 0 (P-values = 0.68, 0.45 and 0.93, respectively). Squash marketable weight per plant had some agreement between analyses. The biplot (Fig. 8) shows ‘Tiana’ and ‘JWS 6823 Butternut’ far from the origin, and both of these varieties had evidence of slopes different than 1.0 (P = 0.088 and 0.039, respectively). The AMMI analyses did provide greater detail regarding the relative environmental conditions of the research sites. The example of broccoli head size demonstrates the strong effect of temporal variation in this data, for example WI1-11 and WI1-12 were negatively correlated (in opposite quadrants) although they are the same location in two consecutive years.

Fig. 7. AMMI2 biplot (PC1 vs PC2) for broccoli average head diameter (cm) with seven genotypes (G) and nine environments (E) consisting of research station in OR, WA, WI and NY in 2010–2012. In environment names, letters denote states and the last two digits denote year.

Fig. 8. AMMI2 biplot (PC1 vs PC2) for squash average marketable weight (kg) with seven genotypes (G) and nine environments (E) consisting of research station in OR, WA, WI and NY in 2010–2012. In environment names, letters denote states and the last two digits denote year.
Discussion
Our results show the responses of varieties to environments in the NOVIC trials and provide insights into the advantages and limitations of adaptability analysis in participatory variety trials. When considering quantitative data and continuous variables, as we did for yield characteristics in squash and broccoli, adaptability analysis proved to be a useful method to produce graphical representations of adaptation patterns. We agree with Hildebrand and Russell (Reference Hildebrand and Russell1996) that graphs of performance regressed on EI have the potential to allow farmers to visualize variety adaptation, which could help them to make decisions based on the type of adaptation they prioritize. Based on our experience of sharing results with farmer audiences, we view these graphics as a useful tool to help farmers judge whether a variety is more broadly or narrowly adapted. Further evaluation of farmer experience in the NOVIC project is planned, but as of this writing we have not conducted a more formal evaluation to determine how well farmers are able to understand and implement findings from this method into their decisions. Further testing through direct farmer feedback would be useful in assessing how this type of analysis could best be applied to PPB.
Adaptability analysis proved less informative when working with ratio variables and qualitative rankings because these types of variables tended to be highly clustered on the x-axis, leading to a scattershot pattern. This is important because such qualitative rankings are commonly used to evaluate traits related to vegetable quality, in our case flavor, appearance and harvest (maturation) uniformity. Participatory research would benefit from improved methods to evaluate these characteristics, while considering the logistical challenges associated with collecting data from multiple field sites at peak maturity for fresh vegetable crops. This is particularly important in breeding for the organic market, where culinary characteristics are of great importance.
Adaptation of NOVIC varieties
The contrast between ‘Tiana,’ ‘Metro’ and ‘Waltham’ in terms of marketable squash fruit per plant illustrates the utility of regression on EI for demonstrating differences in adaptation. These varieties show the importance of considering multiple variables to characterize adaptation, as results differed depending on whether yield was measured as marketable weight or marketable fruit number. The desirability of these two yield metrics can depend on marketing practices, as farmers growing for wholesale and processing may benefit from increased net weight per plant, while CSA growers often prioritize having more individual fruit to put in customer boxes and tend to prefer medium-to-small sized winter squash. However, a tradeoff has been observed between the size of individual squash fruit and the number of fruit per plant (Pessarakli, Reference Hildebrand and Russell2016, p. 14). Additional variables would create an even more complex picture of adaptation; for example, maturity is not considered here but probably influenced yield across environments.
For broccoli head diameter, the broad adaptation and high average performance of ‘Belstar’ and ‘Gypsy’ confirmed farmers’ observations based on experience with these widely used hybrids. While this trial was not designed to compare adaptation of hybrids and OP varieties, it is worth noting that the only broccoli entries that deviated from the pattern of wide adaptation were OP entries derived from participatory breeding methods, with ‘Solstice’ and ‘OSU Composite’ showing specific adaptation to high- and low-yielding environments, respectively. The ‘OSU Composite’ population, from which ‘Common Ground Population’ and ‘Solstice’ diverged, was developed through a cyclical convergent–divergent selection process on organic farms predominantly on the east and west coasts (Myers et al., Reference Myers, McKenzie, Voorrips, van Bueren and Myers2012b). It was exposed to more diverse environments than the other two populations during the selection process, and had some germplasm introgression from other broccoli varieties that farmers were growing in their individual environments. ‘Solstice’ and ‘Common Ground Population’ diverged from the ‘OSU Composite’ at different stages in development. ‘Solstice’ is the result of participatory breeding undertaken by Jonathan Spero of Lupine Knoll farm in southwestern Oregon in collaboration with Prof James Myers of Oregon State University, using the ‘OSU Composite’ breeding stock (Myers et al., Reference Myers, McKenzie, Voorrips, van Bueren and Myers2012b) and became isolated in the early 2000s. The growing environment at Lupine Knoll farm generally has milder winters, earlier springs and significantly hotter summers that confine growth of cole crops to the spring and fall, in contrast to the Willamette Valley OR and Olympia WA locations where summer temperatures are generally not limiting to cole crop production. In contrast, ‘Common Ground Population’ diverged in 2009, where it was subject to strong selection in a single nitrogen-limited PNW maritime environment. Though we hesitate to draw conclusions based on the low number of environments, our analysis raises the question of whether ‘Solstice’ is better adapted to relatively heterogeneous and potentially stressful environments due to the conditions of the farm and region in which it was selected. In other words, the environmental conditions and subsequent effect on natural and farmer selection at Lupine Knoll Farm where ‘Solstice’ was selected, would more closely resemble the continental climates of WI and NY than cooler, wetter sites in the Willamette Valley OR and Olympia WA where ‘Common Ground Population’ was selected.
The results for the two carrot variables demonstrate the limits of qualitative ranking (i.e., one-to-five scores) as an evaluation method in multi-farm variety trials. Because evaluation teams varied from state to state, with different farmers participating at each farm site, evaluator effects are impossible to separate from environment effects for the carrot variables. Multiple evaluators with varying taste perceptions may have resulted in too much variation in the scores given to each variety to observe significant separation between varieties. However, the difference between ‘Spring Market,’ which is a New Zealand overwintering carrot, and the other varieties which are all Nantes types, shows that evaluators agreed about the difference in tastes between these variety types.
Adaptability analysis in on-farm trials
The adaptability analysis approach of regression of variety yields on EI can serve as a simple, visual method for interpreting how varieties respond to higher- and lower-quality growing environments and identifying patterns of adaptation. This method can be used even when varieties were not grown in the same place in consecutive years, and when on-farm trials consist of single plots, an advantage for participatory trials. Characterizing adaptation as demonstrated by these analyses can provide a better basis for choosing varieties that suit specific purposes, environmental conditions and farming strategies. However, cases where performance is primarily measured as a proportion or a qualitative score (such as 1 to 5 or 1 to 9), will likely violate the requirement of adaptability analysis that EI represent a wide range of average performance. It may therefore be of limited use when evaluating traits that are categorized using rating scales rather than measured directly.
Whether narrow adaptation to specific environments (as demonstrated by varieties like ‘Metro’) is preferable to broad adaptation across environments (as demonstrated by varieties like ‘Gypsy’) rests in part on the type of environmental variation that farms experience. Varieties with specific adaptation to high-yielding environments are appropriate when farmers place a high priority on maximizing yield, can reasonably assure optimal growing conditions for the crop in question (e.g., access to irrigation and high levels of fertility), and can tolerate a higher risk of crop loss in the case of unexpected environmental challenges. On the other hand, varieties with adaptation to low-yielding environments are preferable for farmers with lower risk tolerance and who prioritize having some yield in challenging circumstances over maximizing yields in optimal circumstances (Ceccarelli, Reference Ceccarelli1994). Environments may be low-yielding for many reasons. While varieties bred for specific high yielding environments may excel when they are free from stresses but varieties with, for example, broad quantitative resistance will perform well in a broad range of environments. Additionally, while spatial variation in farm environmental conditions can be targeted by specific breeding for eco-regions, regions with less predictable weather (high temporal variation) also call for more broadly adapted varieties.
Relative to humus-based organic farms (as opposed to industrial organic), conventional farms have much more homogenous environments, with varieties experiencing less variation for factors such as nutrient availability, weed competition and pest and disease epidemics. Organic farms, on the other hand, require varieties where the genotype of the crop is able to buffer against these factors. In addition, many organic vegetable farmers practice diversified (i.e., multi-crop) production; in a survey of Wisconsin organic vegetable producers, the average number of crops grown was 23 (Lyon et al., Reference Lyon, Silva, Zystro and Bell2015). This type of production inherently means that some crops are likely to be cultivated in suboptimal conditions for that particular crop, meaning that diversified farms are likely to benefit from varieties that can tolerate lower-quality environments. It can therefore be argued that, due to the need for greater stability and environmental buffering, crop varieties intended for organic systems require broad agronomic adaption over space and time, even when developed for single environments or regions.
Limitations of adaptability analysis
The usefulness of adaptability analysis was severely limited when considering non-continuous variables, which included all the non-yield traits. In our study, these traits included flavor, appearance and maturation uniformity, but other traits named as priorities by organic farmers, such as disease tolerance, insect tolerance and season extension, present similar challenges for evaluation. In the case of broccoli, the use of a proportion to measure maturation uniformity (head at peak maturity/total heads) may have led to data being artificially grouped around on 0.5, producing an EI with an insufficient range of values for meaningful evaluation of adaptation. In the case of carrot, both traits were evaluated as qualitative one-to-five scores by different evaluators at each site, creating an evaluator effect as well as an environment effect which likely explains the high site-to-site variability.
Although scoring is a common method for evaluating entries in plant breeding programs, researchers have long been aware that evaluators tend to disproportionately assign values of two through four, and avoid values of one or five, effectively limiting in the range of the scale (Coe, Reference Coe, Bellon and Reeves2002). An extra layer of variability is added in a project with multiple evaluators, who may interpret the scale differently. However, quantitative measurement of these traits can be much more expensive and laborious. Establishing specific descriptors for each level of the scale may help make this data more reliable. Alternative methods of evaluating quality traits should be explored, including systematic approaches to recording farmers’ written or verbal observations (Ashby, Reference Ashby1990). Efficient but precise and reliable methods for evaluating quality related traits would allow researchers to assess stability and adaptation with regard to a wider variety of traits, an advantage in breeding and trialing varieties for the organic sector.
Comparing AMMI and adaptability analysis
Although AMMI is frequently used to determine both stability and adaptation of varieties to ecoregions, in our case, a compelling story did not emerge. For some varieties, AMMI and adaptability analysis were in agreement about stability, while for others they presented conflicting results. This could be due to the low number of environments or varieties we were able to include from this dataset. The differences in results when comparing AMMI and AA for broccoli may be explained by AMMI having roughly half as many environments as were considered in the broccoli AA. However, for squash, the data considered were almost identical (nine environments in AMMI vs 11 for AA), yet results between the two analysis still did not align.
Despite this inconclusive result, it was enlightening to conduct both AMMI and regression analysis with this dataset, which represented a heterogeneous network of participatory variety trials on both research stations and on-farm sites. While the potential of AMMI to delineate mega-environments for plant breeding as well as assess the stability of varieties has been demonstrated, the clear limitation of AMMI in our case was the need for replications within environments in order to estimate GE interaction. For this reason, AMMI is better suited to comparing environments where researchers have sufficient involvement to carry out replicated trial designs.
Vegetable crops require intensive management throughout the growing season and have narrow maturity windows during which yield and quality must be evaluated. Including working farms as trial environments is of interest and importance to plant breeding for organic agriculture, yet on-farm trials are often planted and maintained by farmer volunteers because more than one or two researcher visits per season is cost prohibitive. Expecting farmers to plant and maintain replicated vegetable trials simultaneously with the rest of their farm production is not realistic. It is therefore our challenge as researchers to implement trial designs and analyses that can incorporate on-farm data while also making use of replicated research station trials to provide a more detailed picture.
Conclusion
Our experience with on-farm trials in the NOVIC project showed the potential of participatory trialing networks to provide insight into variety performance on working organic farms across wide geographic areas. Innovative organic farmers are interested in new crops and varieties, and university supported on-farm trials have the potential to mitigate the risk involved in planting a new and untested variety. However, working with the NOVIC dataset demonstrated the difficulties of gathering on-farm data for vegetable crops due to the unique issues of harvest time and workflow characteristic of working organic farms. These challenges call for rethinking trial designs, particularly with respect to data collection strategies, and statistical analyses for participatory trialing and breeding, as well as the roles of farmers and researchers in research collaborations. For vegetable variety trials specifically, there are two possible directions. One would be a more decentralized approach, with farmers receiving seed, trial design suggestions and evaluation worksheets, and being largely responsible for data collection. Evaluations in this scenario need to be simple and rapid to execute. Researchers receive data from farmers and be responsible for analysis and distribution of the findings. The opposite direction is a more centralized approach, with data collection happening largely on research stations and with farmers engaged in alternative activities as opposed to on-farm trials. After several years of mother–daughter trials, this more centralized approach has been adopted for sweet corn trials in the current iteration of NOVIC.
Recent projects also provide examples of creative combinations of these approaches. For instance, centralized trials on research stations can be paired with on-farm trials in which evaluation is centered on farmer's anecdotal comments. Though this would preclude statistical analysis of on-farm trials, a significant depth of information could be captured through such experiential evaluations. Along these lines, trailing networks such as the Culinary Breeding Network (Oregon State University) and the Seed to Kitchen Collaborative (University of Wisconsin-Madison) are exploring novel approaches to sensory evaluation involving a wide range of participants from farmers to chefs (Beans, Reference Beans2017; Healy, Emerson, and Dawson, Reference Healy, Emerson and Dawson2017; Kissing Kucek et al., Reference Kissing Kucek, Dyck, Russell, Clark, Hamelman, Burns-Leader, Senders, Jones, Benscher, Davis, Roth, Zwinger, Sorrells and Dawson2017). Alternately, on-farm trials can be limited to a few, highly involved farms, with feedback and guidance from a wider circle of farmers who do not directly grow the trial entries. The potential of key relationships between individual, highly motivated farmers and trained plant breeders has already been demonstrated in the release of several participatory bred varieties, such as ‘Who Gets Kissed?’ sweet corn (Shelton and Tracy, Reference Shelton and Tracy2015), ‘Peacework’ pepper (Mazourek et al., Reference Mazourek, Moriarty, Glos, Fink, Kreitinger, Henderson, Palmer, Chickering, Rumore, Kean, Myers, Murphy, Kramer and Jahn2009) and ‘Dark Star’ zucchini (Prairie Road Organic Seed, 2018). This model of relationships may serve as a more appropriate framework for vegetable trials, than attempting to gather data from many farms, as has been achieved with participatory trialing of grain crops. However, as the experience discussed earlier of selecting ‘Solstice’ broccoli demonstrates, selection on an individual farm may result in a variety specifically adapted to that particularly environment. Better delineation of eco-regions should therefore be of particular concern for breeding for organic agriculture.
Resilient and well-adapted varieties are widely recognized as priorities for organic and agroecological production systems, in vegetables as well as other crops. Developing effective ways to identify and evaluate varieties with these characteristics, particularly in terms of quality traits, will benefit both organic breeding and farmers’ ability to judge the performance of existing varieties. Whatever the arrangement, approaches to variety trialing that facilitate collaboration between trained researchers and organic farmers will ensure that research for the organic sector truly reflects the environmental and cultural conditions of organic farms. Adaptability analysis may be a useful tool toward both these ends, to be combined with others in improving the productivity and sustainability of organic vegetable production.
Supplementary material
The supplementary material for this article can be found at https://doi.org/10.1017/S1742170518000583.
Author ORCIDs
Alexandra Lyon 0000-0001-8486-7688
William Tracy 0000-0002-9855-302X
Michael Mazourek 0000-0002-2285-7692
James Myers 0000-0003-0976-144X
Acknowledgements
We are deeply grateful to the network of NOVIC collaborators, including farmers, researchers, field crew and organizational staff, who made this research possible and continue to carry it forward. In particular, we are indebted to field managers who coordinated the trials during the timespan covered here, including Michael Glos (Cornell), Anne Pfeiffer (UW-Madison), Lane Selman (OSU) and Laurie McKenzie (Organic Seed Alliance). We are indebted to Tessa Peters for her advice in improving our figures and analysis. In addition, three anonymous reviewers provided feedback which greatly improved this manuscript.
Financial support
This paper is based upon research that is supported by the National Institute of Food and Agriculture, US Department of Agriculture, under award number 2009-51300-05585.


