INTRODUCTION
The production of graphite targets for accelerator mass spectrometry (AMS) measurements is currently achieved at the NERC Radiocarbon Facility, East Kilbride by reduction over Zinc (Zn) following the method by Slota et al. (Reference Slota, Jull, Linick and Toolin1987). While we are able to routinely obtain acceptable background levels and accuracy for samples sizes ∼0.5 mg C and above, the throughput of this method is limited by the number of graphitization ports available, in our case, a maximum of 16 graphite targets can be produced in a 24-hr period, 4 times a week, using two graphitization lines. The set-up is also relatively expensive involving the use of a pressure transducer and two heating blocks (one for the reaction over Zn and another one for the reaction over iron) per each graphitization port, and a temperature controller as well as considerable operator time required to monitor temperature and pressure and to place and remove the heating blocks. In addition, graphite is contained in an open tube which must be carefully capped and stored until pelletization is carried out, ideally on the same day to avoid excessive exposure of the graphite to ambient air.
The sealed-tube method of graphitization is a relatively easier and faster procedure to make graphite targets while being cost-effective and inexpensive. The method is also based on the reduction of CO2 over Zn but in the presence of hydrogen derived from a second reagent titanium hydride (TiH2). The reactions and method are described by Xu et al. (Reference Xu, Trumbore, Zheng, Southon, McDuffee, Luttgen and Liu2007). They were adapted from Vogel (Reference Vogel1992) and further developed by Khosh et al. (Reference Khosh, Xu and Trumbore2010) and Xu et al. (Reference Xu, Gao and Salamanca2013) for the graphitization of sample sizes down to ∼15 µgC and later for ultra-small samples (down to ∼4 µgC) by Walker and Xu (Reference Walker and Xu2019). This method has also been adopted at other laboratories (e.g., Rinyu et al. Reference Rinyu, Molnar, Major, Nagy, Veres, Kimak, Wacker and Synal2013; Macario et al. Reference Macario, Oliveira, Moreira, Alves, Carvalho, Jou, Oliveira, Pereira, Hammerschlag, Netto, Seixas, Malafaia, Moreira, Cunha, Assumpção, Mallet, Lima, Lopes, Diaz, Chanca and Gomes2017).
MATERIALS AND METHODS
We have tested the sealed-tube method for graphite sizes ranging from ∼1 mg C to ∼0.1 mg C, which represent the range of samples sizes currently processed at our Facility. Over the course of our testing, we measured our targets at the KCCAMS Facility in the University of California, Irvine (UCI) on a 0.5MV AMS and at the SUERC AMS Facility on a 5MV AMS. Both AMS systems measured the δ13C online and these AMS δ13C values were used to correct for isotopic fractionation, which is recommended for better precision, especially when using sealed-tube graphitization (Xu et al. Reference Xu, Trumbore, Zheng, Southon, McDuffee, Luttgen and Liu2007). Radiocarbon results are given as conventional radiocarbon ages in years before present (yr BP) and as Fraction Modern (FM) following the conventions of Stuiver and Polach (Reference Stuiver and Polach1977).
We followed the procedure by Xu et al. (Reference Xu, Trumbore, Zheng, Southon, McDuffee, Luttgen and Liu2007) as we were first interested in testing the method on the sample size range of 1.0–0.5 mg C, which makes the most of the sample sizes processed at our Facility. However, there were some differences between the method by Xu et al. (Reference Xu, Trumbore, Zheng, Southon, McDuffee, Luttgen and Liu2007) and our method. We used the same reagents Zn and iron (Fe) that are used in our routine Zn graphitization method (Slota et al. Reference Slota, Jull, Linick and Toolin1987), for convenience. The reagent Zn is from Fisher Scientific (Z/0450/53, Lot: 1666627, general purpose grade) and Fe is from AnalaR NORMAPUR (Batch 11H160001, product 24088.232, 99.5% purity). It is worth noting the finer particle size of our Fe of <10 µm, compared to <44 µm for the Fe used by Xu et al. (Reference Xu, Trumbore, Zheng, Southon, McDuffee, Luttgen and Liu2007). The only reagent we used in common with those used by Xu et al. (Reference Xu, Trumbore, Zheng, Southon, McDuffee, Luttgen and Liu2007) is TiH2 from Alfa Aesar (D12857, Lot: A4568A, 99% purity).
The reagents amounts used in our tests were as follows: 30–35 mg of Zn, 10–15 mg of TiH2 and 6–7 mg of Fe. The amounts of Zn and TiH2 are the optimal amounts for the target size range tested here (Xu et al. Reference Xu, Trumbore, Zheng, Southon, McDuffee, Luttgen and Liu2007) while the amount of Fe used has proven to provide good currents from our graphites at the KCCAMS and SUERC AMS Facilities. The dimensions of the tubes used are as shown in Figure 1, tubes are Pyrex glass and they were cleaned at ∼550°C for 7 hr prior to adding reagents. Zn and TiH2 were added to the long outer tube and Fe was added to the inner tube. A different curette was used for each reagent (the size of the curette was chosen according to the amount of reagent required) and they were pre-cleaned by heat or rising with methanol followed by air drying. Curettes were pre-tested to give the correct amounts, which were on average: 6.5 ± 0.4 mg of Fe (n=15), 32.8 ± 2.6 mg of Zn (n=10) and 14.5 ± 1.1 mg of TiH2 (n=10). The use of curettes, when used carefully for consistency, allows for fast addition of reagents without the need to weigh the amounts for every tube. We prepared several outer and inner tubes as needed for the day or the week. After addition of the reagents, tubes were further cleaned at 300°C for 1 hr as recommended by Khosh et al. (Reference Khosh, Xu and Trumbore2010). We stored assembled/cleaned reaction tubes in an airtight container with desiccant (Fisher Scientific, S/0761/53) and carbon adsorbent (Fisher Scientific, S/1700/53). Small beakers (∼50 mL) were filled with desiccant and carbon adsorbent, covered with filter paper (fixed with a rubber band) and placed inside the containers. Also, assembled tubes were kept covered with aluminium foil at all times after cleaning, before and after addition of reagents. Storage was not longer than ∼1 week.
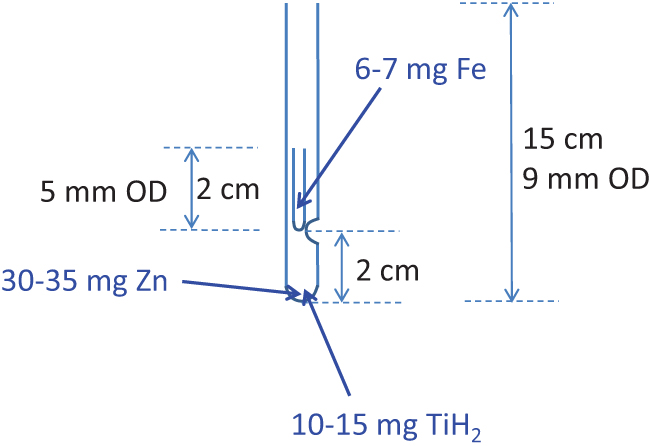
Figure 1 Dimensions of tubes used for sealed graphitization. Reagents zinc (Zn) and titanium hydride (TiH2) are placed in the outer 9-mm OD tube and catalyst iron (Fe) is placed in the inner 5-mm OD tube (see text for amounts and manufactures used). CO2 is frozen in the tube and the tube is sealed at ∼7–8 cm height. The inner tube can be 3 cm long for easier handling and the indentation on the 9mm OD tube can be placed at 1 cm from the bottom to achieve the same sealing height.
Assembled and cleaned tubes were connected to a vacuum line fitted with a turbo pump (routinely reaching a vacuum of ∼10–5 mbar) and a small calibrated volume (6.09 mL). Purified CO2 from standard materials (see below) was frozen in the assembled tube using liquid nitrogen and the tubes were flame-sealed (maintaining a specific and constant height, see Results). Sealed tubes were placed upright in an aluminium block and heated at 550°C for 7 hr for the filamentous graphite to form (Supplemental Figure 1). We did not split the heating for graphitization into 4 hr at 500°C and 3 hr at 550°C as described by Xu et al. (Reference Xu, Trumbore, Zheng, Southon, McDuffee, Luttgen and Liu2007) but we do not expect this to have an adverse effect on the graphitization reactions.
We evaluated background levels obtained with the sealed-tube method by graphitizing CO2 aliquots of different volumes derived from the hydrolysis of Iceland Spar Calcite, hereafter referred to as Bulk Iceland Spar Calcite (BISC). This eliminates the backgrounds from combustion and thus simplifies the evaluation. The aliquots were obtained as splits of ∼2 mL gas volumes or less, which had previously been split from a large CO2 volume (∼1 L) produced from hydrolysis. Care was taken to aliquot pure CO2 each time. Splits for this work were made to different volumes equivalent to a sample size ranging from ∼0.1 mg C to ∼1.7 mg C. We tested the precision and accuracy of the graphitization method by graphitizing CO2 aliquots of secondary standards. We used FIRI Belfast Cellulose and TIRI Barleymash with consensus values of 4485 ± 5 yr BP (0.5722 ± 0.0040 FM) and 1.1635 ± 0.0084 Fraction Modern, respectively (Scott et al. Reference Scott2003a, Reference Scott2003b). Different sample sizes ranging from ∼0.1 mg C to ∼1.6 mg C were obtained as CO2 splits similarly to CO2 aliquots from Iceland Spar Calcite, except using an initial volume (∼1 L) of CO2 produced from the combustion of each of the secondary standards. These CO2 aliquots are hereafter referred to as Bulk Belfast Cellulose (BBC) and Bulk Barleymash (BBM). We also used an initial volume (∼1 L) of CO2 produced from our primary standard oxalic acid (OXII) to obtain CO2 splits (as described above) for graphitization in various sizes as required by each AMS run.
Normalization to our primary standard OXII was done using the “non-matching size” and the “size-matching” methods described by Santos et al. (Reference Santos, Southon, Griffin, Beaupre and Druffel2007). The “non-matching size” method was used at the UCI Facility. This method uses a set of regular size OXII (∼0.7 mg C) for normalization and a set of smaller sizes of OXII (spanning the range of sample sizes in the wheel) to correct for dead-carbon (DC) contamination, the latter applicable to sample sizes ∼0.1 mg C and smaller. This method is more convenient when measuring targets of various sizes as it does not require matching the size of the primary standard to every sample size in the wheel and thus was used by the KCCAMS Facility during routine measurements of our wheels containing various other samples sizes. At the SUERC AMS Facility, we ran our tests of the sealed-tube method separately from our routine wheels and thus we were able to use the “size-matching” method for normalization, which uses a set of size-matched OXII (matched to the sample sizes being analyzed) thus eliminating the need to correct for DC contamination (Santos et al. Reference Santos, Southon, Griffin, Beaupre and Druffel2007).
RESULTS AND DISCUSSION
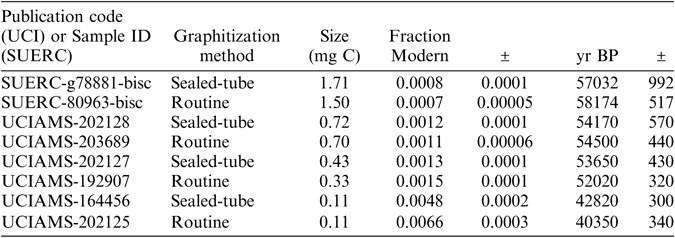
As expected, background levels were sample size-dependent and using the sealed-tube method we obtained a minimum background of 0.0008 ± 0.0001 Fraction Modern (57,032 ± 992 yr BP) and a maximum of 0.0036 ± 0.0001 FM (45,280 ± 310 yr BP) for sample sizes containing over 0.5 mg C (n=22) and when accounting for the variability observed (Figure 2a), part of which might be explained by changes in testing conditions, as explained below. Relatively greater variability and greater background levels were observed for sample sizes smaller than 0.5 mg C, as expected, however the best results were also comparable to background values obtained using the routine Zn graphitization (Table 1). The variability in background levels of sizes smaller than 0.5 mg C ranged from a minimum of 0.0013 ± 0.0001 FM (53,650 ± 430 yr BP) to a maximum of 0.0101 ± 0.0004 (36,952 ± 343 yr BP) with a few relatively higher background values in batch 3 (Figure 2). Background levels in batch 3 were surprisingly higher than what we were able to obtain in previous measurements/batches of similar sample sizes, and they were relatively elevated across the entire size range tested. Batch 3 was measured using a different ion source in the 5MV machine compared to batches 1 and 2, which were measured on the same source. This however, is not expected to have affected the results of batch 3. There were no issues reported during the measurement of this batch and targets produced good currents (according to size). In addition, we maintained the conditions of graphitization that worked best (e.g., produced the lowest background), as observed during previous tests, explained in detail below. Thus the cause of relatively higher background levels in batch 3 compared to batches 1 and 2 is unclear. A summary of the background levels obtained per sample size is shown in Table 1. To better compare background results from the different independent tests, Figure 2b) shows the effect of fixed amounts of modern carbon contamination (shown by solid lines) in logarithmic scale. Besides comparable performance to our routine Zn graphitization method, the best background values (observed in batches B039 and B047), were very close to background values obtained by Khosh et al. (Reference Khosh, Xu and Trumbore2010) for ∼0.1 mg C and smaller samples. Comparing the results from measurements on a 0.5 MV and a 5 MV AMS, while there was overlap, additional measurements are required on the 5MV AMS to replicate the performance of the method observed on the 0.5 MV AMS.
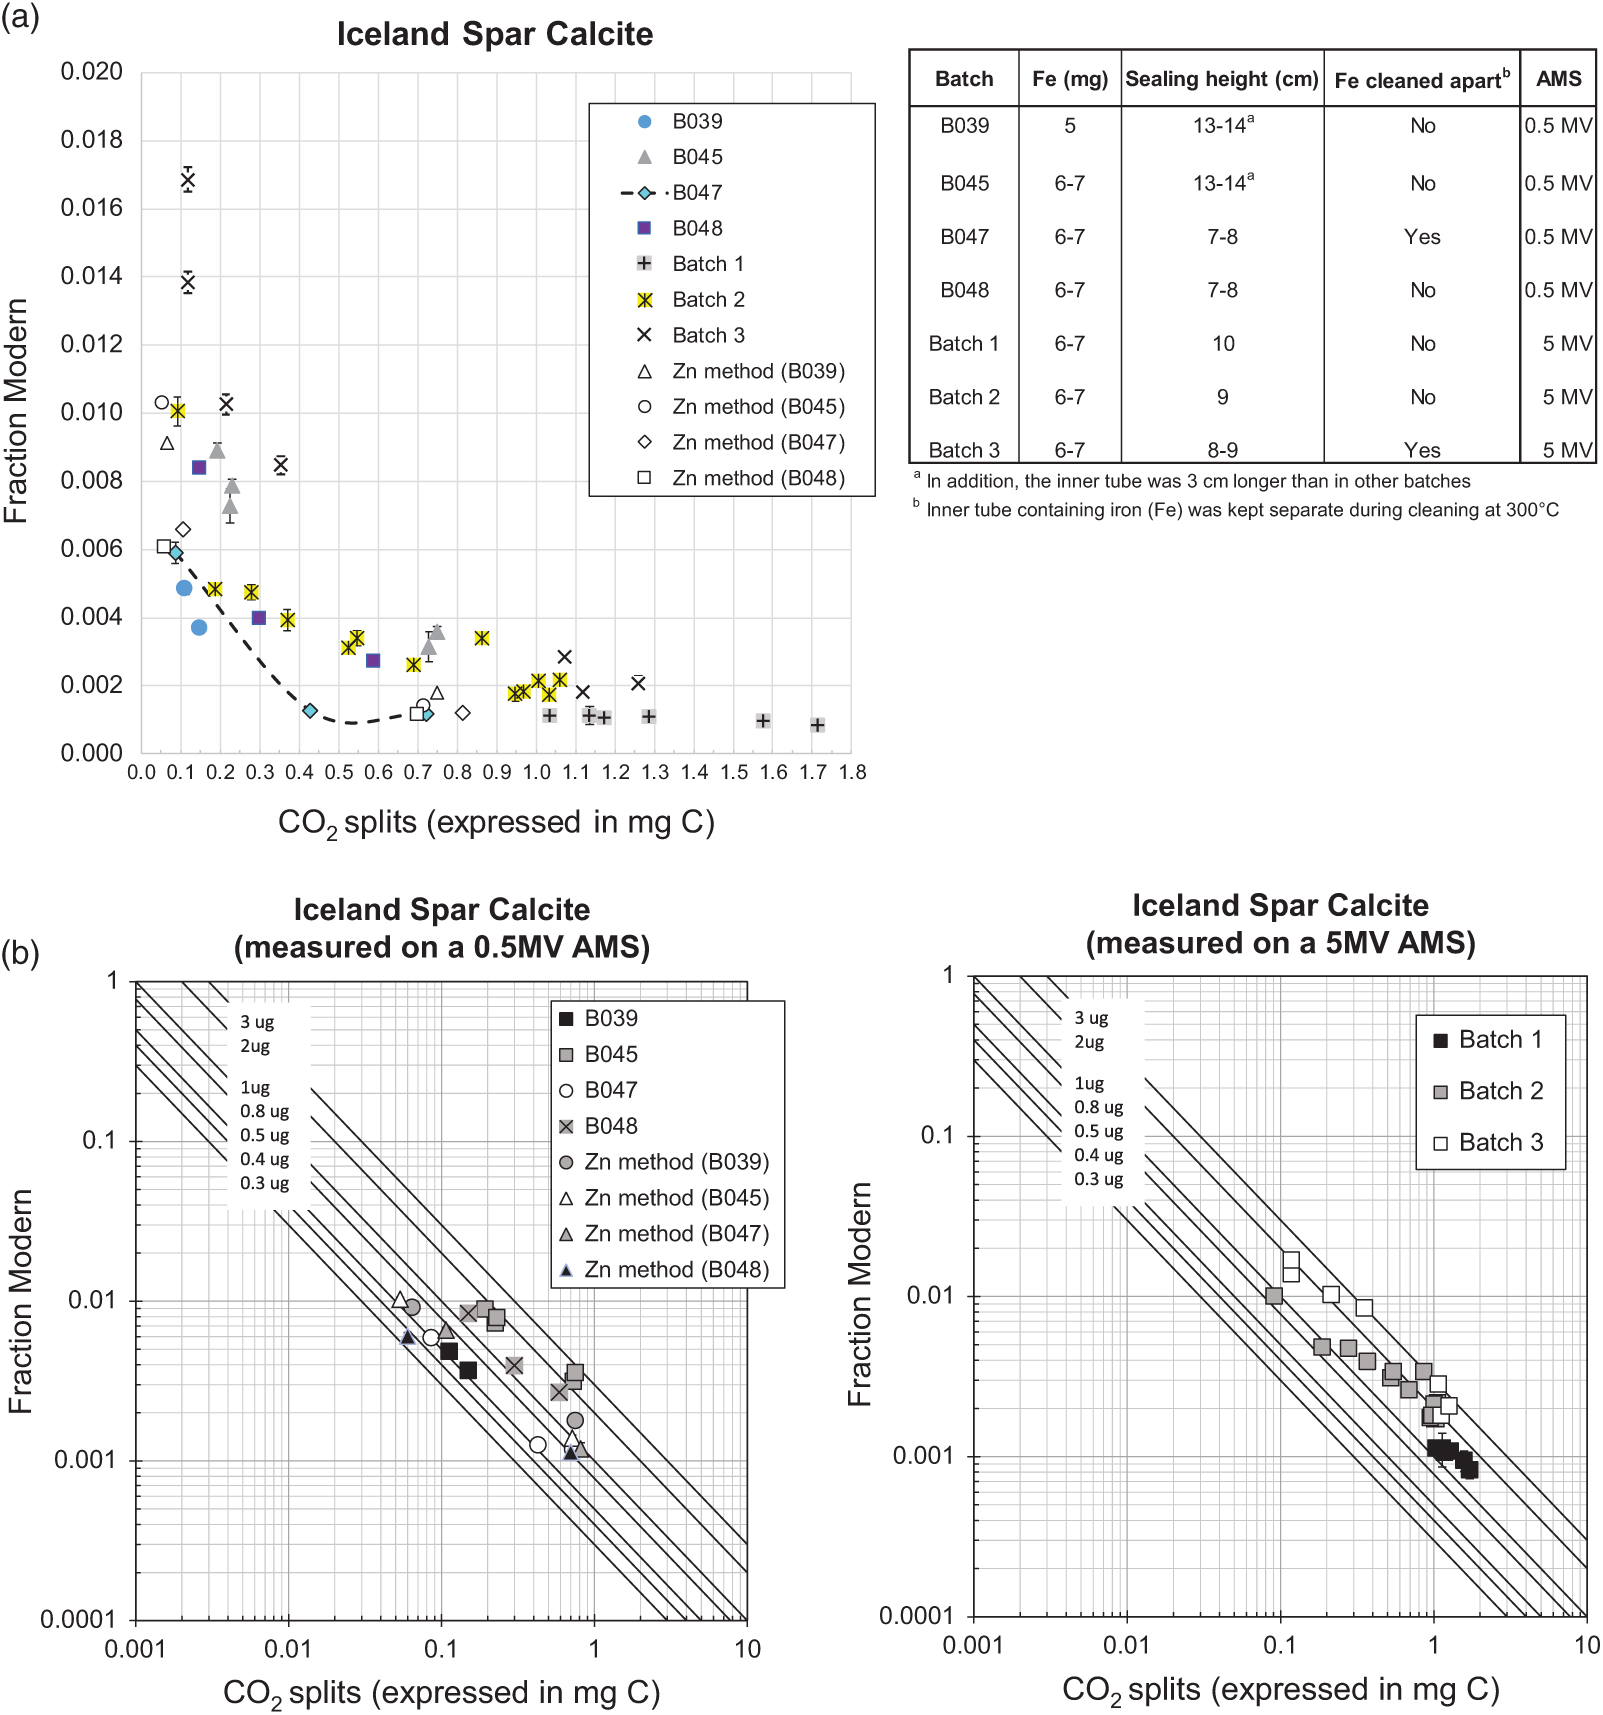
Figure 2 Fraction modern values of CO2 derived from the hydrolysis of Iceland Spar Calcite and graphitized with the sealed-tube method, except when “Zn method” is specified, which refers to our routine graphitization procedure (after Slota et al. Reference Slota, Jull, Linick and Toolin1987). CO2 splits were obtained from ∼2 mL volumes previously taken from a large volume (∼1 L) derived from the hydrolysis. (a) Shows the graphitization conditions tested; Graphites were measured on a 0.5 MV at UCI except for Batches 1–3, which were measured on a 5MV AMS at SUERC; dotted line shows the best results after incorporating the recommendations in this work; (b) Shows a comparison of the different tests and with respect to the effect of fixed amounts of modern carbon contamination shown by solid lines.
Table 1 Summary of the best background levels obtained using the sealed-tube method for the size range tested (see Figure 2 for overall variability). Also included for comparison are the background levels typically obtained using the routine method of graphitization (Slota et al. Reference Slota, Jull, Linick and Toolin1987). Graphites were prepared using CO2 splits of a large volume (∼1 L) produced from hydrolysis of Iceland Spar Calcite. Split sizes are expressed in milligrams of carbon.

During the course of our testing (which spanned several years) a few aspects of the method were changed. These included: (1) amount of Fe used, (2) dimensions of the tubes and (3) cleaning procedure. A couple of years ago, we were advised by our colleagues at the KCCAMS to increase the amount of Fe from 5 mg to 6–7 mg in order to achieve better performance of our graphites during the AMS measurements, on the grounds that more Fe helps to dispense the heat and improves C- currents when the AMS is routinely run at higher Cs source currents. Therefore, batch B039 was graphitized using 5 mg of Fe while all other batches shown in Figure 2 were graphitized using 6–7 mg of Fe. Comparing to B045, where test conditions differed from B039 only by the amount of Fe (see Figure 2a) would suggest a beneficial effect from using less Fe with this method (Figure 2a), perhaps related to impurities in the catalyst (99.5% purity), however there is not enough data to confirm this view. The second change was to the dimensions of the tubes, of both, the inner tube and the height of the sealed tube (the sealing height). The inner tubes that we used in earlier tests were 5 cm long (3 cm longer than currently used) and due to this and the indentation on the outer tube (Figure 1) placed at 4 cm from the bottom (rather than 2cm) on earlier tests, tubes were sealed at 13–14 cm height (also the initial length of the 9-mm OD tube was 18–19 cm vs current 15 cm). These rather long, tube dimensions were used for B039 and B045. Different dimensions (as shown in Figure 1) were used for the rest of the batches shown in Figure 2a (B047 through Batch 3), including a shorter sealing height. Various shorter sealing heights were also tested throughout these batches, as shown in Figure 2a. A reduction in the sealing height reduces the glass surface area and this is preferable to minimize background levels (less area available for adsorption of ambient CO2). There is also the benefit of a smaller reactor volume (resulting from reducing the sealing height), which is that it facilitates the graphitization reactions, an aspect particularly relevant for small samples (Xu et al. Reference Xu, Trumbore, Zheng, Southon, McDuffee, Luttgen and Liu2007). The third modification to the method was simple but potentially beneficial to achieve low background levels. This involves placing the inner tube containing Fe outside the long tube containing Zn and TiH2 during the cleaning of reagents at 300°C. This is easily done by placing the inner tubes in small ceramic cups or beakers, instead of inside the long tube. Once the cleaning is done, inner tubes can be carefully placed inside the long tube, handling them with tweezers. We did this in B047 and although there were only a few measurements, the trend clearly showed lower background values relative to other batches (e.g., B048) and the values compare rather well with background values obtained using our routine Zn method (Figure 2a). The only other batch that included this modification was batch 3 but as explained above, the cause for higher background levels in this batch was unclear. Placing the inner tubes containing Fe outside the long tube during the cleaning at 300°C allows for better circulation of hot air through both, the Fe and the combined Zn and TiH2 inside the long tube (as opposed to having the inner tube on top of these reagents acting as a barrier) thus resulting in better cleaning of all of the reagents. This is important specially in the case of using reagents with a fine particle size, like the type of Fe we use. While we did not test for the effect of this modification to the method extensively, it is likely beneficial (rather than detrimental), particularly for sample sizes below 0.5 mg C (Figure 2), while being an easy modification to incorporate requiring only careful handling of the 2 cm long inner tube with clean tweezers. Overall based on our tests, we suggest the use of shorter tube dimensions as shown in Figure 1, a sealing height of ∼7–8 cm and cleaning of reagents with the inner tube sitting outside the long tube. Alternatively, the inner tube could be made 3cm long for easier handling and the indentation on the outer tube could be placed 1 cm from the bottom to maintain a short sealing height. Xu et al. (Reference Xu, Trumbore, Zheng, Southon, McDuffee, Luttgen and Liu2007) obtained good results (background of ∼50,000 yr BP and precision of 0.2–0.3%) using longer tube dimensions and a longer sealing height (11 cm) to graphitize 1 mg C while relatively shorter tube dimensions (25 mm long inner tube with 3.7 mm OD), less amount of reagents and a sealing height of 10 cm worked well for graphitization of 0.1 mg C and smaller samples (Khosh et al. Reference Khosh, Xu and Trumbore2010). Since our goal is to graphitize samples over the entire size range of 0.1–1.0 mg C while keeping the same amount of reagents for convenience of operation, our choice of rather short tube dimensions and reduced sealing height for all sample sizes is beneficial and convenient.
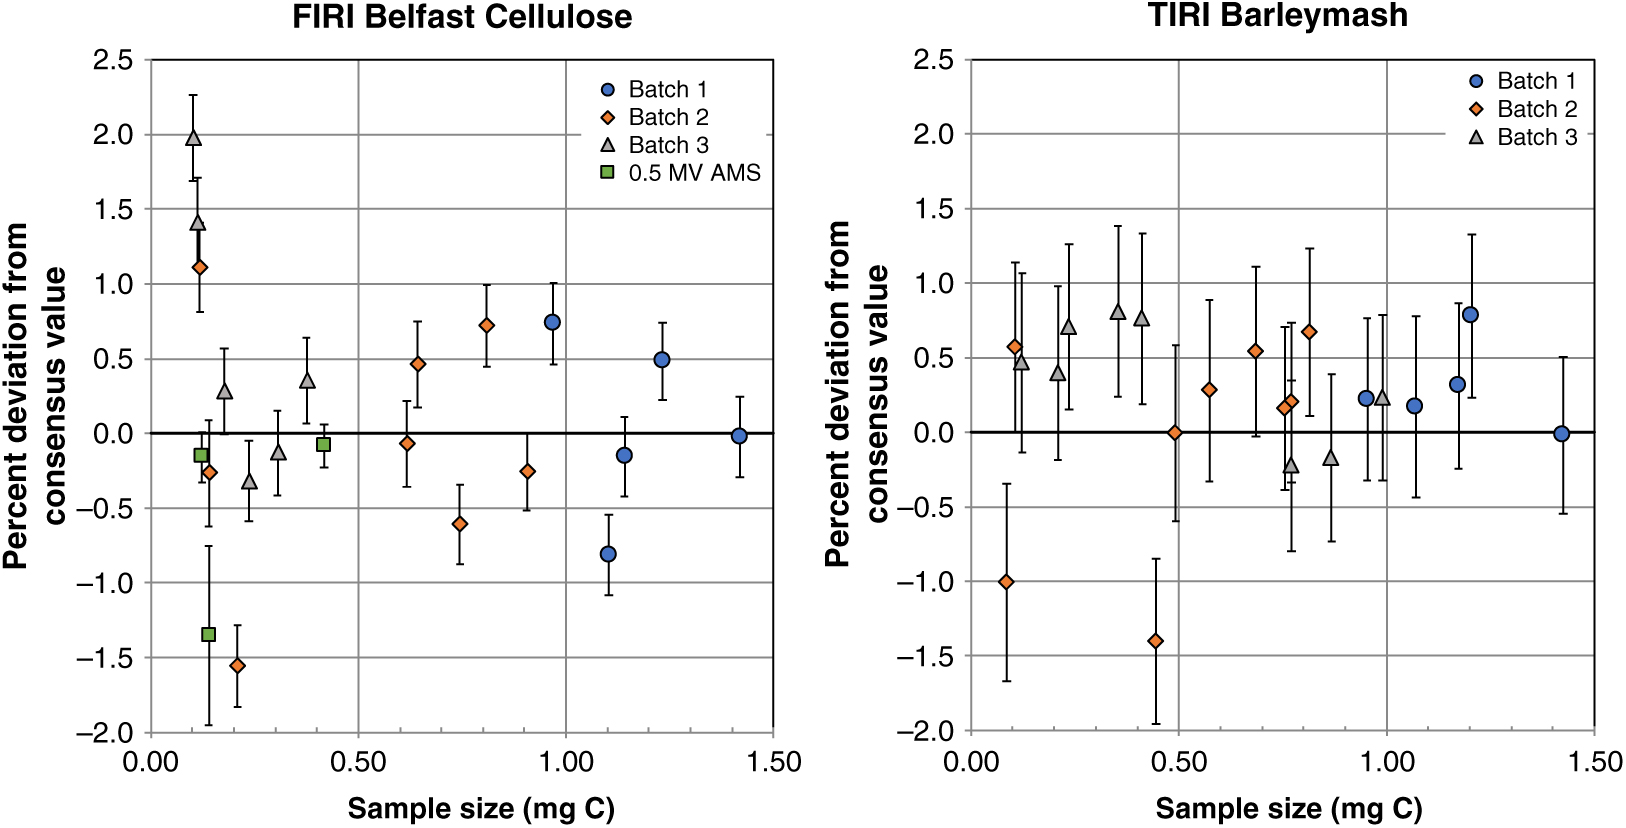
To evaluate the precision and accuracy that we could obtain using the sealed-tube method, we graphitized CO2 aliquots of the secondary standards BBM and BBC in the size range of ∼0.1–1.6 mg C. We considered the propagated uncertainties in the background-corrected FM values to be good indicators of precision. Expressed in percent, precision ranged between 0.3% and 0.6% over the sample size range evaluated, based on measurements performed on the 5MV AMS (n=48), which comprised most of the measurements of secondary standards carried out in this study (only 3 other measurements of BBC were performed on the 0.5MV AMS and these had a similar precision, between 0.1% and 0.6%). Relative to consensus values, most of the results were acceptable but, by contrast with relatively high background levels in batch 3, the biggest offsets in the FM values of BBC and BBM were observed in batch 2 and only for some of the sample sizes containing less than 0.5 mg C (Figure 3). Therefore, we tested this lower size range again in batch 3 and obtained better results (Figure 3). It is worth noting that the online δ13C values during the run in batch 2 were inconsistent for the mid-size range of ∼0.2–0.4 mg C as they were elevated relatively to other measurements in the same batch (Supplemental Figure 2). This could explain the low 14C values observed for those sizes (Figure 3) by over-correcting for isotopic fractionation (i.e. resulting in erroneously low 14C values). By contrast, online δ13C values during batches 1 and 3 were consistent throughout each of the runs and from each other (within error). Similarly, online δ13C values of BISC were consistent within the run for batches 1 and 3 and only inconsistent in batch 2 for a few of the biggest sizes (Supplemental Figure 2) with relatively more depleted values however the opposite effect on 14C values (under-correcting) was not apparent.

Figure 3 Fraction modern values of secondary standards FIRI Belfast Cellulose and TIRI Barleymash graphitized with the sealed-tube method. Solid lines indicate the respective consensus values. Graphites were measured on a 5MV AMS at SUERC, except for B039 and B040, which were measured on a 0.5 MV at UCI. CO2 splits were obtained from ∼2 mL volumes previously taken from a large volume (∼1 L) derived from the combustion of these standards. Error bars show 1σ propagated uncertainties.
Isotopic fractionation is expected with the sealed tube method by approximately 3 permil for the amount of reagents used in this study and for a sample size of 1 mg of carbon (Xu et al. Reference Xu, Trumbore, Zheng, Southon, McDuffee, Luttgen and Liu2007). Accordingly, relatively higher fractionation would be expected for sample sizes < 1 mg C using the same amount of reagents as the ratio of the amount of either reagent to mg of C increases (Xu et al. Reference Xu, Trumbore, Zheng, Southon, McDuffee, Luttgen and Liu2007), however this is not the case in batch 2 with only a subset of sample sizes <0.5 mg C affected by an apparent higher isotopic fractionation and all measurements within batch 3 showing consistent online δ13C values throughout the run for similar sizes. Online δ13C values measured on the AMS also reflect any fractionation that occurred during the measurement itself and perhaps changing conditions in the accelerator can explain unexpected offsets. As far as amount of reagents, these were kept the same for all measurements and thus we can concur with Xu et al. (Reference Xu, Trumbore, Zheng, Southon, McDuffee, Luttgen and Liu2007) that samples as smaller as 0.1 mg C can be successfully graphitized with the amount of reagents as tested in this study and 14C results can be corrected for isotopic fractionation using online δ13C measurements as long as these are precise and consistent throughout a given run. It is evident from our tests that precise online δ13C measurements (measured on the AMS) must be attained (some dependence on sample size can be expected) to avoid erroneous 14C results. Consequently, online δ13C values in batch 2 that were inconsistent with values in batches 1 and 3 (as indicated in Supplemental Figure 2), were not used for corrections and the corresponding 14C values were excluded from further calculations of accuracy. The thresholds of acceptable online δ13C values for BBC and BBM were based on the observed scatter in all 3 batches and might change as more data is acquired in the future.
Based on measurements of BBC and BBM, accuracy was estimated as the percent deviation of the background-corrected FM values from consensus values ([(FMmeasured – FM consensus)/FM consensus]*100). Accuracy over the sample size range tested was mostly within 1% but greater variability (up to 2%) was observed for sample sizes containing ∼0.1 mg C or less (Figure 4). Therefore, our tests showed that for sample sizes containing ∼0.1–1.0 mg C and above, most of which represent the sample sizes routinely processed at the NERC Radiocarbon Facility, sealed-tube graphitization produces graphite targets that perform well on the AMS and yield background levels equal to or better than those produced with our routine Zn graphitization, and are also with good precision and accuracy.

Figure 4 Percent deviation from consensus values of secondary standards FIRI Belfast Cellulose and TIRI Barleymash graphitized with the sealed-tube method. Some measurements in batch 2 were excluded from this calculation based on their online δ13C values (see text and Supplemental Figure 2). Graphites were measured on a 5MV AMS at SUERC (Batch 1–3) and on a 0.5MV AMS at UCI (as shown). Sample sizes were obtained as CO2 splits from ∼2 mL volumes previously taken from a large volume (∼1 L) derived from the combustion of these standards. Error bars show 1σ propagated uncertainties.
CONCLUSIONS AND RECOMMENDATIONS
We tested sealed-tube graphitization on sample sizes ranging from ∼0.1 mg C to 1 mg C, a graphitization method that has been successfully developed by Xu et al. (Reference Xu, Trumbore, Zheng, Southon, McDuffee, Luttgen and Liu2007). Background levels were comparable to those obtained using our routine graphitization over Zn (Slota et al. Reference Slota, Jull, Linick and Toolin1987), ranging from >57,000 ± 1000 yr BP for the larger samples to 41,230 ± 430 yr BP for the smallest size, however higher and variable backgrounds were sometimes obtained for samples smaller than 0.5 mg C and this requires further investigation. Accuracy was acceptable, within 1% as evaluated using the secondary standards FIRI Belfast Cellulose and TIRI Barleymash, although similar to Iceland Spar Calcite, greater variability and offset (up to 2% error) was observed for smaller sample sizes (∼0.1 mg C). Inconsistent online δ13C values during one batch of measurements caused erroneous 14C values. While we followed the protocol by Xu et al. (Reference Xu, Trumbore, Zheng, Southon, McDuffee, Luttgen and Liu2007), we observed better results in our laboratory by incorporating the following modifications: (1) a shorter inner tube, only 2 cm length or alternatively, a combination of lower indentation on the outer tube to 1 cm from the bottom (Figure 1) and a 3-cm-long inner tube for easier handling, (2) sealing at a length of 7–8 cm (∼4 cm shorter than in the original method) and (3) keeping the tube with Fe outside the long tube during the cleaning of reagents at 300°C.
Acknowledgments
We thank Christopher Taylor for technical support and Josanne Newton for assistance with data reduction. This work was supported by the NERC Radiocarbon Facility NRCF010001.
Supplementary material
For supplementary material/s referred to in this article, please visit https://doi.org/10.1017/RDC.2019.102