


INTRODUCTION
The radiocarbon freshwater reservoir effect (FRE) is the difference between the age of the freshwater carbon reservoirs and the age of atmospheric or terrestrial carbon reservoirs (Ascough et al. Reference Ascough, Cook, Church, Dunbar, Einarsson, McGovern, Gugmore, Perdikaris, Hastie, Fridriksson and Gestsdottir2010). The FRE was first described in 1949 by J Iversen in a private communication (Oana and Deevey Reference Oana and Deevey1960). Aquatic plants were the first samples used to measure the FRE, in 1951 by Godwin (Oana and Deevey Reference Oana and Deevey1960) and in 1954 by Deevey et al. (Reference Deevey, Gross, Hutchinson and Kraybill1954). Later, FRE was mainly studied in aquatic plants and animals (Broecker and Walton Reference Broecker and Walton1959). In the last decade, under the leadership of archaeologists, scientists started to study the FRE in order to apply corrections on 14C dates measured in prehistoric sites. This effect leads to aging of the 14C dates of bone collagen of freshwater fish consumers but is also recorded in nonhuman materials (e.g. ceramic or pottery food crusts, wild or domestic animal remains, terrestrial/aquatic shells, sediments) (Cook et al. Reference Cook, Bonsall, Hedges, McSweeney, Boroneant and Pettitt2001; Bonsall et al. Reference Bonsall, Cook, Hedges, Higham, Pickard and Radovanovic2004; Shishlina et al. Reference Shishlina, van der Plicht, Hedges, Zazovskaya, Sevastyanov and Chichagova2007; Boudin et al. Reference Boudin, Van Strydonck and Crombé2009; Van Strydonck et al. Reference Van Strydonck, Ervynck, Vandenbruaene and Boudin2009; Higham et al. Reference Higham, Warren, Belinskij, Härke and Wood2010; Hollund et al. Reference Hollund, Higham, Belinskij and Korenevskij2010; Olsen et al. Reference Olsen, Heinemeier, Lübke, Lüth and Terberger2010; Philippsen et al. Reference Philippsen, Kjeldsen, Hartz, Paulsen, Clausen and Heinemeier2010; Keaveney and Reimer Reference Keaveney and Reimer2012; Hart et al. Reference Hart, Lovis, Urquhart and Reber2013).
Previous studies have shown that the FRE varies between a few and several thousand years. For instance, the FRE is estimated between 400 and 5000 14C yr in Lake Mývatn (Iceland) (Ascough et al. Reference Ascough, Cook, Church, Dunbar, Einarsson, McGovern, Gugmore, Perdikaris, Hastie, Fridriksson and Gestsdottir2010) or several tens of thousands of years in Mammoth Mountain waters (California, USA) (Sorey et al. Reference Sorey, Evans, Kennedy, Farrar, Hainsworth and Hausback1998), attributed largely to geothermal mechanisms. An FRE of 18,000 14C yr was also reported in the Dry Valleys of Antarctica and attributed to an input of ancient glacial meltwater (Hall and Henderson Reference Hall and Henderson2001), and in the waters of Waddi Akarit (Tunisia) fed by Saharan fossil water tables (Fontes and Gasse Reference Fontes and Gasse1991). The FRE is highly variable within a lake or a river and very difficult to estimate because of its multiple origins (Fontugne et al. Reference Fontugne, Guichard, Bentaleb, Strechie and Lericolais2009; Ascough et al. Reference Ascough, Cook, Church, Dunbar, Einarsson, McGovern, Gugmore, Perdikaris, Hastie, Fridriksson and Gestsdottir2010; Philippsen et al. Reference Philippsen, Kjeldsen, Hartz, Paulsen, Clausen and Heinemeier2010; Philippsen Reference Philippsen2012, Reference Philippsen2013; Philippsen and Heinemeier Reference Philippsen and Heinemeier2013).
The FRE results from complex processes involved in dissolved inorganic carbon (DIC) cycling in river systems. These processes involve mainly the chemical weathering of geological 14C-free carbonates and silicate, leading to the so-called hardwater effect (Deevey et al. Reference Deevey, Gross, Hutchinson and Kraybill1954). The decomposition of other rocks such as volcanic glasses and geothermal CO2 can also cause significant aging in DIC in groundwaters (Sveinbjörnsdóttir et al. Reference Sveinbjörnsdóttir, Heinemeier and Arnorsson1995) and in mineral water sources (Boineau and Maisonneuve Reference Boineau and Maisonneuve1971; Sorey et al. Reference Sorey, Evans, Kennedy, Farrar, Hainsworth and Hausback1998). Atmospheric CO2 also exchanges with DIC, reducing the FRE in well-ventilated rivers. Finally, synthesis and decomposition processes of organic matter in rivers contribute to FRE variations since organic carbon records partly the seasonal variability of the 14C concentration in DIC (Buhl et al. Reference Buhl, Neuser, Richter, Riedel, Roberts, Strauss and Veizer1991; Aucour et al. Reference Aucour, Sheppard, Guyomar and Wattelet1999). A better understanding of these variations will lead to better description of the FRE evolution.
In this study, we investigated the spatial and temporal variability of the FRE in the largest French river, the Loire, and its main tributaries in 2004, 2005, 2013, and 2014. Through measurements of 14C ages and DIC δ13C combined with physico-chemical parameters, we tried to assess the main factors controlling these ages on a spatial and temporal basis.
STUDY AREA
Study Site
The Loire is the largest French river with a length of 1010 km and major inputs (carbon, nutrients, and flow rate) to the northeastern Atlantic Ocean with a water discharge of 26 km3/yr (Figueres et al. Reference Figueres, Martin, Meybeck and Seyler1985). The Loire River system drains a 117,800 km² basin, which represents 20% of the surface area of France (Abonyi et al. Reference Abonyi, Leitão, Lançon and Padisák2012; Figure 1). From its source in the Southern Massif Central, the Loire flows through agricultural regions to the Atlantic Ocean (Minaudo et al. Reference Minaudo, Moatar, Meybeck, Curie, Gassama and Leitao2013). The left bank tributaries studied here are the Allier (A), Cher (C), Indre (I), and Vienne (V) rivers. The Maine (M) River, formed by the confluence of the Mayenne (Ma), Sarthe (S), and Loir (Lo) rivers, is the only tributary studied on the right bank. These tributaries were chosen based on their differences in geological settings, land use, and flow rate.
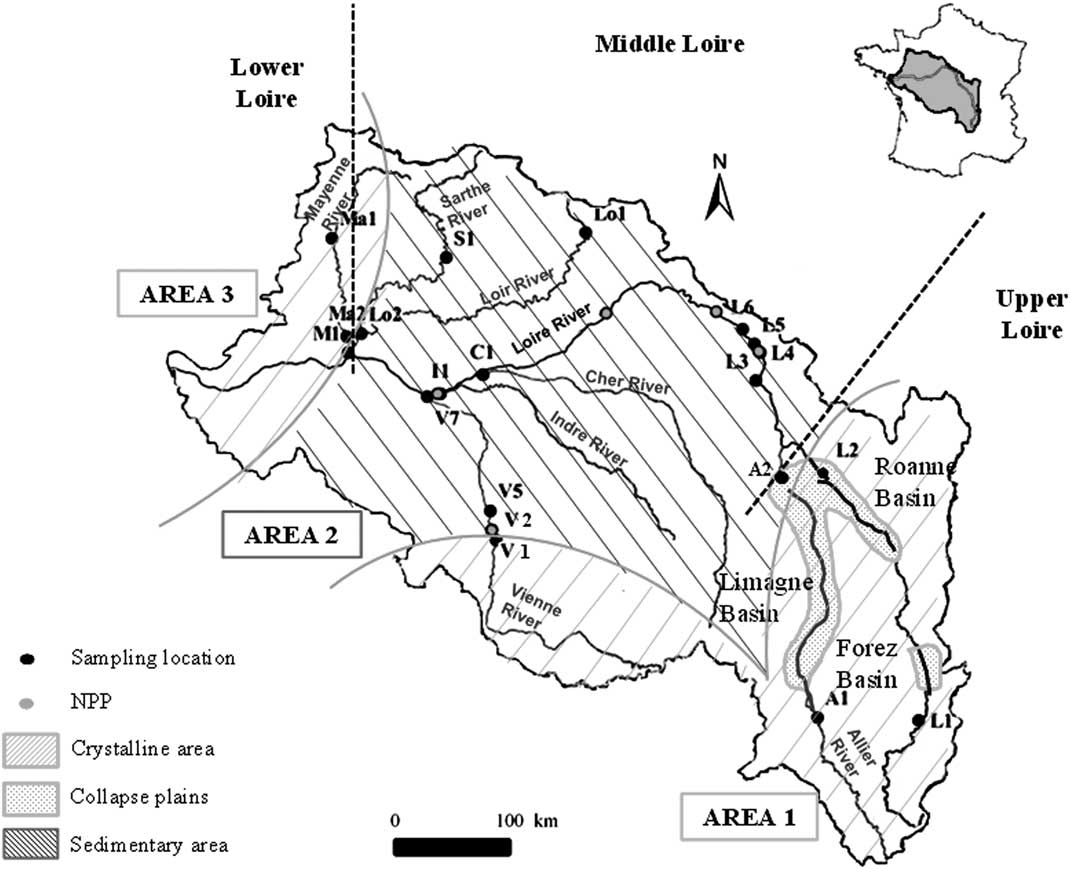
Figure 1 Loire River Basin. The upper part of the Loire River is upstream of the confluence of the Allier and Vienne rivers. The middle part of the Loire River is between the confluence of the Allier and Loire rivers and the confluence of the Maine and Loire rivers. The lower part of the Loire River is downstream the confluence of the Maine and Loire rivers. Sampling sites and nuclear power plants (NPP) are represented by black and red points, respectively (online version of the article). Three areas are identified: Area 1 and 3 are crystalline regions (striped orange zone) and Area 2 is a region with carbonaceous sediments (striped blue zone). The dotted region represents the carbonated collapse plain between the Limagne Plain, the Roanne Basin, and the Forez Basin.
The Loire Basin drains three areas that are significantly different in geological substrate (Figure 1; Mansy et al. Reference Mansy, Guennoc, Robaszynski, Amédro, Auffret, Vidier, Lamarche, Lefevre, Somme, Brice, Mistiaen, Prud’Homme, Rohart and Vachard2008). In Area 1, to the west, the upper segment of the Vienne River drains the Limousin granite formation and goes towards 46°30′N, in the Jurassic limestone of the Paris Basin. South of 45°30′N, the Upper Loire and Allier rivers drain the Hercynian crystalline formation of the Massif Central, which has been characterized since the Miocene period by significant volcanic activity.
Area 2 consists of the Jurassic to Miocene sedimentary formation of the Paris Basin. These sediments are mostly limestone and constitute the substrate of the Loir, Sarthe, lower Vienne, Indre, Cher, and middle Loire riverbeds. The upstream parts of the Loire and Allier rivers enter the Forez and Limagne collapse plains, respectively. These faulted basins covered by eolian Quaternary deposits (loess) are well known for their hydrothermal activities and numerous mineral springs.
Area 3 is the eastern edge of the Massif Armoricain Paleozoic formation, which is composed of granitic and metamorphic (gneiss or schist) rocks. Nevertheless, some fractures may be filled by carbonate deposits as is the case for the Changé formation in the upper course of the Mayenne River (Aertgeerts et al. Reference Aertgeerts, Béchennec, Conil, Régnault, Mary, Papillard, Pivette, Redois and Viaud2011a).
The Loire River and its five tributaries are situated in the central part of France where the climate is temperate. The annual mean temperature in the Loire Basin is 11°C. The rivers are supplied either by groundwater and/or precipitation, and melting snows during the spring only in the upper course of the Allier and Loire rivers. The altitude along the Loire River is from 1408 m near the source to 0 m above sea level (asl) at the estuary (Grosbois Reference Grosbois1998).
Sampling Sites
In this study, 20 sampling sites were selected in the Loire Basin (Table 1, Figure 1). They cover a wide range of geological substrates and agricultural practices. Six sampling sites are situated in the headwater and in the beginning of the middle part of the Loire River from Aurec-sur-Loire (L1) to Briare (L6). Several nuclear power plants are located on the Loire and Vienne rivers, and can potentially release liquids containing 14C in DIC form and tritium, mainly (Siclet et al. Reference Siclet, Guesmia, Ciffroy, Reyss, Fontugne, Lepetit, Jean-Baptiste and Drouadaine2002). Tritium is commonly used as a tracer for these releases and was measured in this study to identify a potential release. These values were indeed closely related to the periods of releases communicated by the energy industry. Two sites presented in this study (L5 and L6) were located downstream of a nuclear power plant. The samples used in this study were strictly selected during nonrelease periods. In previous studies, no memory effect was observed after a release (Fontugne et al. Reference Fontugne, Abril, Bacon, Baumier, Commarieu, Connan, Etcheber, Germain, Hébert, Jean-Baptiste, Lozay, Maro, Olivier, Paterne, Podevin, Poirier, Rozet and Tenailleau2007).
Table 1 Sampling sites location on the Loire River Basin. Kilometric Point 0 is situated at Saint Nazaire near the estuary (47°16′04″N; 2°11′08″W).

A few sites are located on noncarbonaceous bedrock. In Area 1, two sites (L1 and A1) are located in the crystalline formation. Lussac (V1) is located at the boundary between Area 1 and 2. At this location, the Vienne River flows out from the Limousin crystalline formation and does not reach the Lias and Jurassic limestone formations situated in the northeastern part of the plateau. Similarly, Decize (L2) is located at the junction of a crystalline and a sedimentary formation and Loire River waters come out of a sandy clay zone north of the Roanne Basin before running on Jurassic limestones. All the other sites are in the carbonate sedimentary context of Area 2, except for sites Ma1 and Ma2, which are partially in the metamorphic context (shale) of Area 3 (Aertgeerts et al. Reference Aertgeerts, Béchennec, Conil, Régnault, Mary, Papillard, Pivette, Redois and Viaud2011a). Sites L2 (Area 1) and A2 (Area 2) are in the collapse basins. Site C1 is on the Cher River at Savonnières near the Mesozoic carbonate petrified caves (Couderc Reference Couderc1968). Site M1 at Bouchemaine on the Maine River reflects the mixing of its different tributaries: the Mayenne (Ma1, Ma2), Sarthe (S1, Aertgeerts et al. Reference Aertgeerts, Béchennec, Conil, Régnault, Mary, Papillard, Pivette, Redois and Viaud2011b), and Loir (Lo1, Lo2) rivers. Four sampling sites are distributed on the Vienne River: V1 at the limit of the granitic area and V2, V5, V7 in a carbonate complex area, downstream from a nuclear power plant (SAGE 2006).
For this study, four sampling campaigns were conducted in April, July, and October 2013 and March 2014. According to hydrological and meteorological conditions, the July and October 2013 sampling represented summer conditions while April 2013 and March 2014 represented winter/early spring conditions. All sites were sampled during these campaigns, except V2 (upstream Civaux) that was sampled only in July and October 2013 and upstream sites of the Loire and tributaries (L1, A1, Ma1, S1, and Lo1) that were sampled in March 2014. We also used unpublished data from three other campaigns conducted in September 2004, May 2005, and November 2005 in which the sampling sites were located in the middle Loire River and the samples were collected on the riverbank (Fontugne et al. Reference Fontugne, Abril, Bacon, Baumier, Commarieu, Connan, Etcheber, Germain, Hébert, Jean-Baptiste, Lozay, Maro, Olivier, Paterne, Podevin, Poirier, Rozet and Tenailleau2007; Marang et al. Reference Marang, Siclet, Luck, Maro, Tenailleau, Jean-Baptiste, Fourré and Fontugne2011).
METHODS
In this study, surface water samples were collected from bridges in the main water flow on the Loire River and its tributaries. They were taken from 0–0.5 m depth using a bucket (Garnier et al. Reference Garnier, Servais, Billen, Akopian and Brion2001; Sato et al. Reference Sato, Miyajima, Ogawa, Umezawa and Koike2006).
For chlorophyll-a (hereafter chl-a) analysis, water was immediately filtered using a precombusted (450°C) Whatman glass fiber filter (GF/F, 0.7-µm pore diameter). The filter was stored at –80°C in aluminum foil to prevent light degradation until analysis, around 1 week later. Chl-a was then analyzed by spectrofluorimetry according to Neveux and Lantoine (Reference Neveux and Lantoine1993) at the Station Marine d’Arcachon (University of Bordeaux I).
For alkalinity analysis, water was immediately filtered using a precombusted (450°C), 47-mm-diameter Whatman quartz fiber filter (QM/A, 2.2-µm pore diameter) and stored at 4°C until analysis. The analysis was performed within 1 week by potentiometric titration with HCl 0.01N, using the Gran method. We expressed the results in meq/L assuming that alkalinity is mainly represented by bicarbonates and carbonates. The precision was around 5%.
For the DIC concentration and δ13C and 14C analysis, water samples were transferred to precleaned (TBF4, 10% HCl, pure water) and combusted (450°C, overnight) 250-mL borosilicate ground neck bottles and poisoned with 1 mL of a saturated solution of mercury (II) chloride (Leboucher et al. Reference Leboucher, Orr, Jean-Baptiste, Arnold, Monfray, Tisnerat-Laborde, Poisson and Duplessy1999). The borosilicate bottles were then sealed with greased ground glass stoppers (Apiezon H).
In the laboratory, 80 to 200 mL of water sample and 2 mL of 85% H3PO4 were introduced in a glass reactor in a vacuum line for the extraction of DIC as free CO2 (Leboucher et al. Reference Leboucher, Orr, Jean-Baptiste, Arnold, Monfray, Tisnerat-Laborde, Poisson and Duplessy1999). The sample was purged using ultra-high-purity (6.0) helium gas. The CO2 was dried by passing through two water traps (ethanol/dry ice) before being trapped in a liquid nitrogen trap. Then, the CO2 was manometrically quantified in a calibrated volume and separated in 2 aliquots: one for 14C measurement and the other for stable carbon isotope measurement. δ13C values were determined at LSCE using a dual-inlet VG-Optima isotopic ratio mass spectrometer (typical precision below 0.08‰). The DIC concentration was calculated from the amount of carbon extracted and the volume of extracted water and expressed in mgC/L with a precision of 1%.
14C measurements were performed with the Artemis accelerator mass spectrometry (AMS) facility at the Laboratoire de Mesure du Carbone 14 in Saclay (France). Prior to measurement, the evolved CO2 was converted to graphite (Cottereau et al. Reference Cottereau, Arnold, Moreau, Baqué, Bavay, Caffy, Comby, Dumoulin, Hain, Perron, Salomon and Setti2007). The 14C activities are reported in fraction modern (F14C) and 14C age (Stuiver and Polach Reference Stuiver and Polach1977; Reimer et al. Reference Reimer, Baillie, Bard, Bayliss, Beck, Bertrand, Blackwell, Buck, Burr, Cutler, Damon, Edwards, Fairbanks, Friedrich, Guilderson, Hogg, Hughen, Kromer, McCormac, Manning, Bronk Ramsey, Reimer, Remmele, Southon, Stuiver, Talamo, Taylor, van der Plicht and Weyhenmeyer2004). All 14C values were corrected from the delay between sampling and measurement years and background subtraction. The total uncertainty for the 14C activity values was±0.003 F14C, corresponding to an age of ±30 yr. According to the definition, the FRE was calculated as follows:
 $${\rm FRE}{\equals}-8033^{\asterisk}{\rm ln}\left( {{\rm F}^{{14}} {\rm C}_{{\rm S}} \,/\,{\rm F}^{{14}} {\rm C}_{{\rm A}} } \right)$$
where F14CS and F14CA are the sample modern fraction and the atmospheric sample modern fraction, respectively (Keaveney and Reimer Reference Keaveney and Reimer2012). We used the conventional values of Levin et al. (Reference Levin, Kromer and Hammer2013) and unpublished data (Samuel Hammer and Ingeborg Levin, personal communication, 2015) for the atmospheric sample age. We calculated the mean annual value of the atmosphere activity in 2004, 2005, 2013, and 2014 and obtained F14C values of 1.0674, 1.0644, 1.0284, and 1.0258, respectively.
River Discharge
River discharge data of the Loire River were taken from the national BanqueHydro database (http://www.hydro.eaufrance.fr). Data collected between 2004 and 2014 were used to estimate the mean discharge at each sampling site for this period. We then calculated the mean discharge percentage according to the following equation to evaluate the streamflow river states in flood or low water:
 $${\rm \,\%\,}\,{\rm of}\,{\rm mean}\,{\rm discharge{\equals}}{{{\rm Discharge}} \over {{\rm Mean}\,{\rm discharge}}}{\asterisk}100$$
RESULTS AND DISCUSSION
River discharge, chlorophyll-a concentration, alkalinity, DIC concentration, DIC δ13C, 14C activity, and reservoir age are reported in Table 2. Unpublished values obtained during the 2004 and 2005 LORA experiments (Fontugne et al. Reference Fontugne, Abril, Bacon, Baumier, Commarieu, Connan, Etcheber, Germain, Hébert, Jean-Baptiste, Lozay, Maro, Olivier, Paterne, Podevin, Poirier, Rozet and Tenailleau2007) are also reported in italics in Table 2. Some reservoir age values are missing because sampling sites were under the influence of a nuclear power plant release or because the measurement failed.
Table 2 River discharge (data from www.hydro.eaufrance.fr), chlorophyll-a concentration, alkalinity, DIC concentration, DIC δ13C, 14C activity and reservoir age for the 20 sampling sites in the Loire River Basin. Sampling year and month are specified after the location name. Unpublished values obtained during the 2004 and 2005 LORA experiments (Fontugne et al. Reference Fontugne, Abril, Bacon, Baumier, Commarieu, Connan, Etcheber, Germain, Hébert, Jean-Baptiste, Lozay, Maro, Olivier, Paterne, Podevin, Poirier, Rozet and Tenailleau2007) are reported in italic (nd=not determined).
Chlorophyll-a
Chl-a concentrations showed large variations ranging between 0.4 and 152.8 µg/L in the Loire River Basin. The highest concentrations (>44 µg/L) were recorded in the Maine Basin (M1 and tributaries) in the early spring (March 2013 and April 2014) and are likely associated with spring phytoplankton blooms when the optimal sunlight conditions trigger an intense photosynthetic activity. This high chl-a concentration can also be explained by the water composition of the Maine River’s tributaries, which drain large areas of cereal crops involving fertilizers that may promote an even higher rate of aquatic photosynthesis. Low values (below 10 µg/L) were observed in wine-growing zones and cattle-breeding areas, in the upper and the beginning of the middle Loire as well as in the Allier, Indre, Cher, and Vienne tributaries. This low chl-a concentration is consistent with previous studies (Aleya et al. Reference Aleya, Desmolles, Michard, Bonnet and Devaux1994; Jugnia et al. Reference Jugnia, Debroas, Romagoux and Dévaux2004) that indicated eutrophic water in headwater due to the nature of the phytoplankton assemblage (lake-like) that does not survive in the turbulent and quite turbid river (Abonyi et al. Reference Abonyi, Leitão, Lançon and Padisák2012, Reference Abonyi, Leitão, Stankovic, Borics, Varbiro and Padisák2014). A few high values between 22.0 and 37.9 µg/L were observed in these rivers occurring typically at the beginning of spring and summer. In the Loire River, higher chl-a concentration mean values (16.8 µg/L) were observed in spring and summer 2004–2005 than during the four campaigns in 2013–2014 (10.4 µg/L). These results are consistent with the study by Minaudo et al. (Reference Minaudo, Meybeck, Moatar, Gassama and Curie2015) that showed the decline of chl-a concentration over the last decade mainly due to the continuous decline of phosphate concentrations.
Alkalinity and DIC Concentration
Alkalinity and DIC concentration values varied from 0.6 to 7.7 meq/L and from 2.0 to 56.6 mgC/L, respectively, and were highly correlated (r=0.92; n=49; p<0.05). The alkalinity was higher in sedimentary limestone areas than in crystalline areas, suggesting that chemical weathering of carbonates and silicates is the main process influencing alkalinity in the Loire Basin. This seems to indicate the low contribution of atmospheric CO2 and river exchange. The highest DIC concentrations measured in the Cher and Indre rivers are not surprising due to the presence of petrifying springs in the basin. High concentrations of DIC were also observed in the Loir. This area is mostly composed of arable land. An extensive drainage in the river catchment can be created by intensive agricultural practices, which could imply a significant increase in the export of DIC as observed by Barnes and Raymond (Reference Barnes and Raymond2009).
The lowest DIC concentrations and alkalinities were observed upstream of the other rivers (except the Mayenne River because of a carbonate inclusion upstream) due to their localization in the crystalline area (Areas 1 and 3).
DIC δ13C
These first data of DIC δ13C in the Loire Basin present high temporal and spatial variations ranging from –7.66‰ to –13.61‰ with one low value of –16±1‰ in Savonnières (C1) in April 2013 and the highest DIC δ13C value of –7.57‰ at Le Veurdre (A2) in March 2014. This variability is wide no matter the geological substrate. However, our DIC δ13C values are consistent with the results of studies conducted on other French rivers such as the study by Buhl et al. (Reference Buhl, Neuser, Richter, Riedel, Roberts, Strauss and Veizer1991) on the Rhine (–10.7‰<DIC δ13C <–4.4‰), the study by Aucour et al. (Reference Aucour, Sheppard, Guyomar and Wattelet1999) on the Rhône River (–11.3‰<DIC δ13C<–4.1‰), and the study by Amiotte-Suchet et al. (Reference Amiotte-Suchet, Aubert, Probst, Gauthier-Lafaye, Probst, Andreux and Viville1999) on the Strengbach River (–24.4‰<DIC δ13C<–9.3‰). Our seasonal variation analyses of DIC δ13C indicate an amplitude variation of about 5‰ with a trend toward lower values in late summer. This trend is consistent with a higher contribution in late summer from the decomposition of soil organic matter compared to a higher contribution of carbonate weathering during the spring. As the carbon isotopic composition of DIC in freshwater is controlled by different processes such as carbon exchanges with the atmosphere, CO2 degassing in volcanic areas, dissolution of carbonate from the geological substrate, decay of organic matter in continental soils or in phytoplanktonic production, no direct relation could be established. Other proxies and parameters are needed to discriminate between these processes.
Reservoir Ages
The reservoir age values were highly variable across the Loire Basin, ranging between 135 and 2251 14C yr. The FRE did not exceed 667 14C yr in Areas 1 and 3, except at Ma1 (1496 14C yr). In Area 2, higher FRE (>690 14C yr) was recorded (Figure 2), ranging from 690 and 2251 14C yr, except upstream of the Vienne (V1 and V2).
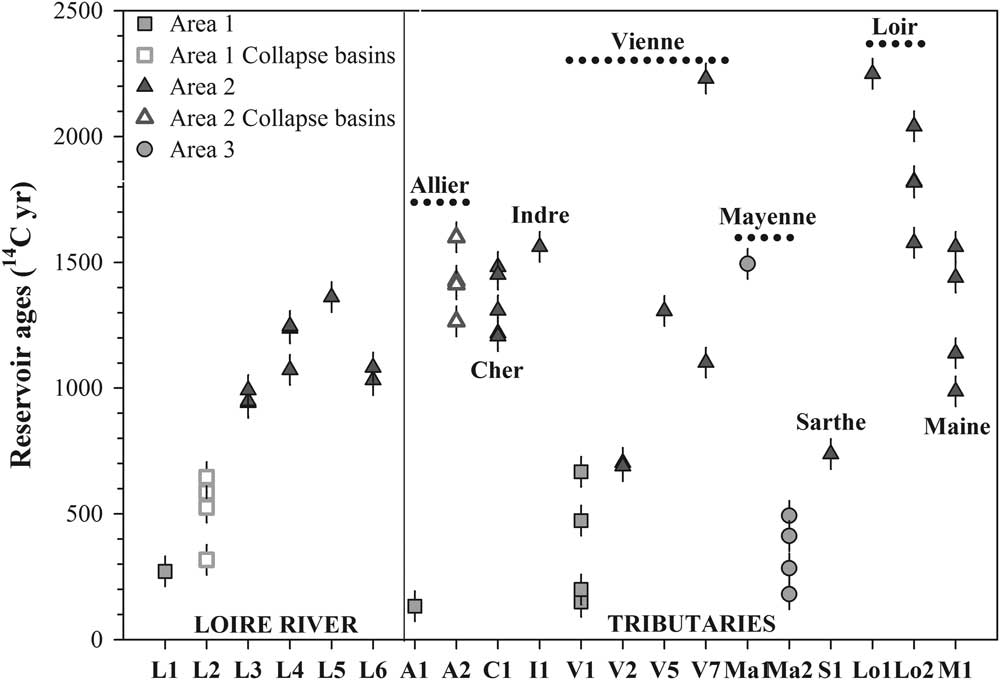
Figure 2 Reservoir ages evolution during the four campaigns from upstream to downstream for the Loire (L), Allier (A), Cher (C), Indre (I), Vienne (V), Mayenne (Ma), Sarthe (S), Loir (Lo) and Maine (M) Rivers. The orange markers correspond to sites in Areas 1 and 3, the blue markers to the sites in Area 2 (online color version). The error is expressed at 2σ.
Spatial Variability
The DIC concentrations, alkalinity, and stable carbon isotope ratios combined with the geological substrate can be used to explain the difference in FRE values between the sedimentary Area 2, mainly composed of limestone containing old calcium carbonate, and the two different crystalline Areas 1 and 3 as well as the exceptional data.
Higher FRE offsets in Area 2 are consistent both with high alkalinity values (and DIC content) as indicated by the good correlation (r=0.61; n=49; p<0.05) obtained between FRE and these parameters, shown in Figure 3.

Figure 3 Reservoir ages and alkalinity correlation
Limestone dissolution seems to be the main process that controls DIC in the Area 2 rivers. The fact that the highest reservoir age was recorded in the Loire River corroborates the assertion that limestone dissolution is the main process controlling DIC in these waters. Indeed, the Loire River crosses the limestone area of the Beauce Plateau where agricultural practices promote extensive drainage as shown by the high values of chl-a concentrations observed related to the heavy runoff of fertilizers (Barnes and Raymond Reference Barnes and Raymond2009). This drainage also results in high carbonate dissolution.
High FRE offsets, well correlated with alkalinity and DIC concentration, were also observed in crystalline areas, e.g. at L2, Ma1, S1, V1, and V2 (Figure 2). At these five sites, the results can be explained by more precise geological information. At L2, the Loire crosses the Forez and Roanne basins. The collapse basins are rich in carbonates even if the basement is plutonic (Derruau Reference Derruau1949; Boineau and Maisonneuve Reference Boineau and Maisonneuve1971; Cochet and Belkessa Reference Cochet and Belkessa1972; Landry Reference Landry1988; Négrel et al. Reference Négrel, Petelet-Giraud, Barbier and Gautier2003; Rivé et al. Reference Rivé, Rad and Assayag2013). The high FRE offsets observed (mean of 519 14C yr) could be the result of two processes: the percolation of groundwater through the marl faulted substrate or volcanic CO2 degassing well known in this region of the Massif Central (Anonymous 1997), or both. At Le Veurdre (A2) on the Allier River located also in the collapse basins, the DIC δ13C values, from –7.5 to –9.5‰ (Table 2), are the least depleted values recorded in the Loire Basin and its tributaries, suggesting a potentially higher contribution of volcanic CO2 with DIC δ13C values around –6‰ (Assayag Reference Assayag2006). At Changé (Ma1) in Area 3, a high FRE was observed due to the presence of carbonates that permeate the sedimentary matrix and are dissolved in the outcrop (Aertgeerts et al. Reference Aertgeerts, Béchennec, Conil, Régnault, Mary, Papillard, Pivette, Redois and Viaud2011a). At S1, the FRE was lower (740 14C yr) than at other sampling sites in Area 2 because the S1 station is situated at the exit of a schist area poor in carbonates (Aertgeerts et al. Reference Aertgeerts, Béchennec, Conil, Régnault, Mary, Papillard, Pivette, Redois and Viaud2011b). Finally, upstream of the Vienne (V1 and V2), the Vienne River starts running through Area 2 at V1, explaining the still young reservoir age at V1 and the increase in age along the Vienne River. Spatial changes in FRE values depend mainly on the geological substrate and agricultural practices. Indeed, we observed a systematic increase in FRE values between upstream and downstream of the sedimentary area due to the increase in the dissolution of carbonate and silicate along the river. This increase can be very pronounced within a few kilometers, as on the Vienne River, where the FRE values increased from 200 yr at V1 to more than 1300 yr (V5) in only 20 km (SAGE 2006).
This rapid increase in FRE values may not be related to the dissolution of substrate alone and cannot also be attributed to organic inputs. Fast changes are often due to a mixing of different waters with different 14C signatures. Currently, the rapid changes in river characteristics are related to the arrival of new sources of water with different properties. These changes in the characteristics and 14C signature of water were observed on the Maine River, which is at the confluence of the Mayenne, Sarthe, and Loir rivers. The waters of these three tributaries have different signatures (FRE, DIC content, and alkalinity values), and the Maine River values vary between these three sources depending on their relative contributions. If we apply a simple mass balance equation of two source water masses for the Vienne River, it seems that between site V1 and V5, the arrival of 14C-depleted underground water can explain this rapid aging of FRE. Further investigations are necessary to validate this hypothesis, however.
Temporal Variability
Temporal variability over 1 yr and four campaigns was obtained at each sampling point, except in the middle course of the Loire River (L3 to L6). The observed variability is high, ranging from 257 yr at Savonnières upstream of the Cher River (C1) to 575 yr at Bouchemaine on the Maine River (M1), except on the middle Loire (L3, L4, L6). In this area, the temporal variation of the FRE ranges from 50 to 165 yr, but is not statistically significant, as indicated by the chi-squared test.
Contrary to expectations, the reservoir age and alkalinity data (Table 2) did not show any correlation with the flow of rivers expressed as a percentage of mean discharge. These data showed no evidence of a decrease in alkalinity or FRE resulting from dilution by meteoritic water during flood periods. This finding is valid for sites both in crystalline and in limestone sedimentary areas.
One explanation is the fact that the meteorological data in the days preceding the sampling are not known and we do not know in which phase of the flood the sampling was done. It is also possible that while runoff directly feeds the river during floods in the crystalline area, it is not the same for the rivers in a limestone substrate where rainwater can pass through the water table and be recharged in 14C-dead bicarbonate. Nevertheless, our data for the crystalline area tend to decrease with increasing percentage of the average flow.
CONCLUSION
The FRE in the Loire River Basin shows a wide range of variation between 135 to 2251 yr. The FRE is mainly influenced by the geological substrate and especially by the dissolution of old carbonate. Consequently, it is positively correlated with the alkalinity and mineral carbon contents of waters. Seasonal variations in reservoir ages were observed, but no direct link with river flows was noticed. This finding is valid for sites both in crystalline and in limestone sedimentary areas. Due to the large spatial and temporal variability of DIC reservoir ages in the Loire Basin, it appears difficult to use this parameter to establish a wide-ranging baseline of reservoir age. According to Keaveney and Reimer (Reference Keaveney and Reimer2012) and Fernandes et al. (Reference Fernandes, Rinne, Nadeau and Grootes2014), biological or particulate organic carbon samples that integrate the DIC variations would be a better approach to propose 14C FRE corrections for the establishment of reliable chronologies.
ACKNOWLEDGMENTS
This study was supported by the National Association of Research and Technology (ANRT), EDF R&D, and the CEA. Thanks are due to Christine Hatté for the δ13C analysis; Bernard Berthier, Emmanuelle Delque-Količ and the team of the ARTEMIS Saclay AMS facilities for the 14C measurements; Sabrina Bichon and Bruno Deflandre of the Laboratory EPOC, Bordeaux for chlorophyll pigment measurements; and Christophe Rabouille and Bruno Bombled for the alkalinity instrumentation. Comments and suggestions by the Radiocarbon referees and editors significantly improved the manuscript. This is LSCE contribution n°5696.


