


INTRODUCTION
It is reported that prolonged solar activity minima occur once every a few hundred years (Usoskin et al. Reference Usoskin, Solanki and Kovaltsov2007). The grand minima during the past 1000 yr are named the Dalton Minimum (1790–1830 CE), the Maunder Minimum (1645–1715 CE), the Spoerer Minimum (1416–1534 CE), and the Wolf Minimum (1280–1350 CE). Since the weakening in solar activity gives rise to a serious impact on Earth’s climate as appeared in the Little Ice Age, its prediction is an important matter for the future of humankind. Hence, it is important to figure out the structure of variabilities in solar activity not only in solar physics, but also in environment science.
Figure 1(a) shows the total solar irradiance (TSI) during the past 2000 yr reconstructed by compiling the variation of 10Be in ice cores and 14C in tree rings (Steinhilber et al. Reference Steinhilber, Abreu, Beer, Brunner, Christl, Fischer, Heikkilä, Kubik, Mann and McCracken2012). As shown in the figure, the Spoerer Minimum lasted for approximately 120 yr, and it has been the longest grand minimum in the past 2000 yr.

Figure 1 (a) Reconstructed total solar irradiance from 10Be and 14C for the past 2000 yr (Steinhilber et al. Reference Steinhilber, Abreu, Beer, Brunner, Christl, Fischer, Heikkilä, Kubik, Mann and McCracken2012). (b) Variation of 14C concentration measured with 5-yr resolution for the past 2000 yr (Reimer et al. Reference Reimer, Bard, Bayliss, Beck, Blackwell, Bronk Ramsey, Buck, Cheng, Edwards, Friedrich, Grootes, Guilderson, Haflidason, Hajdas, Hatté, Heaton, Hoffmann, Hogg, Hughen, Kaiser, Kromer, Manning, Niu, Reimer, Richards, Scott, Southon, Staff, Turney and van der Plicht2013). Period of the Spoerer Minimum (1416–1534 CE) is indicated by the gray area.
Based on theoretical studies, Karak (Reference Karak2010) suggested that a decline in meridional circulation in solar convection zone might have caused the grand minima (Karak Reference Karak2010). It is proposed, by a flux transport dynamo model, that solar poloidal field is transported to the lower part of the convection zone and become a source of sunspots (Dikpati and Charbonneau Reference Dikpati and Charbonneau1999), and then the emerged magnetic field on the solar surface is transported to the poles by the meridional flow. The speed of meridional flow is therefore one of the possible key parameters to determine the solar activity level. Theoretical studies have suggested that variation in the meridional flow is reflected in the changes of the length of 11-yr solar cycles (Dikpati and Charbonneau Reference Dikpati and Charbonneau1999). Observational studies have indicated that the length of 11-yr solar cycle tends to be more prolonged when solar activity decrease (Solanki et al. Reference Solanki, Krivova, Schüssler and Fligge2002; Watari Reference Watari2008). For example, the period of solar cycle 23 is lengthened to 12.7 yr, resulting in the suppression of sunspot numbers by approximately 65% at the maximum of the solar cycle 24 compared to that of Solar Cycle 23. During the Dalton Minimum, at which the maximal sunspot peak was about 46% of Solar Cycle 23 (Clette and Lefevre Reference Clette and Lefevre2016), solar cycles were also lengthened to 12–13 yr.
A previous study for the Maunder minimum based on the measurement of 14C in tree rings has indicated that the solar cycles had lengthened to 13–15 yr which is a few years longer than the 11-yr cycle (Miyahara et al. Reference Miyahara, Masuda, Muraki, Furuzawa, Menjo and Nakamura2004). It has been suggested that the solar cycle was also lengthened by a few years during the Spoerer Minimum (Miyahara et al. Reference Miyahara, Masuda, Muraki, Kitagawa and Nakamura2006). Importantly, it has also been suggested that the change in the cycle length had started a few cycles before the onset of the Maunder and the Spoerer Minima (Miyahara et al. Reference Miyahara, Kitazawa, Nagaya, Yokoyama, Matsuzaki, Masuda, Nakamura and Muraki2010). In the case of the Dalton Minimum, only one preceding cycle was lengthened (Solanki et al. Reference Solanki, Krivova, Schüssler and Fligge2002; Watari Reference Watari2008).
The accuracy of the 14C data obtained in the above studies was not sufficiently high enough to determine the exact timing of the start of precursory feature. Hence, in order to examine the variation of the solar cycle before the onset of grand minimum precisely, we conduct in this research high-precision measurements of 14C in annual rings for the period before the onset of the Spoerer minimum. As shown in Figure 1(b), the IntCal13 data set of 14C allows a reconstruction of solar activities in the past (Reimer et al. Reference Reimer, Bard, Bayliss, Beck, Blackwell, Bronk Ramsey, Buck, Cheng, Edwards, Friedrich, Grootes, Guilderson, Haflidason, Hajdas, Hatté, Heaton, Hoffmann, Hogg, Hughen, Kaiser, Kromer, Manning, Niu, Reimer, Richards, Scott, Southon, Staff, Turney and van der Plicht2013), however, the time resolution is 5 yr and is not sufficient for our purpose. The advantage of 14C in tree rings is the accuracy of the dating based on dendrochronology compared to 10Be dataset.
14C is a cosmogenic nuclide produced by galactic cosmic rays coming to the earth as well as 10Be. The cosmic rays, of which approximately 90% are protons, receive a modulation through interplanetary magnetic fields varied with solar activity. In the atmosphere, the 14C is produced by a nuclear interaction between nitrogen atoms and neutrons from the cosmic rays. The oxidized 14C diffuses in the atmosphere and then is taken into plants through photosynthesis eventually. As the 14C circulates between the atmosphere, the biosphere, and the ocean through the carbon cycle, the variation in 14C production of 20–30% associated to the 11-yr solar cycle attenuates so strongly that the variation in14C concentration becomes 2–3‰. This means that high-precision 14C measurements with an error of 2‰ or less are necessary in order to investigate the prolongation of the 11-yr cycle.
Therefore, we carried out precise 14C measurements using a compact accelerator mass spectrometry (AMS) system introduced at Yamagata University (YU), by means of a systematic sample preparation employing an automatic graphite production machine. We describe the precisely measured 14C data with single-year resolution during the period of 53 yr from 1368–1420 CE. The results allow us to provide implications of a possible change in the meridional circulation before the onset of the grand minima.
METHODS
Chemical Treatment of Samples
Samples of 53 annual rings of an asunaro tree (Thujopsis dolabrata) excavated at Shimokita Peninsula from 1368–1420 CE were measured. The samples were dated based on dendrochronology by Hakozaki et al. (Reference Hakozaki, Nakamura, Kimura and Nakatsuka2014). The alpha-cellulose was extracted from the annual tree using the method developed by Sakamoto et al. (Reference Sakamoto, Imamura, van der Plicht, Mitsutani and Sahara2003), Ozaki et al. (Reference Ozaki, Imamura, Matsuzaki and Mitsutani2007), and Sakurai et al. (Reference Sakurai, Kato, Takahashi, Suzuki, Talahashi, Gunji and Tokanai2006). The sample pretreatment process is as follows: (1) peeling off annual rings using a knife; (2) removing oils and saps with hexane, ethanol, and acetone using an ultrasonic washing machine; (3) drying the sample and weighing it; (4) removing lignin with NaOCl and HCl solution (80°C, 1 hr, four times); (5) washing with distilled water; (6) removing hemicellulose by washing the samples with NaOH (17 wt%, 80°C, 1 hr, two times); (7) washing the samples with distilled water; (8) neutralizing the sample with HCl solution; (9) washing the purified samples with distilled water; and (10) drying the samples (80°C, 2 days). The yield of the α-cellulose from the wood was 30% by weight. Obtained cellulose samples were each well mixed so that they become homogeneous. They were graphitized using the automated graphitization line of YU-AMS (Tokanai et al. Reference Tokanai, Kato, Anshita, Sakurai, Izumi, Toyoguchi, Kobayashi, Miyahara, Ohyama and Hoshino2013). Graphite was pressed into a piece of cathode manufactured by NEC (National Electrostatics Corporation, Middleton, WI, US).
Measurement
Yamagata University installed a compact 14C-AMS based on a 0.5 MV pelletron accelerator (1.5SDH-1) developed by NEC (Tokanai et al. Reference Tokanai, Kato, Anshita, Sakurai, Izumi, Toyoguchi, Kobayashi, Miyahara, Ohyama and Hoshino2013). A cesium sputtering negative ion source (MC-SNICS) developed by NEC is used.
To obtain Δ14C, the ratio of 12C and 14C of the standard sample is measured in addition to that of wood samples. We included two types of standards—NIST (SRM 4990C) (Mann Reference Mann1983) and IAEA-C6 (Rozanski et al. Reference Rozanski, Stichler, Gonfiantini, Scott, Beukens, Kromer and van der Plicht1992). To monitor systematic errors, we placed the cathodes filled with NIST and IAEA-C6 standard samples at random position on the disk of the AMS. We prepared 4 cathodes made from NIST and 5 cathodes made from IAEA-C6 and placed them on a disk that has a capacity of 40 cathodes. To check the background level, we set two IAEA-C1 samples (Rozanski et al. Reference Rozanski, Stichler, Gonfiantini, Scott, Beukens, Kromer and van der Plicht1992). The reliability of YU-AMS has been assessed since 2010 based on the measurements of IAEA-C7 sample (Rozanski et al. Reference Rozanski, Stichler, Gonfiantini, Scott, Beukens, Kromer and van der Plicht1992), and it has turned out that the offset error is negligibly small (Moriya et al. Reference Moriya, Takeyama, Sakurai, Umebayashi, Toyoguchi, Shiraishi, Miyahara, Ohyama, Nozawa, Ito, Itoh, Hirota and Tokanai2019).
In this study, we aimed at high-precision measurement; therefore, three cathodes per annual ring were loaded on the disk. They were placed at random positions on a disk and were each measured for 300 s for 5–16 turns. Because there is a possibility that the state of the accelerator could change over time, the δ13C correction and the ratio analysis between the standard samples and the cellulose samples were performed every turn; finally, Δ14C was calculated. The measurement error for each annual ring was estimated by combining statistical and systematic errors. The graphite syntheses and then the AMS measurements were duplicated up to four times to achieve the precision of 1.0‰.
RESULTS AND DISCUSSION
Figure 2(a) shows the 14C content in annual rings of the asunaro sample measured by YU-AMS (see Supplementary Table S1 for the Δ14C and the δ13C values). The blue and gray lines show IntCal13 and SHCal13 datasets of 14C content, respectively (Reimer et al. Reference Reimer, Bard, Bayliss, Beck, Blackwell, Bronk Ramsey, Buck, Cheng, Edwards, Friedrich, Grootes, Guilderson, Haflidason, Hajdas, Hatté, Heaton, Hoffmann, Hogg, Hughen, Kaiser, Kromer, Manning, Niu, Reimer, Richards, Scott, Southon, Staff, Turney and van der Plicht2013). The 14C content in annual rings lies between IntCal13 and SHCal13. The red line in Figure 2(a) shows the long-term trend of 14C content obtained by fitting with a fourth-order polynomial function. Figure 2(b) indicates the Δ14C anomaly derived by subtracting the long-term trend from the 14C content in annual rings. Note that the y-axis is inverted in this figure. Black and gray lines show the Δ14C anomaly and ±1σ error range, respectively. As is noted in the Measurement section, we achieved a precision of approximately 1.0‰.
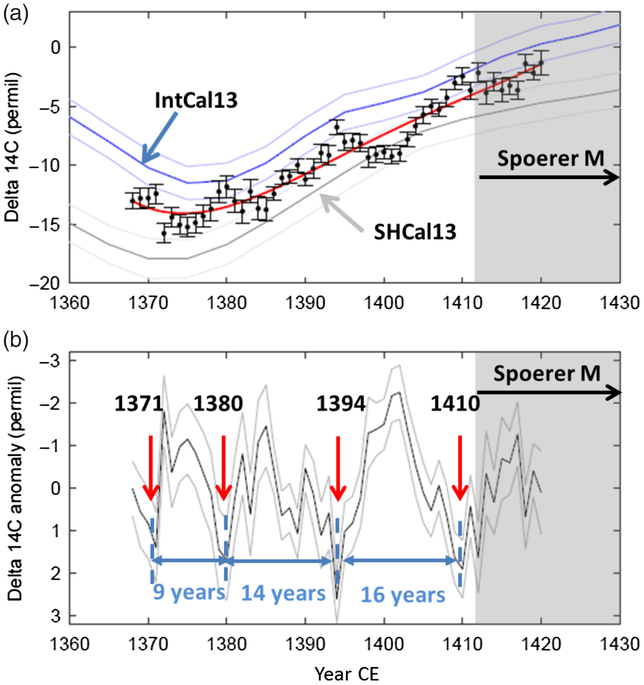
Figure 2 (a) The 14C content in annual tree rings measured with high precision (black dots). The blue and the gray line show IntCal13 and SHCal13 datasets of 14C content, respectively (Reimer et al. Reference Reimer, Bard, Bayliss, Beck, Blackwell, Bronk Ramsey, Buck, Cheng, Edwards, Friedrich, Grootes, Guilderson, Haflidason, Hajdas, Hatté, Heaton, Hoffmann, Hogg, Hughen, Kaiser, Kromer, Manning, Niu, Reimer, Richards, Scott, Southon, Staff, Turney and van der Plicht2013). The red line indicates the long-term trend of high-precision 14C content. (b) The black and gray lines show Δ14C anomaly and ±1σ error range, respectively. The Δ14C anomaly is derived by subtracting the long-term trend shown by the red line in (a). Note that the y-axis is inverted.
Here we examine the timing of 14C peaks and clarify the transitions of solar cycle lengths. The 14C minima determined by our measurements are indicated by red arrows in Figure 2(b). The dates of the four 14C peaks are 1371, 1380, 1394, and 1410 CE, respectively. Note that the actual timings of solar cycle minima are about two years ahead of the 14C peaks, owing to the time lag between the production of 14C and its absorption into trees caused by the carbon cycle (Siegenthaler et al. Reference Siegenthaler, Heimann and Oeschger1980). The lengths of the three preceding solar cycles before the onset of the Spoerer Minimum can be determined as 9 yr, 14 yr, and 16 yr (±1 yr), respectively. This result suggests that two preceding solar cycles were lengthened by several yr before the actual onset of the Spoerer Minimum. Note that the detection of the peaks in 14C anomaly is not sensitive to the methodology of defining the long-term trend in 14C to be subtracted. For example, two other possible cases are examined and confirmed that they reproduce exactly the same results (see the Supplementary Figure S1 for more details).
The two consecutive lengthened cycles do not contradict the results based on lower-precision measurements by Miyahara et al. (Reference Miyahara, Kitazawa, Nagaya, Yokoyama, Matsuzaki, Masuda, Nakamura and Muraki2010). Although the precursory feature of grand minima has been examined only for the Dalton, Maunder, and Spoerer Minima so far, it is likely different depending on the scale of the grand minima: the precursory anomaly is longer in the case of grand minima lasting more than several decades. As is mentioned in the Introduction, only one preceding cycle was lengthened in the case of the Dalton Minimum, which lasted only for two solar cycles and the periodic sunspot cycles had been kept at some level. Although there are only limited number of observations on the solar cycles, based on sunspot observations for the past 400 yr and on the fragmentary annual 14C datasets, there are no successive two lengthened solar cycles unaccompanied by grand minima. The two precursory cycles (14±1 and 16±1 yr) add up to 30 yr and is consistent with the time constant suggested by Karak and Choudhuri (Reference Karak and Choudhuri2011). In the case meridional circulation is weakened for 30 yr to get into the grand minima, it has been suggested that the speed of meridional circulation should be decreased to approximately 76% of the standard level (Karak and Choudhuri Reference Karak and Choudhuri2013).
SUMMARY
We measured the 14C content of 53 annual rings of an asunaro sample, corresponding to 1368–1420 CE, using the YU-AMS system. Because the measurement precision was improved to 1.0‰, it became possible to discuss the lengths of solar cycles in detail. The lengths of the three preceding solar cycles before the onset were 9 yr, 14 yr, and 16 yr (±1 yr), respectively. This result suggests that two preceding solar cycles were lengthened by several years before the onset of the Spoerer Minimum. We suggest that the onset of the Spoerer Minimum was rather slow. Further measurements on the other grand minima are encouraged.
ACKNOWLEDGMENTS
We thank Ms. Yuka Yoshida for her assistance in the preparation of cellulose samples. This work was supported by JSPS KAKENHI grant no. 15H05816 and 25287051.
SUPPLEMENTARY MATERIALS
To view supplementary material for this article, please visit https://doi.org/10.1017/RDC.2019.123


