


INTRODUCTION
The investigated period from 2805 to 2575 yr BP (856 BC to 626 BC) is of interest for both its significance as the beginning of the Hallstatt plateau, which masks the results of radiocarbon (14C) dating between ~800 BC to ~400 BC and for its features of strongly decreasing atmospheric 14C levels at 2625 BP and the subsequent production event at 2610/2609 BP. High-resolution, high-precision 14C calibration data was therefore needed to improve this section of the 14C calibration curve. Recent studies have investigated this section of interest on Japanese cedar tree-rings (Suzuki et al. Reference Suzuki, Sakurai, Takahashi, Sato, Gunji, Tokanai, Matsuzaki and Tsuchiya2010), on bristlecone pine tree-rings (Taylor and Southon Reference Taylor and Southon2013) and on sequoia (Jull et al. Reference Jull, Panyushkina, Miyake, Masuda, Nakamura, Mitsutani, Lange, Cruz, Baisan, Janovics, Varga and Molnár2018). However, the cedar dates were obtained on a floating tree (no accurate dendro dates available), which had to be tied to the 14C calibration curve through wiggle-matching (with an uncertainty of 8 years) and the bristlecone pine samples were measured at a temporal resolution of 10 years. The sequoia single-year study by Jull et al. (Reference Jull, Panyushkina, Miyake, Masuda, Nakamura, Mitsutani, Lange, Cruz, Baisan, Janovics, Varga and Molnár2018) spanned a rather short section before the Hallstatt plateau from 835 to 778 BC. Therefore, the current study provides the first single-year precision data obtained from a well-established dendrochronology on the pre- and early Hallstatt period.
Data from the current work has been previously published in parts by Park et al. (Reference Park, Southon, Fahrni, Creasman and Mewaldt2017) and O’Hare et al. (Reference O’Hare, Mekhaldi, Adolphi, Raisbeck, Aldahan, Anderberg, Beer, Christl, Fahrni, Synal, Park, Possnert, Southon, Bard and Muscheler2019). Data used in Park et al. (Reference Park, Southon, Fahrni, Creasman and Mewaldt2017) is indicated with a superscript P and data used by O’Hare et al. (Reference O’Hare, Mekhaldi, Adolphi, Raisbeck, Aldahan, Anderberg, Beer, Christl, Fahrni, Synal, Park, Possnert, Southon, Bard and Muscheler2019) is indicated with a superscript O in Tables 2 and 3, respectively. While Park et al. (Reference Park, Southon, Fahrni, Creasman and Mewaldt2017) suggested a coronal mass ejection (CME) event for the 2610/2609 BP 14C spike, O’Hare et al. (Reference O’Hare, Mekhaldi, Adolphi, Raisbeck, Aldahan, Anderberg, Beer, Christl, Fahrni, Synal, Park, Possnert, Southon, Bard and Muscheler2019) analyzed NGRIP (North GReenland Ice core Project) ice core samples with sub-annual resolution for 10Be and GRIP (GReenland Ice core Project) samples for 10Be and 36Cl. The inferred atmospheric production rates of cosmogenic radionuclides were found to be comparable to the most pronounced production event found thus far—the 774/775 AD event found by Miyake et al. (Reference Miyake, Nagaya, Masuda and Nakamura2012). The 774/775 AD event had been tentatively attributed to a solar origin by Melott and Thomas (Reference Melott and Thomas2012). Mekhaldi et al. (Reference Mekhaldi, Muscheler, Adolphi, Aldahan, Beer, McConnell, Possnert, Sigl, Svensson, Synal, Welten and Woodruff2015) confirmed this hypothesis using ice core 10Be and 36Cl data. Similarly, the ratio of 10Be and 36Cl production rates of the 2610/2609 BP event suggest that the increased production rate had a solar origin (O’Hare et al. Reference O’Hare, Mekhaldi, Adolphi, Raisbeck, Aldahan, Anderberg, Beer, Christl, Fahrni, Synal, Park, Possnert, Southon, Bard and Muscheler2019). The main difference between the 774/775 AD event and the 2610/2609 BP event was the longer duration of the 2610/2609 BP event in the tree ring 14C data, which has caused a less abrupt increase in the 14C levels compared to the event of 774/775 AD. This prolonged duration and the smoothing of the decadal IntCal data (Reimer et al. Reference Reimer, Bard, Bayliss, Beck, Blackwell, Bronk Ramsey, Buck, Cheng, Edwards, Friedrich, Grootes, Guilderson, Haflidason, Hajdas, Hatte, Heaton, Hoffman, Hogg, Hughen, Kaiser, Kromer, Manning, Niu, Reimer, Richards, Scott, Southon, Staff, Turney and van der Plicht2013) led to a damped signal of the 2610/2609 BP production spike (Figure 4).
METHODS
Annual German oak samples from the 12,480-yr Hohenheim oak and pine tree-ring chronology (Friedrich et al. Reference Friedrich, Remmele, Kromer, Hofmann, Spurk, Kaiser, Orcel and Küppers2004) were obtained from the Institute of Botany, University of Hohenheim, Germany (whole-year and early-wood samples from three trees termed Oberhaid 15, Baunach 33, and Trieb 70 A). In addition, annual bristlecone pine samples from the White Mountains, California, USA (Ferguson Reference Ferguson1969) were obtained from the Laboratory of Tree-Ring Research (LTRR), University of Arizona (whole-year samples from a tree termed CAM 143). The single-year tree rings were cleaned of obvious contamination and resin residues and cut into pieces of ∼2 mg before weighing out to a total of ∼25 mg of wood. The wood was then ABA (acid-base-acid) treated in 13-mm test tubes by consecutive washes in ∼6 mL of 1 M HCl and 1 M NaOH solutions at 70°C for 30 min per step. After an initial acid wash, the wood pieces were treated 2 to 5 times with 1 M NaOH base solution until the solution showed only light discoloration. Upon the last base wash, the wood was put on acid one more time before washing it with Milli-Q water for 15 min at a time until a pH >6 was reached. The wood was then dried in a vacuum oven at 50°C for several hours until reaching baseline pressure.
In addition to the ABA treatment, a bleaching step was performed on a number of duplicate samples in order to compare the pure ABA treatment to bleaching of the wood to holocellulose. Therefore, up to 40 mg of wood were subjected to the treatment above and after the water washes the wood was bleached in 5 mL of a 0.5 M NaClO2 and 0.5 M HCl solution at 70°C until the relatively dark wood had turned into almost white holocellulose (typically after 20–30 min). Upon complete bleaching, the holocellulose was washed with Milli-Q water for 30 min at 70°C repeatedly until a pH >6 was reached. These samples were then dried in a heating block at 70°C without vacuum as previous findings had indicated that the holocellulose was more prone to possible contamination in the vacuum oven than the ABA-only treated wood samples. All dried samples were capped with Fisher TainerTop closures for storage until further use.
For 14C measurements, wood and holocellulose pieces of ∼2.2 mg were combusted in quartz tubes (12.5 cm long, 4 mm I.D.) with ∼60 mg prebaked CuO at 900°C for 3 hr. Upon cracking the quartz tubes in a vacuum line, the produced CO2 was released and water from the oxidation was trapped in a dry ice slush trap. CO2 was cryogenically transferred to graphitization reactors (Santos et al. Reference Santos, Moore, Southon, Griffin, Hinger and Zhang2007) and reduced over 5–6.5 mg iron powder with stoichiometric amounts of H2. The resulting iron/graphite mixture was then pressed in aluminum cathodes and measured by accelerator mass spectrometry (AMS) at the Keck Carbon Cycle AMS facility.
RESULTS AND DISCUSSION
Both a Wilcoxon signed-rank test and t-test showed no significant difference in treatments between the ABA and ABA bleach treated samples (n=8 data pairs). This finding was expected as the age range of the investigated wood samples was much younger than the ancient Kauri samples that Southon and Magana (Reference Southon and Magana2010) had found to be contaminated with traces of modern carbon. Upon this initial finding, all wood was prepared with ABA treatment only, as described in the Methods section.
The new single-year resolved data from this study is shown in Figure 1 (plotted as Δ14C, which denotes the relative deviation from a standard after correction for decay and isotopic fractionation) and Figure 2 (plotted as 14C years) against calendar years. The data is also presented in Tables 1–4 in the appendix of this publication. It should be noted that two obvious outliers were not reproducible through remeasurement: the data points at 2724 BP (775 BC) and 2730 BP (781 BC) were off by more than 5-σ and 7-σ, respectively (Baunach 33 data, Table 1). Remeasurement confirmed that these two data points had been off, but the reason for these outliers remains obscure. The two outliers were not considered in the wavelet analysis or in any further discussion and are only shown for completeness.

Figure 1 Results plotted as Δ14C values, with their associated 1-σ errors. The IntCal13 1-σ error band is shown in light blue for comparison. The two outliers at 2724 BP and 2730 BP are included for completeness.

Figure 2 Results plotted as 14C ages, with their associated 1-σ errors. The current IntCal13 1-σ error band is shown in light blue and the underlying datasets with their age spans and errors are shown grouped by 14C lab codes. The two outliers at 2724 BP and 2730 BP are included for completeness.
Upon measurement, doubts on the correctness of the bristlecone pine dendro data emerged as it is unclear to this date, whether the dendro dates had been correctly converted to “years BC”. Therefore, the bristlecone pine dendro ages are not certain to the exact year but may in fact need to be shifted by 1 calendar year. For example, a 14C date now shown at 2610 BP might in fact belong to the year 2611 BP. While the accuracy and precision of the 14C data are not affected by this potential shift in dendro dating, the new single-year bristlecone pine data will not go into IntCal20 for this reason. The Californian bristlecone data is, therefore, only plotted in Figure 4 for comparison and Table 4 indicates the alternative placement of the Californian bristlecone dates with calendar years in parentheses. The German oak data, on the other hand, has been submitted to IntCal and should become part of the data underlying IntCal20.
The new data generally confirms the existing IntCal13 curve but the following features are noted when comparing 14C ages of Figure 2 to IntCal13: In the oldest part of the curve from 2805 BP until 2760 BP, the newly measured data is on average ca. 10 years older than the IntCal13 mean value. This is again the case around 2710 BP before the Trieb 70 A data displays more scatter than the previous section of Baunach 33. A feature around 2665 BP indicates additional fine structure that is not recognized by IntCal13. At around 2640 BP, the new data obtained from Baunach 33 and Oberhaid 15 trees again show slightly older 14C ages than indicated by IntCal13. Finally, the increase in 14C production at 2609 BP appears as a sharp drop in Figure 2 (peak in Figure 1) and is much sharper and more pronounced than in the IntCal13 data. This event has been compared to the 774/775 AD and 993/994 AD events discovered by Miyake et al. (Reference Miyake, Nagaya, Masuda and Nakamura2012, Reference Miyake, Masuda and Nakamura2013). While the Δ14C peak starts as early as 2611 BP in 10Be (O’Hare et al. Reference O’Hare, Mekhaldi, Adolphi, Raisbeck, Aldahan, Anderberg, Beer, Christl, Fahrni, Synal, Park, Possnert, Southon, Bard and Muscheler2019: supplemental information), it reaches its maximum around 2609 BP in 14C. However, the ice core time scale was independently synchronized to tree ring 14C with 1-σ uncertainties on the order of 2–3 yr (Adolphi and Muscheler Reference Adolphi and Muscheler2016). Remeasurement of the 14C peak may help to determine its exact shape and could lead to a more precise synchronization of the time scales.
Figure 2 compares the new single-year data to IntCal13 data (Reimer et al. Reference Reimer, Bard, Bayliss, Beck, Blackwell, Bronk Ramsey, Buck, Cheng, Edwards, Friedrich, Grootes, Guilderson, Haflidason, Hajdas, Hatte, Heaton, Hoffman, Hogg, Hughen, Kaiser, Kromer, Manning, Niu, Reimer, Richards, Scott, Southon, Staff, Turney and van der Plicht2013). IntCal13 is largely based on 10-year resolved German and Irish oak as well as Californian bristlecone pine data, which has been synthesized to a 5-yr resolved calibration curve in this age range. When considering the underlying data of IntCal13, it becomes clear why the 2610/2609 BP event’s magnitude and exact timing had remained unresolved: While smoothing of the construction of IntCal may have damped the signal of the curve in certain spots, it is largely through the averaging of the decadal data that the 2610/2609 BP event was masked. It is therefore clear that fast changes in atmospheric 14C levels, such as the ones stemming from extreme radionuclide production events, may only be seen at high temporal resolution. The trend towards covering larger sections of the calibration curve with single-year data is therefore important in the discovery of fast (production) events. A compilation of averaged values from all repetition measurements of the new German oak data is displayed in Figure 3 for more clarity. Both outlier values at 2724 BP and 2730 BP have been excluded from these averages.

Figure 3 German oak dates, error-weighted averages. Errors were calculated as standard errors/reduced errors (larger value used).
A detailed view of the section from 2640 to 2570 BP is shown in Figure 4, where the Californian bristlecone pine data is included. Despite the uncertainty of the correctness of the absolute dendro dates (year zero problem), there is a striking similarity of the 14C dates leading up to the 2610/2609 BP peak and it appears that the dendro dates are in fact correct to the exact year.

Figure 4 Detail view around the 2610/2609 BP event, including the new single-year German oak and the Californian bristlecone pine data.
A problem in the conversion from Cal age BP or math BC to “regular” BC appears to have occurred during the preparation of Figure 3 in Park et al. (Reference Park, Southon, Fahrni, Creasman and Mewaldt2017) as there is a shift of 1 calendar year compared to the dates reported here. The peak has been correctly called “660 BC” throughout Park et al. (Reference Park, Southon, Fahrni, Creasman and Mewaldt2017) and only their Figure 3 shows the peak at 659 BC that should in fact occur at 660 BC (2609 BP). All findings of the Park et al. Reference Park, Southon, Fahrni, Creasman and Mewaldt2017 publication remain, therefore, intact but this discrepancy should be mentioned here for clarity and consistency.
With annual 14C data one could expect to see the solar 11-yr cycle as discussed by Stuiver and Braziunas (Reference Stuiver and Braziunas1993) for annually resolved data from 1510 to 1954 AD. Such solar cycles have also been observed during periods of reduced production rates such as the period just before the 774/775 AD event (e.g. Park et al. Reference Park, Southon, Fahrni, Creasman and Mewaldt2017).
A wavelet analysis of the new German oak data does not show significant 11-yr cyclicity at the beginning of the Hallstatt plateau (Figure 5). However, band-pass filtering the data within a frequency range from 1/5 yr–1 to 1/20 yr–1 does display a cyclicity, which appears to be more pronounced after 2675 BP, where amplitudes pick up and are better in phase with an (artificially added) 11.1 year sinusoidal signal (Figure 5). The band-pass filtered data was compared to band-pass filtered random (white noise) data to distinguish any signal from a filtering artifact. The analyzed cyclicity is consistent with a 0.8‰ amplitude and varying periodicity. Hence, this additional analysis yields smaller amplitudes than what the curve in Figure 5 suggests and artifacts of the band-pass filtering have to be taken into consideration when estimating amplitudes. The variation in periodicities explains the weak features in the wavelet analysis of Figure 5. It seems therefore, that the solar cycle exists even during the early Hallstatt plateau but is more dynamic than during other times. The exact causes of this higher variability in the signal are not understood at this time. The additional complexity in the data leading up to the solar proton event could be caused in part by the significantly elevated 14C production rates, which may have counteracted the solar modulation effect on 14C: if e.g. the event with increased production occurred during a solar cycle maximum (with increased galactic cosmic ray shielding, i.e. decreased production) it could mask the solar 11-yr cycle in the 14C data.
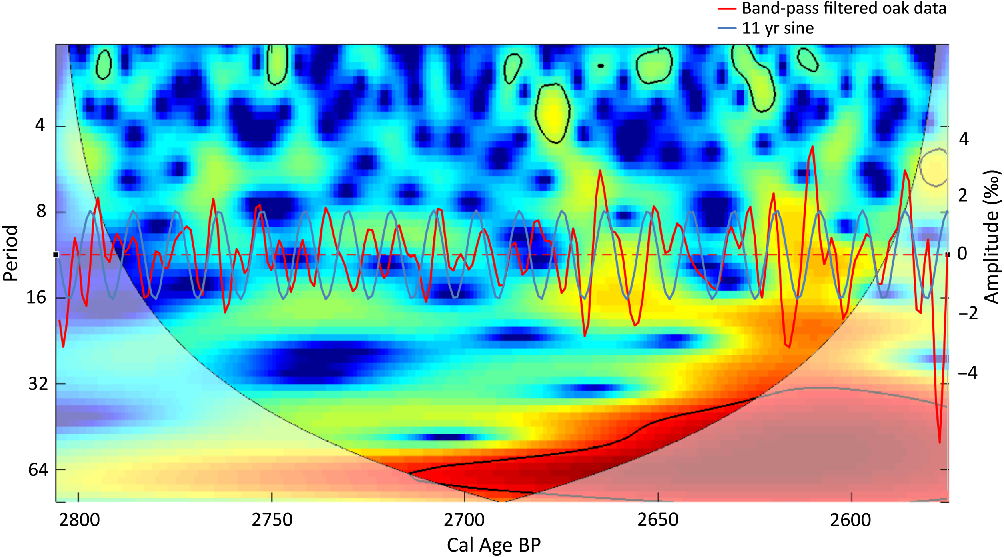
Figure 5 Wavelet analysis of the averaged German oak samples from Figure 3 calculated using the MATLAB packages of Grinsted et al. (Reference Grinsted, Moore and Jevrejeva2004) and Torrence and Compo (Reference Torrence and Compo1998). The dotted line indicates the 11-yr periodicity and the areas outlined with solid lines indicate significant cycles detected with the wavelet analysis (Grinsted et al. Reference Grinsted, Moore and Jevrejeva2004). An overlay of a band-pass filtered curve of the data from Figure 3 (red) and an artificial 11.1 year sine curve (blue) have been added for comparison. (Please see electronic version for color figures.)
CONCLUSION
New single-year 14C data at the beginning of the Hallstatt plateau was obtained from German oak (early-wood and whole-year) and from Californian bristlecone pine (whole-year). This is the first atmospheric 14C single-year record of the older end of the Hallstatt plateau based on an absolutely dated tree-ring chronology.
The data presented here generally matches and confirms the existing IntCal13 data, but adds some important details and more pronounced short-term features at 2665 BP and at 2610/2609 BP. Additional high resolution single-year measurements are needed to improve the IntCal data and to detect other short-term production events that can take place within a few years, as these events can remain undetected with decadal data. Despite the constant improvement of the IntCal data, the resolution of the underlying data must be considered when accurate 14C dating is of the essence. The solar cyclicity appears to be highly dynamic with varying cycle lengths over the entire analyzed period and further analysis may be needed to better understand the underlying causes of this observation. Finally, there is some doubt on the exact calendar age of the Californian bristlecone pine data (uncertainty of 1 calendar year) and the new bristlecone pine data will therefore not be part of IntCal20. The new German oak data on the other hand has been submitted for IntCal20 and will add much needed higher resolution to the IntCal data from 856 BC to 626 BC (2805 to 2575 yr BP).
ACKNOWLEDGMENTS
The authors would like to thank Dr. Paul Creasman of the Laboratory of Tree-Ring Research (LTRR), University of Arizona, for his collaboration in obtaining the tree-ring-dated samples from the LTRR collections. Portions of this research were supported by the Gabrielle O. Vierra Memorial Fund and the W.M. Keck foundation and UCI. This paper is dedicated to our late colleague Erv Taylor, whose dating studies of archaeological material associated with the sack of the Assyrian capital of Nineveh in 612 BC (Taylor et al. Reference Taylor, Beaumont, Southon, Stronach and Pickworth2010) led directly to our interest in the unusual character of the radiocarbon calibration curve at the start of the Hallstatt Plateau.
APPENDIX
Table 1 Single-year dates from Baunach, Tree 33, early-wood. Crossed out, asterisked samples were found to be outliers.

Table 2 Single-year dates from Trieb, Tree 70a, early-wood. A compilation of samples marked with a superscript “P” have been used in the previously published work of Park et al. (Reference Park, Southon, Fahrni, Creasman and Mewaldt2017) and samples marked with a superscript “O” have been used in the work published by O’Hare et al. (Reference O’Hare, Mekhaldi, Adolphi, Raisbeck, Aldahan, Anderberg, Beer, Christl, Fahrni, Synal, Park, Possnert, Southon, Bard and Muscheler2019).

Table 3 Single-year dates from Oberhaid, Tree 15, whole-year rings. A compilation of samples marked with a superscript “P” have been used in the previously published work of Park et al. (Reference Park, Southon, Fahrni, Creasman and Mewaldt2017) and samples marked with a superscript “O” have been used in the work published by O’Hare et al. (Reference O’Hare, Mekhaldi, Adolphi, Raisbeck, Aldahan, Anderberg, Beer, Christl, Fahrni, Synal, Park, Possnert, Southon, Bard and Muscheler2019).

Table 4 Single-year dates from the White Mountains, California, CAM 143, whole-year rings. Alternative dendro dates (due to year 0 problem) are indicated in parentheses.


