INTRODUCTION
There is a need for low-cost, quick-turnaround radiocarbon analysis in the radiocarbon (14C) and biomedical communities. One of these, checking for radiocarbon contamination, is an important exercise for many scientists who rely on natural-level measurements of radiocarbon. In 2006 we began performing monthly swipe analysis of key locations throughout the laboratory facilities at National Ocean Sciences AMS Facility (NOSAMS), including a neighboring building that houses a satellite laboratory. Together with control and blank sample analysis, regular monitoring allows identification of contamination and, if remediation is necessary, provides assurance that the contamination has been removed. When a “hot sample” or elevated swipe result is detected, preparation lab operations are effectively put on hold until the problem is resolved. Thus, a quick turnaround, from collection of swipe samples to accelerator mass spectrometry (AMS) analysis is critical to resumption of operations.
Iterative swipe analyses are required to identify the sources and scope of contamination and then to validate successful remediation. Until recently, swipe samples at NOSAMS were dried then combusted in sealed quartz tubes, cracked on a vacuum line, the CO2 cryogenically purified and transferred to Pyrex tubes, and graphitized using a Sealed Tube Graphite method (STG) (Vogel Reference Vogel1992; Xu et al. Reference Xu, Trumbore, Zheng, Southon, McDuffee, Luttgen and Liu2007). However, the process is labor and time intensive: a day to collect and dry, a day to pack and combust, a day to transfer to a graphite reactor. Moreover, there is greater exposure of vacuum line equipment to contamination in the process. Motivated by the desire to minimize laboratory resources and contamination risks, we investigated which gains could be made by placing samples directly into a tube with reagents for both combustion and reduction (Elder et al. Reference Elder, Roberts and Lardie-Gaylord2017).
Traditional methods for producing graphite from CO2 are well established and robust (Vogel et al. Reference Vogel, Nelson and Southon1987, Reference Vogel1992; Pearson et al. Reference Pearson, McNichol, Schneider and von Reden1998; Xu et al. Reference Xu, Trumbore, Zheng, Southon, McDuffee, Luttgen and Liu2007). A quick, low-cost method would be of use not only for 14C swipe testing but could potentially for some studies involving organic carbon sample types. There are other methods for low-cost, rapid radiocarbon analysis of organic materials but their reported backgrounds and uncertainties lack the sensitivity of traditional methods, require a gas ion source, or involve more steps (Vogel Reference Vogel1992; Getachew et al. Reference Getachew, Kim, Burri, Kelly, Haack, Ognibene, Bucholz, Vogel, Modrow and Clifford2006; McIntyre et al. Reference McIntyre, Lechleitner, Lang, Haghiour, Fahrni, Wacker and Synal2016; Sookdeo et al. Reference Sookdeo, Wacker, Fahrni, McIntyre, Friedrich, Reinig, Nievergelt, Tegel, Kromer and Buntgen2017). Advantages of the Single Step (SS) method include simplicity, and that the uncertainties and backgrounds (blanks) approach those of traditional methods. Here we evaluate the utility, performance, precision and blank of the SS method by testing a variety of organic materials with known consensus values over a range of sample masses. We also report on the 12C current, 13C/12C fractionation and reproducibility of samples prepared by the SS method and measured at NOSAMS.
MATERIALS AND METHODS
At NOSAMS, swipe samples at 15–20 locations are checked on a monthly basis to monitor ambient 14C and detect above-natural levels. These locations include door-handles, keyboards and regularly used equipment such as balances. Using a new pair of nitrile gloves for each sample, swipes are collected with 25-mm-diameter Pallflex tissue quartz fiber filters (PALL # 7200). The filter is moistened with HPLC grade isopropanol then rubbed on the surfaces to be checked. Our strategy is to gently rub the surface area until the filter is visibly discolored in an attempt to collect a minimum of 300 micrograms of carbon. With gloves still on, the filter is rolled between the thumb and forefinger to create a tightly rolled sample, placed into a clean glass vial and dried uncapped in a 50°C oven. Once dried, the vial can be upended over the SS reaction tube and the dry, rolled swipe transferred by letting it drop/slide into the graphite tube without touching it. Single-use polystyrene disposable spatulas are sometimes used to dislodge the swipes from the vial or push it to the bottom of the graphite tube.
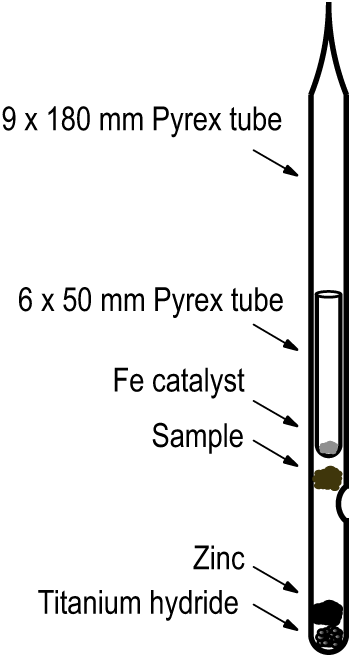
All Pyrex graphite tubes are baked for 2 hr at 550°C to remove contaminants prior to use. Specifics of tubes and reagents are given in Table 1. Reagents are added to the bottom of the tubes with cleaned, dedicated stainless steel funnels. Iron catalyst is conditioned in batches by baking at 450°C under 1.2 atm of hydrogen and then dispensed into the smaller tube which ultimately slides into the larger tube to rest on a dimple as shown in Figure 1. Prior to use, the large tube containing reagents and the small tube containing the Fe are baked separately for one hour at 300°C. Prepared tubes can be stored in a desiccator for up to two weeks. Sample materials other than swipes are placed into the tubes using clean stainless-steel tweezers or a funnel which rests on the dimple and prevents sample from sticking to the sides of the tube. After sample loading, the small prepared tube containing Fe is slid into the larger tube. It is important that no iron “escapes” from the smaller tube and sticks to the inner wall of the larger tube. The entire assembly is placed on a vacuum line, evacuated, flame-sealed, and baked at 500°C for 3 hr and then baked at 550°C for 4 hr in a muffle furnace.
Table 1 Chemicals and supplies used in the Single Step method.


Figure 1 Single Step reaction tube showing placement of sample and reagents.
Method for Blank Determination
A set of NIST OXII oxalic acid samples and background samples using KHP (potassium hydrogen phthalate) and Honheim wood (VIRI-K) was prepared in a series of masses (5–1000 micrograms C) using the SS, STG, and hydrogen reduction (HR) methods. For samples containing <200 µg C, we used KHP in solution, transferred via syringe, with a concentration of 0.5 µg C/µL to better control the mass of carbon loaded. For HR and STG samples, the solution was dried down into 6 × 50-mm quartz tubes, then added to prebaked 9 × 200-mm quartz tubes with 50 milligrams copper oxide, evacuated, sealed and combusted at 850°C. The CO2 was then purified on the vacuum line, manometrically quantified and transferred for reduction. For SS-prepared samples, Pyrex inserts (6 × 50 mm) with dried down KHP were added below the tube with iron catalyst. Inserts were transferred with dedicated clean stainless-steel tweezers. For KHP samples with >200 ug C, and all other samples prepared for the series (OXII, VIRI K), material was weighed out individually on a Mettler XPR2 microbalance to achieve the targeted carbon mass.
HR samples <3 µmols (<36 µg C) were prepared in 0.75 cc3 volume, or ultra-small graphite reactors (Shah Walter et al. Reference Shah Walter, Gagnon, Roberts, McNichol, Lardie Gaylord and Klein2015), those between 3 and 8 µmols (36 –100 µg C) were prepared in 3.92 cc3 small sample reactors and those >8 µmols were prepared in 7.3 cc3 graphite reactor volumes.
SS and STG results were normalized using 1 mg C OXII standards prepared using the STG method; HR graphite was normalized using HR 1 mg C OXII standards. Reported sample masses were gravimetrically determined based on expected carbon content for SS samples and manometrically for other samples. All graphite in this study was pressed into aluminum cathodes and analyzed on the CFAMS system at NOSAMS (Roberts et al. Reference Roberts, Burton, Elder, Longworth, McIntyre, von Reden, Han, Rosenheim, Jenkins, Galutschek and McNichol2010).
It should be noted that initial tests of blank materials included coal. Coal would not produce graphite using the SS method. We tried replacing the Pyrex tube with quartz and increased the temperature to 800°C but this also failed to produce graphite. However, wood and KHP did reliably produce graphite. The reason that coal would not produce graphite is not clear and was not explored further.
RESULTS AND DISCUSSION
Graphite Yield
We analyzed 10 SS graphite samples of KHP expected to yield ∼1 mg C and determined the carbon yield gravimetrically. Using a Mettler XPR2 microbalance, the Fe tube was weighed before and after SS reduction to obtain the carbon weight by difference. The average yield calculated for the 10 samples was 58 ± 22%; a wide range due to weighing errors and the potential coating of the tube containing graphite with reagents distilled from the bottom of the reactor. However, it is clear that yields are low relative to other methods. Average yield for the Hydrogen Reduced graphite method was reported as 93.5 ± 9.2% (Gagnon and Jones Reference Gagnon and Jones1993) for Woods Hole graphite produced between 1987 and 1991.
Other reports on graphite yield for STG methods are 80% (Vogel Reference Vogel1992) and 85–90% (Xu et al. Reference Xu, Trumbore, Zheng, Southon, McDuffee, Luttgen and Liu2007) with a δ13C fractionation of 2–3‰ and 1–8‰ respectively.
Accuracy, Precision, and Applicability
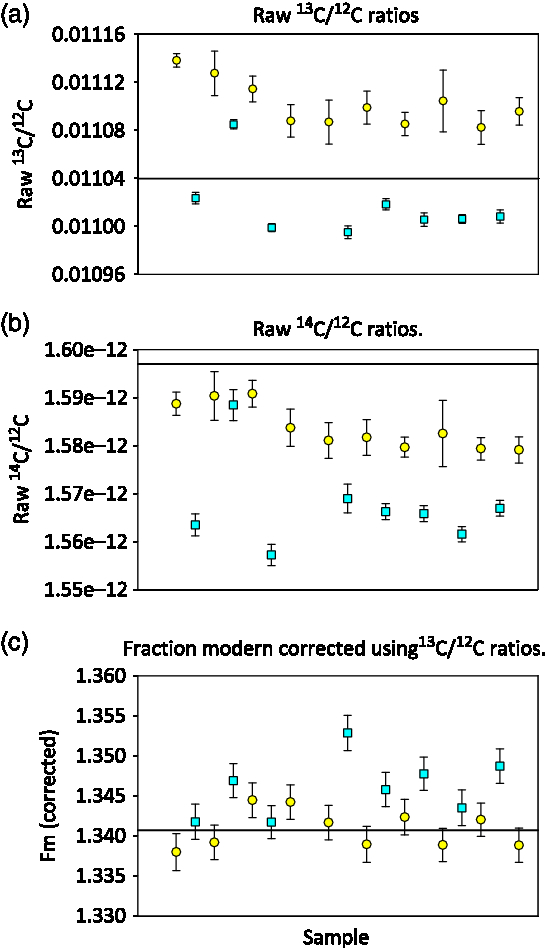
At NOSAMS an online isotopic correction is made to normalize the sample result to a δ13C value of –25‰, assuming a quadratic mass fractionation dependency using 13C/12C ratios measured on the AMS system. This method corrects for mass dependent fractionation that occurs during graphitization and during AMS analysis (Santos et al. Reference Santos, Southon, Griffin, Beaupre and Druffel2007; Xu et al. Reference Xu, Trumbore, Zheng, Southon, McDuffee, Luttgen and Liu2007) and is essential for STG and SS graphite. We observed a clear difference between the 13C/12C ratios as measured on the AMS for STG and SS OXII graphite measured in the same sample group. Figure 2a shows that the samples processed with the SS method are approximately 10‰ more depleted 13C/12C relative to those processed with the STG method. Once the fractionation correction is applied to the raw 14C/12C values (Figure 2b), the SS measurements are tightened and agree to within 2 standard deviations of the STG measurements (Figure 2c). If we normalize using an average of only STG standards, treating the SS OXII samples as unknowns, the mean fraction modern for SS OXII is 1.3463 ± 0.0035 suggesting that SS graphite is slightly more enriched relative to STG graphite.

Figure 2 AMS measured ratios of OXII samples prepared using the Single Step method (SS = square symbols) and prepared with Sealed Tube method (STG = circles), the solid line indicates the expected ratio. Error bars are the standard error of the measurements.
An assessment of precision for the SS method was made by making AMS measurements of 10 STG OX II and 8 SS OX II samples, all ∼ 1 mg of carbon, Fm = 1.3407. Treating each sample as an unknown and using an average of all of the OXII samples from both methods for normalization purposes, we calculate the mean Fm for the SS graphite set as 1.3441 ± 0.0038 (SD of N = 8), and the mean of the STG set as 1.3381 ± 0.0024 (SD of N = 10). All 18 OXII samples were measured to a Poisson counting error of 0.0024. From this it can be derived that the repeatability amongst the 8 SS samples, if regarded as an independent variance term, is approximately ± 0.003 on the Fm scale (difference in the sum of the squared errors).
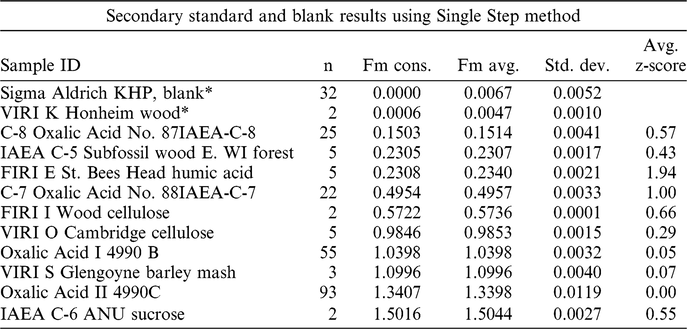
In Table 2 we summarize results of processing a variety of standard reference materials using the SS method. To measure the degree of agreement with consensus values, we use the parameter “z-score” which is the difference between the measured fraction modern (Fm) of a reference material and its consensus value, normalized by the 1-sigma uncertainty associated with its AMS measurement.
Table 2 Summary analyses of standard reference materials graphitized using the SS method after outliers removed (|Z| > 3). Z is the difference between measured fraction modern (Fm) and consensus values (Fm Cons) divided by the analysis error.

* Uncorrected normalized 14C/12C ratio.
 $${\rm{z}} = {{F{m_{meas}} - F{m_{cons}}} \over {error\,\,Fm}}$$
Measurement error is the larger of the internal or external error, propagated with errors from the normalizing standards and blank subtraction. The internal error of AMS analysis is based on the total number of 14C counts measured for each target (internal error = 1/√n, where n is the number of 14C counts). The external error is calculated from the repeatability of multiple measurements of a given cathode over the course of a run (external error = standard deviation from the mean/√N, where N is the number of determinations).
Rejecting 17 outlier measurements (|z| > 3) from the set of non-blank measurements (n = 217, reject rate = 7.8%), the standard deviation of z for OXI is 0.96 (n = 53) and for OXII is 1.14 (n = 86). For the non-blank results listed in Table 2, a paired two- sample t-test was calculated using Excel. Assuming a hypothesized mean difference of 0 and an alpha of 0.05, the test gives a t-value of 1.1 and a t-critical value of 2.0. This implies no significant statistical difference between the measured and consensus values and demonstrates that the method produces accurate radiocarbon measurements for the materials tested.
Comparison with Hydrogen-Reduced Graphite
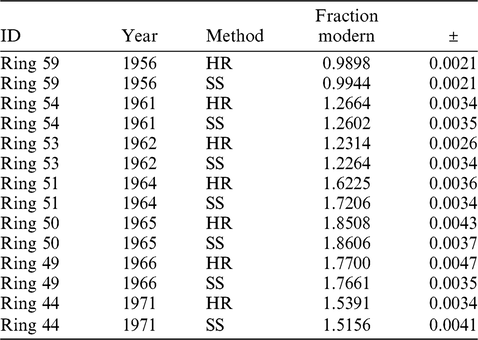
Splits of seven single-year wood samples collected from a European beech tree that grew in Woods Hole, Massachusetts, were analyzed to compare results from the SS method with results obtained from HR samples (Lardie-Gaylord et al. Reference Lardie-Gaylord, Longworth, Murphy, Cobb and McNichol2019). Results are listed in Table 3. These samples were chosen for an additional comparison with the North American atmospheric bomb curve (Hua and Barbetti Reference Hua and Barbetti2004). Samples were pretreated with a series of acid-base-acid heated leaches (Lardie-Gaylord et al. Reference Lardie-Gaylord, Longworth, Murphy, Cobb and McNichol2019) and then divided approximately in half without homogenization. Although there is a small lag, which may be due in part to sampling error, results for both reduction methods agree well with radiocarbon data from the atmosphere (Figure 3). Paired analyses agree well with each other except for the 1964 sample which falls on the steepest part of the curve. The difference of 98‰ may be explained by the difficulty of collecting thin growth rings without smearing years during a period of rapidly rising radiocarbon content in the atmosphere. It may also be due to non-homogeneity of the sample that incorporated large changes in bomb radiocarbon over several months.
Table 3 Single Step method results for beech tree wood and results obtained by the traditional hydrogen reduction method from splits of the same sample of wood. HR = Hydrogen Reduction, SS = Single Step.

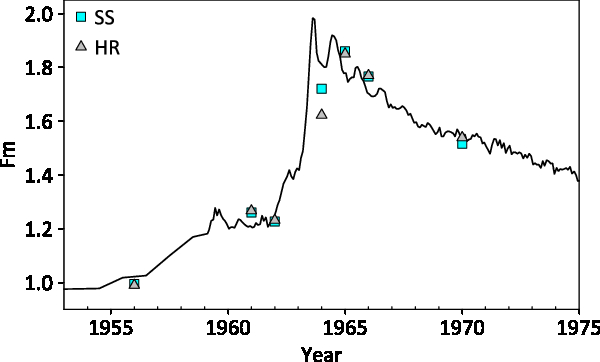
Figure 3 Paired beech tree analyses. The square symbols are Single Step sample results and triangles are Hydrogen Reduction sample results. The solid line represents the atmospheric bomb radiocarbon for Northern Hemisphere zone 1 (Hua and Barbetti Reference Hua and Barbetti2004).
Eighteen other replicates were chosen from archived sample material to compare results from the SS method to hydrogen reduced graphite results. These replicates (17 plant/wood, 1 collagen) span a wide range of ages and were compared to results obtained previously using the hydrogen reduction method. The average difference in Fm radiocarbon for the set was 0.0014 and the standard deviation of those differences 0.0083 (n = 24 pair, six from the Beech tree excluding year = 1964).
Swipe Sample Analysis
The utility of the SS method for routine swipe analysis was investigated by dividing 5 swipe samples in half and processing one half using the SS method and the other by combustion and STG reduction. Results for these analyses are listed in Table 4 and show that in each case, the Fm of the SS method is significantly greater than that of the STG method, generally on the order of 10% greater. In the case where there was clear contamination (STG = Fm 1.98) the SS split was approximately 260% higher (Fm 7.26) which could be due to non-homogeneity of material on the filter. This swipe was collected from the door handle of a locked storage room in a building near NOSAMS where liquid scintillation waste is stored prior to removal. Over the years that we have monitored this location and swipe sample results have ranged between 3 and 30 times modern.
Table 4 Summary of replicate swipe sample analyses comparing SS and STG methods.

A swipe sample is basically a collection of ambient carbon from surfaces which can include modern carbon from fingerprints, pollen, bacteria etc., and older carbon from sediment, dust and petrochemical sources. The maximum combustion temperature for SS is 550°C because we are using Pyrex tubes, whereas the combustion temperature we use for organic materials in quartz is 850°C. While other factors may come into play, differences in Fm and yields are necessarily affected by incomplete reaction of some carbon species in the tube e.g. sample composition and temperature. Seven months of swipe analysis using the SS method has shown that these results are generally more enriched with radiocarbon than graphite prepared by combusting at 850°C and subsequent reduction using with STG method. This may be due to preferential reduction of more labile and younger organic carbon species which are pyrolyzed and/or oxidized at a lower temperature, with less reaction of more refractory species. Nevertheless, it is clear that swipe samples using the SS method will adequately identify a contamination problem.
Using the programmed temperature combustion system (PTCS) at NOSAMS we have seen evidence that pure carbonate oxidizes between 550° and 750°C with a peak typically >600°C (Cruz et al. Reference Cruz, Childress, Gagnon, McNichol, Burton, Elder, Lardie-Gaylord, Gospodinova, Hlavenka, Kurz, Longworth, Roberts, Trowbridge, Walther and Xu2017). To determine if carbonate is converted to graphite using the SS method to any degree, we analyzed two samples with a known mixture of IAEA C-3 cellulose (Fm 1.2941) and IAEA C-1 Carrara marble (Fm 0.0002). The expected Fm computed by mass balance was 0.6849 and 0.6632 and we measured Fm values of 1.1132 and 1.2504 respectively. This suggests that at least some small portion, but not all, of the carbonate is reduced to graphite using the SS method.
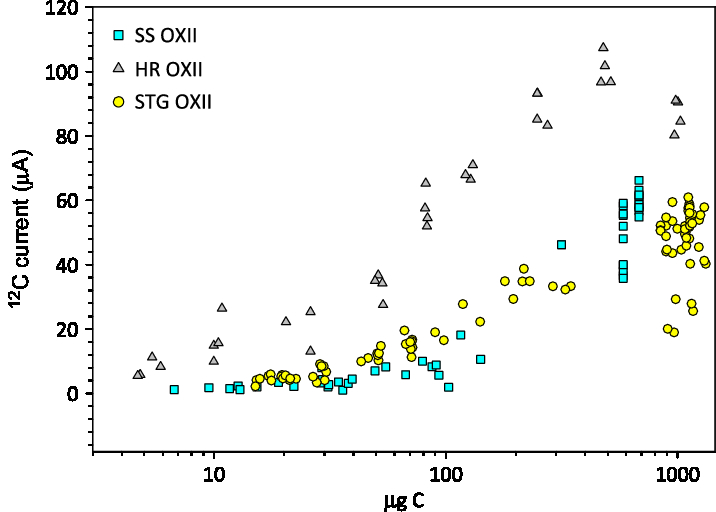
12C Current and Blank Assessment
Prior studies have established the utility of using the STG method for carbon masses <100 ug C and showed that these samples systematically produced less 12C current than the HR method (Khosh et al. Reference Khosh, Xu and Trumbore2010; Xu et al. Reference Xu, Gao and Salamanca2013). The average 12C currents in the accelerator for samples prepared for our small mass series tests are plotted in Figure 4. The SS graphite mass was corrected based on the expected mass of carbon in the sample loaded, multiplied by an average yield of 58%. The mass for the other methods was not corrected for yield. Above 300 µg C, average 12C currents on SS graphite are comparable to STG graphite. Below 300 ug C, the currents for SS graphite are slightly lower than STG, and these are both lower than currents for HR graphite.

Figure 4 Average 12C current for a range of masses produced with 3 graphite methods: SS, STG, and HR versus sample mass (µg C). The SS graphite was multiplied by an average yield of 0.58.
At NOSAMS, a small mass blank correction is applied to all graphite samples <8 µmols (100 µg C). The correction follows a formula that fits the observed mass dependency in measured fraction modern of quality control samples (Roberts et al. Reference Roberts, Elder, McNichol, Jenkins, Gagnon, Xu, Hlavenka and Longworth2019). After a machine blank correction is made, an additional mass balance blank correction is applied to samples containing <= 100 micrograms of carbon.
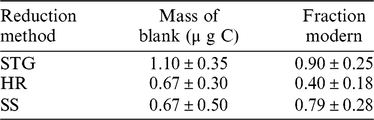
Table 5 lists the NOSAMS estimated blank for the small mass graphite reduction methods used in this study for organic carbon samples. These estimates were determined by applying the model to results of organic quality control samples of varying mass used in in this study.
Table 5 Estimated process blanks for small (<100 µgC) organic carbon samples reduced and analyzed for this study.

The estimated masses of blanks for both the SS and HR methods are very similar and lower than the STG method. However, the modelled fraction modern of the blank for SS graphite is higher, or more modern than the HR method. The measured fraction modern values plotted in Figure 5(b) for SS background samples appear systematically higher than those of HR samples which makes sense given that the mass of the contaminant is about the same, but the fraction modern is more modern for the SS method. The OXII SS fraction modern values in Figure 5(a) are also apparently higher than the HR samples between 100 and 20 µg C except for the two smallest SS OXII values, which had low 12C current and large error bars.
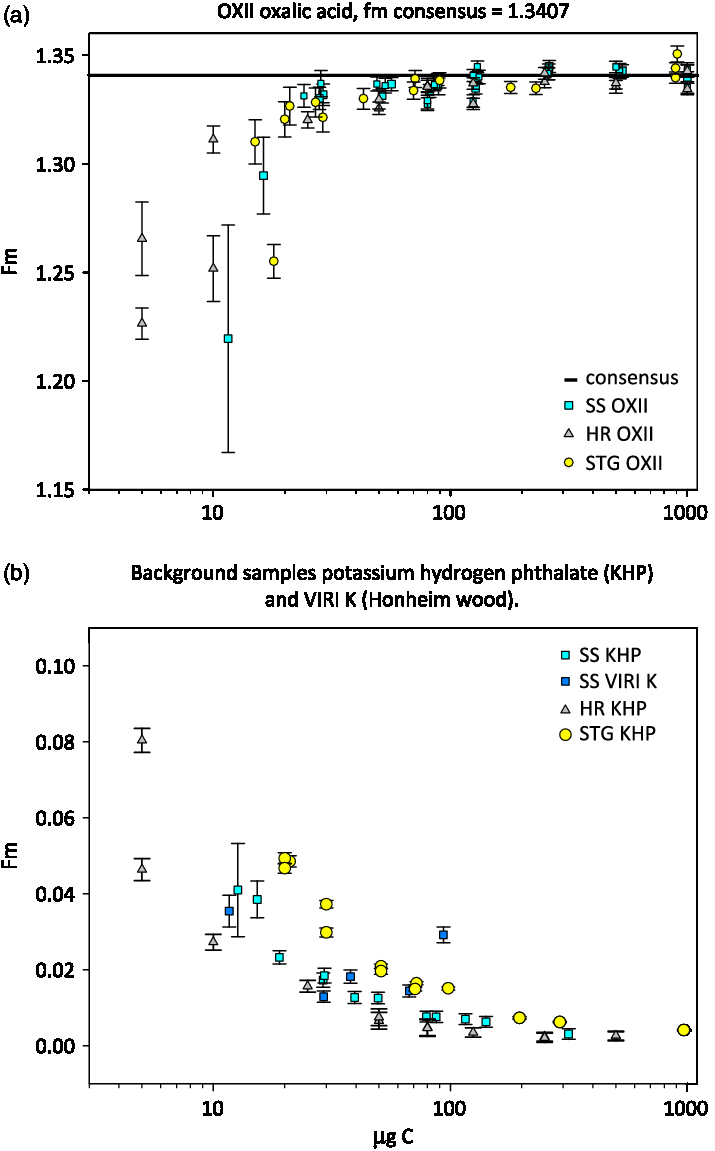
Figure 5 Plot of fraction modern versus carbon mass for samples produced with 3 methods. SS carbon mass was multiplied by 58% yield to correct for actual mass analyzed.
This assessment of the blank for the SS method is encouraging and indicates that with more work, the method may be improved by reducing the blank and increasing yield. Modern sources of blank can be avoided with more vigilant handling of materials to exclude human or natural airborne sources.
SUMMARY
Combining combustion and reduction into a single step offers significant time savings and consequently considerable cost reduction. The number of samples processed daily is currently limited by the number that fit into our muffle furnace (70–80) and the equipment required is minimal. Lower graphite yield (58 ± 22%), lower 12C current in the ion source and an isotopic δ13C fractionation as measured by AMS (10‰), suggest this method may be better optimized by varying reagents, volume and temperature. Correcting the mass fractionation dependency using 13C/12C ratios measured on the AMS system is essential for graphite produced using the SS method. A range of secondary standard results using the SS method have been shown to agree well with consensus values (average z-score 0.14 ± 1.3) and demonstrate a precision of approximately ± 3‰ on 1-mg carbon samples. Measurements of bomb curve SS wood samples further show good agreement with conventional HR replicates and parallel the atmospheric record. The mass of the SS blank is estimated to be 0.67 ± 0.50 ug C with Fm 0.79 ± 0.28 (n = 68). This is comparable to the HR blank in terms of mass for organic samples, but the source of the blank is more modern for the SS method. This rapid simplified method is robust and appropriate for sample types such as plant/wood, humic acid, some pure compounds, and swipe samples.
ACKNOWLEDGMENTS
This work is supported by a Cooperative Agreement (OCE-1755125) with the U.S. National Science Foundation, Division of Ocean Sciences. We acknowledge the entire NOSAMS staff for their support and Mary Lardie-Gaylord for providing assistance with beech tree samples.