INTRODUCTION
Oxidation of organic samples to CO2 is an important preparation step for accelerator mass spectrometry radiocarbon (AMS 14C) measurements. Several preparation methods are available for the oxidation of organic samples to CO2 and for their purification from interfering gases (H2O, SO2, NOx, and halogens). With the stepped combustion method, the combustion is done in oxygen atmosphere at one or more temperature steps (McGeehin et al. Reference McGeehin2004; Brock et al. Reference Brock, Froese and Roberts2010). In this way, the different carbon fractions of the sample can be collected separately, but volatile combustion compounds could condense elsewhere in the gas handling line, which could cause decreased yield and cross-contamination. For better yields or for low carbon quantities, sealed tube combustion method is used where the sample and the oxidizing agent (e.g.: CuO, MnO2) is sealed in an evacuated glass or quartz combustion tube and treated in a muffle furnace at 500–1100°C for several hours (Santos Reference Santos2008; Minami et al. Reference Minami2009; Boutton et al. Reference Boutton1983). SO2 and halogens can be removed by adding silver wool (Genberg et al. Reference Genberg, Perron, Olsson and Stenström2013; Schuur et al. Reference Schuur, Druffel and Trumbore2016). There are several automated methods where the combustion and gas purification is done by elemental analyser (Ramsey and Humm Reference Ramsey and Humm2000; Wacker et al. Reference Wacker, Němec and Bourquin2010a; Kato et al. Reference Kato2014). The oxidation also can be done in liquid medium with strong oxidizing agents (KMnO4, chromic acid, H2O2), or by UV light (Aerts-Bijma et al. Reference Aerts-Bijma, van der Plicht and Meijer2001; Burr et al. Reference Burr2001; Leonard et al. Reference Leonard2013; Steier et al. Reference Steier2013).
To determine the carbon ratio of aerosols, MnO2 is used as an oxidizing agent (Fung Reference Fung1990; Fung et al. Reference Fung, Chow and Watson2002). Vandeputte et al. (Reference Vandeputte, Moens and Dams1996) used a mixture of MnO2 and CuO for the combustion of organic materials above 900°C and optimized their method for δ13C stable isotope ratio measurements (Vandeputte et al. Reference Vandeputte, Moens and Dams1996). In our work, we tried to use a moderate combustion temperature (550°C) using MnO2 alone in borosilicate reaction tube, instead of the widely used quartz tubes. 4 mol of MnO2 produce one mole of O2 at 535°C according to the reaction formula below:
 $$4{\rm MnO}_{2} \mathop{\to}\limits^{{535{\rm }^{\circ}{\rm C}}} {\rm }2{\rm Mn}_{2} {\rm O}_{3} {\plus}{\rm O}_{2} $$
The MnO2 adsorbs the SO2, thus, silver wool was not applied (Jull et al. Reference Jull2000). Furthermore, a gas handling line with a special tube cracker was developed for easy and quick opening the combustion tube attached to the sealed tube graphitization method.
EXPERIMENTAL
Testing of the Combustion Performance and the Gas Purification
The combustion tube is made of borosilicate glass (Pyrex®) with an inner diameter of 7 mm and a wall thickness of 1 mm. The length of the tube is 100 mm after sealing (sealed inner volume: ~3.8 cm3). A dimple is formed close to the bottom end of the tube. The sample and the MnO2 reagent are weighed into the open tube. The reaction tubes are sealed with a commercial “kitchen torch” on an evacuation line with 8 parallel ports at 10–4 mbar. The sealed tubes are uniformly heated at 550°C in a muffle furnace, which is the highest temperature where the Pyrex glass remains stable without softening or melting during the process. This gives a high throughput for this method as up to 50 tubes fits in a simple metal rack and one can fit more racks in one oven. Hundreds of samples can be easily combusted together in one oven.
The grain size of the MnO2 is an important factor, as in the case of too small size, it may enter the evacuation line. The MnO2 Reagent Plus >99% by Honeywell® (cat. no.: 243442-500G) has a proper grain size (60–230 mesh) for this purpose. To minimize the potential carbon contamination derived from the reagent, the MnO2 was prebaked once in air at 500°C for 4 hr before use and the remaining CO2 was checked. One gram of MnO2 was sealed in a combustion tube and treated for 12 hr (overnight) at 550°C in a muffle furnace and the CO2 gas released was recovered on the gas handling line. There was no detectable amount of CO2 derived from the oxidant.
The combustion time of samples were from 12 to 72 hr to test the effect of the combustion time on combustion efficiency. After combustion, the tubes were cracked and the gas was purified on a dedicated gas handling line. The purifying efficiency of the gas handling line was tested with gas compound measurement of combusted sulphanilamide (C6H8N2O2S) which contains carbon, hydrogen, nitrogen, oxygen, and sulphur with a known ratio. Several types of 14C reference materials, were used to test the new method (Table 1).
Table 1 Tested reference materials.

1 Gröning et al. (Reference Gröning2007);
2 NBS SRM4990C reference certificate;
3 Gonfiantini et al. (Reference Gonfiantini, Stichler and Rozanski1995);
4 Scott et al. (Reference Scott, Cook and Naysmith2010).
The stable isotope ratio of the obtained CO2 was measured by Thermo Finnigan Delta plusXP stable isotope ratio mass spectrometer and expressed in delta notation δ13C versus VPDB. The uncertainty of the measurements is 0.2 ‰ for δ13C. The CO2 gas was converted to graphite by sealed tube graphitization technique (Rinyu et al. Reference Rinyu2013). The 14C activity of the samples was measured by a MICADAS AMS. The overall measurement uncertainty is below 5‰, including counting statistics, background subtraction and normalization (Synal et al. Reference Synal, Stocker and Suter2007; Molnár et al. Reference Molnár2013). The results were corrected for the δ13C isotopic fractionation using the Bats software (Stuvier and Polach Reference Stuvier and Polach1977; Wacker et al. Reference Wacker, Christl and Synal2010b; Stenström et al. Reference Stenström2011).
Gas Handling Line
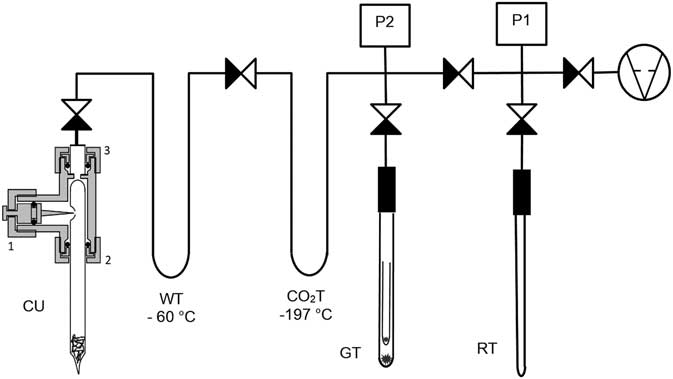
The combustion tubes were cracked and the CO2 was purified on a dedicated gas handling line which was built using Swagelok valves and fittings (Figure 1).

Figure 1 Gas-handling line with the glass tube cracker.
The first part of the line is the special tube cracker unit “CU,” which can open the combustion tube at the dimple with a cracking needle. The cracker unit is made of a modified 3/8′′ Swagelok® Ultra-Torr union tee vacuum fitting (SS-6-UT-3). The straight part of the fitting was drilled to a diameter of 10 mm, but an edge is left at the end for positioning the combustion tube to the right positon under the tip of the cracking needle. The stem of the tee is also drilled to 10 mm and the bore was polished. A cracking needle made of hardened steel (HRc 64-66) is integrated into the unique valve shank with O-ring sealing. The resulting glass chips fall into the inner space of the tube, thus, clean sample changing is facilitated. There is no need to clean the O-rings between sample changing. Moreover, 10-µm metal frit are used to prevent powders getting into the vacuum line. The previously sealed end of the combustion tube is out of the vacuum space (facing downwards). This way it is easy to notice if the sealing before combustion failed, as in this case, the tube cannot be evacuated.
The first trap “WT” is cooled to –60°C (isopropyl alcohol–dry ice) to trap water. The CO2 freezes at –197°C (liquid N2) in the next trap “CO2T” which is part of the measured volume. The quantity of the obtained CO2 is measured in a known volume with the P2 pressure transducer (Baratron® 626B, range: 0–500 mbar). If the carbon amount is high enough, one half of the CO2 is directly sealed into the graphitization tube “GT”. The second part is sealed in the reservation tube “RT” to have a split to save and sometimes this fraction is used for δ13C analyses by IRMS also. The ultimate vacuum of the line is ~6·10–3 mbar ensured by two scroll pumps connected in line (Varian® SH-110 and Varian® IDP-3). The duration of the gas handling process is about 5–6 min/sample. One can easily transfer and clean more the 50 combusted CO2 samples for graphitization per day.
RESULTS AND DISCUSSION
Efficiency of the Combustion and the Gas Purification
The efficiency of the combustion was tested by examination of the carbon recovery (yield) of materials with known carbon content and different degrees of combustibility. First samples with ~1 mg of carbon content were combusted together with a ratio of 50:1 MnO2 to the total mass of the sample. In this case, a brown tarry deposit was observed inside the tubes after the combustion process showing a lack of oxygen. Using of 100:1 MnO2 to sample, the tubes remained clear after the combustion, thus, this ratio was applied later. In this way, the O/C molar ratio is ~7:1 in the case of 1 mg C and 100 mg of MnO2. The CO2 obtained was purified on the gas handling line described above and the recovery of the carbon was determined by pressure measurement in the known volume. The results are shown in Table 2.
Table 2 Carbon recovery yield of the combusted samples (n=5).

In most cases, the carbon content of the samples was recovered with a yield above 95% with good reproducibility. For collagen, the recovery was only 88±2%. In the case of collagen, weighing is a difficult step, as shown by the standard deviation of the results, which are also higher than for other sample types. Considering the high yield obtained for the easily combusting materials, the combustion efficiency is presumably also high for shorter combustion times, but this was not tested. The used muffle furnace has a high thermal inertia, thus, the 12-hr combustion time was used for practical reason. In this experiment the combustion started in the afternoon and the samples cooled down until morning.
In the case of the USGS 24 graphite reference material, 12 hr of combustion time was not sufficient for the complete combustion, therefore, a longer combustion time from 24 to 72 hr was applied (n=5 for each point). Contrary to the relatively low combustion temperature, the yield was about 89±3% for 24 hr of combustion time, while the yield is increased up to 98±1% when the combustion lasted for 48 hr. In the case of 72 hr of combustion time, the yield does not increase further.
The sample mass dependency of the carbon recovery in a constant reaction volume was examined. Decreasing amounts of IAEA-C9 with proportional MnO2 were combusted in the standard reaction tube (~3.8 cm3) and the recovery of the carbon was measured (Figure 2).

Figure 2 Sample mass dependency of the carbon recovery from 0.2 mg to 5 mg.
The carbon recovery decreased proportionally with the sample mass. The reason for the decreasing yield is presumably due to the lower O2 pressure in the reaction tube as gradually less MnO2 was applied following the 1:100 mass ratio rule for oxidant addition. Moreover, the reproducibility of the recovery is deteriorating in the range of smaller sample size, which may be due to the uncertainty of scaling (± 0.01 mg) and pressure measurement also. Due to the reason above, it is better to use a constant amount of MnO2 and a sample with 1–3 mg carbon content.
To test the purification efficiency of the combustion method and the developed gas handling line, sulfanilamide was combusted and the purified gas was measured by Thermo Finnigan Delta plusXP stable isotope ratio mass spectrometer with dual inlet mode from 0 to 70 amu (Figure 3).

Figure 3 Mass scan of the purified CO2 from the combustion of sulphanilamide.
Only some traces of nitrogen and water were found in the mass spectrum together with the CO2 and their fragment ions. Above 46 amu, there was no detectable peak in the mass spectrum. Sulphur-dioxide and the other contaminating gases generated during the combustion are absorbed by MnO2 or frozen in the water trap, thus, the use of silver wool used in other combustion methods is not necessary (Jull et al. Reference Jull2000). The test procedure was repeated with various sample types (collagen, wood, oxalic acid) and similar results were obtained. The CO2 gas obtained is suitable to make graphite target with sealed tube graphitization method (Rinyu et al. Reference Rinyu2013).
Results of the Combusted Reference Materials
To check the initial 14C background of the gas handling process at fore-vacuum, 5-5 parallel borehole samples of fossil CO2 with 0.2, 0.5, 1, and 2 mg of carbon content were led through the gas handling line and graphitized like normal samples without the addition of MnO2. In addition to these samples, equal quantities of fossil borehole CO2 were directly graphitized and measured together with the combusted ones. There was no difference between the 14C results of the parallel samples in the examined range. The background of the process is 0.29±0.20 pMC in the case of 200 µg carbon, which is equal to the background when the borehole CO2 is directly graphitized. This means that the applied fore-vacuum is sufficient, as the carbon content of the remained air does not contaminate the fossil samples, if the carbon content of the sample is at least 0.2 mg.
Not only the remaining air, but also the oxidant can contain carbon which can contaminate the sample. This carbon contamination can be fossil or modern. To check the effect of carbon contamination of the sample by the oxidant, 0.5–0.5 mg fossil CO2 and OXA II were combusted with increasing amount of MnO2 and measured as graphite target (Figure 4).

Figure 4 14C results of the 0.5–0.5 mg fossil CO2 and the OXA II samples in the function of the added MnO2 (dashed line: consensus value of the OXA II 134.07 pMC).
There was no detectable 14C contribution to the fossil CO2 from the oxidant up to 1000 times oxidant and carbon ratio. But in the case of larger amount of oxidant ratio, the background began to increase. This means that the MnO2 contains a small amount of not fossil carbon, which is negligible, if the oxidant:carbon ratio is less than 1000:1. This carbon contamination does not influence the OXA II in the analyzed range.
After the tests above, routine sizes (~1 mg C) of IAEA reference materials and one VIRI sample were also tested with 100 mg MnO2. Five parallel samples were measured for each standard. The mean absolute deviations (MAD) of the measured 14C results from the consensus value are plotted in the next figure (Figure 5).

Figure 5 Deviation of the measured 14C values from the consensus value *: name of the reference material, **consensus values (Gröning Reference Gröning2007; Scott et al. Reference Scott, Cook and Naysmith2010).
The dashed rectangles indicate the estimated standard error for the reference materials. Considering the uncertainty, the mean of the measured and the consensus values are in good agreement in both cases: they are close to the background (C9 0.29±0.20 pMC) or close to the over modern samples (C6: 150.41±0.33 pMC).
The stable isotope ratio of the CO2 obtained was also measured for some sample types by Thermo Delta XP IRMS. The measured values are in close agreement to the informational values from the oxalic acid to the USGS 24 graphite sample, which is a hard-burning material. The close agreement of the stable isotope results confirms the high chemical recovery of the carbon, since otherwise, the isotopic fractionation could cause difference between the expected and the measured values. But it is important to note that the homogeneity of the δ13C values of the IAEA “C” series was not proven in the sub-gram range, therefore, the materials cannot be used as reference for δ13C analyses (Gröning et al. Reference Gröning2007).
14C Results of Micro-Sized Reference Materials Measured by GIS-AMS
Decreasing amounts of borehole CO2 and IAEA C7 samples were combusted and the obtained CO2 was measured directly by gas ion source GIS-AMS method at HEKAL (Molnár et al. Reference Molnár2013). All combustions were done in same ratio of 100:1 MnO2 and sample. This way we can test the novel combustion method without graphitization to demonstrate the applicability in the sub-mg sample range. The mean absolute deviation of the results from the expected values are plotted in the next figures (Figure 6, a and b).

Figure 6 Deviation of the GIS-AMS results from the expected values, without blank correction (a. borehole CO2; b. IAEA-C7).
In the case of the borehole CO2 sample, the background increased from 0.6 pMC to 7 pMC for carbon sample sizes scaled down from 100 μg to 9 μg C, respectively. For the higher 14C/12C ratio sample IAEA-C7, the increasing trend can also be observed, however, the measured value is not background corrected and still in good agreement with the consensus value down to 18 µg C. The good agreement of measured data with the expected values shows the applicability of the method even in the case of very small sample sizes. The method is applicable for as little as 10 µg of carbon with acceptable (~1 pMC) 14C background, if proper blank-correction is applied. About 0.6 ug modern C contamination is given by MnO2 based, sealed tube combustion.
CONCLUSION
A sealed tube combustion method for the preparation of organic materials was developed and paired with a sealed tube graphitization technique for AMS 14C measurements. The sample combustion is done with a 100-fold quantity of MnO2 (Reagent Plus >99% by Honeywell®) at 550°C in muffle furnace using borosilicate glass reaction tube. The required combustion time for compete oxidation is 12 hr in the case of the easily combusted sample types (wood, cellulose, collagen etc.) and 48 hr for the USGS 24. Carbon recovery is above 98% for all type of organic samples. Comparing the MnO2 and the regular CuO method, the sample and the reactant weighing is very similar for both methods, however, the use of silver wool is necessary in the CuO method, while the MnO2 itself can trap the sulphur and nitrogen oxides as well. The sealing of the Pyrex combustion tubes is easier in the case of the MnO2 method, as it is not necessary to use mixed gas for sealing the quartz, which is a more complicated process. In general, the necessary combustion time of the CuO method is shorter (3 hr) compared to the MnO2 method (12 hr). However, in the case of the MnO2 method, the combustion time is 4 times longer than the CuO method, however, owing to the lower temperature (550°C vs. 900°C), the power consumption of the muffle furnace is not proportionally higher than it is for the CuO method. Sulphur and nitrogen oxides generated during the combustion are absorbed by the MnO2, thus, the use of silver wool is not necessary. A new type of tube cracker was developed for chipless and quick cracking and sample changing. In this way, the gas handling process takes for 5–6 min/sample. The preparation process does not trigger measurable isotopic fractionation effects for any of the materials studied. The δ13C results of different sample types are consistent with the expected known values within the uncertainties. The MnO2 reagent did not introduce significant carbon contamination during the testing period. The background is under 0.3 pMC (not blank corrected) in the case of 200 µg carbon measured as solid graphite target. With the direct measurement of the CO2 by a GIS-AMS, the method is suitable for a carbon quantity of as low as 50 µg with an acceptable 14C background (~1 pMC).
ACKNOWLEDGMENTS
The research was supported by the European Union and the State of Hungary, co-financed by the European Regional Development Fund in the project of GINOP-2.3.2-15-2016-00009 “ICER”. This research was realized in the frames of TAMOP 4.2.4. A/2-11-1-2012-0001, National Excellence Program – Elaborating and operating an inland student and researcher personal support system convergence program. The project was subsidized by the European Union and co-financed by the European Social Fund.