


INTRODUCTION
Radiocarbon dating of bone collagen offers the possibility to directly date paleontological and anthropological remains (Wood Reference Wood2015). Moreover, stable carbon isotope analyses of bone collagen provide clues of the paleodiets and environments (Lee-Thorp Reference Lee-Thorp2008). However, bone collagen can be quickly altered by various biological and geochemical processes following burial (Hedges Reference Hedges2002; Tütken et al. Reference Tütken, Vennemann and Pfretzschner2008). These processes lead to a progressive loss of collagen content up to its complete loss, limiting the potential for 14C dating or isotopic analyses. The preservation of bone collagen can vary between sites and even within the same archaeological level. Expensive and time-consuming sample preparations can be conducted on samples while no collagen is preserved. Moreover, such unsuccessful preparation can lead to a partial destruction of valuable samples such as human remains. A rapid screening of bone collagen content minimizing the impact of sampling constitutes a challenge for the preservation of archaeological collection and optimization of analytical strategies.
Numerous techniques have been applied to archaeological and fossil bones in order to study diagenetic processes and to quantify their alteration. A limited number of studies focused on the evaluation of bone collagen content for 14C dating or stable isotopic analysis. Organic content reported in the literature varies from 20 to 25wt% in modern bones (90% of type I collagen associated with noncollagenous protein and lipids). Modern bones from various species were reported as containing 4–4.5% of nitrogen (Bocherens et al. Reference Bocherens, Drucker, Billiou and Moussa2005). Bocherens et al. (Reference Bocherens, Drucker, Billiou and Moussa2005) suggested that weight percent content (wt%) of nitrogen in whole bone is a good proxy for preserved collagen. Brock et al. (Reference Brock, Wood, Higham, Ditchfield, Bayliss and Bronk Ramsey2012) showed that for Holocene and Pleistocene sites, a threshold of 0.7%wt of N in whole bone gives a 73% chance to identify samples containing sufficient collagen for 14C dating (i.e. >1% of remaining collagen after ORAU’s ultrafiltration protocol). The carbon to nitrogen ratio (C:N) of whole bone or extracted collagen can also be used to characterize the preservation of bone and purity of collagen (Ambrose Reference Ambrose1990; van Klinken Reference van Klinken1999; Tisnérat-Laborde et al. Reference Tisnérat-Laborde, Valladas, Kaltnecker and Arnold2003; Brock et al. Reference Brock, Higham and Bronk Ramsey2010). Brock et al. (Reference Brock, Wood, Higham, Ditchfield, Bayliss and Bronk Ramsey2012) showed that for whole bones, a C:N threshold of 17 gives a 71% chance to extract more than 1wt% of collagen from bone samples.
Vibrational spectroscopy techniques have also been applied to archaeological bones in order to select 14C dating samples. Fourier transform infrared spectroscopy (FTIR) was used to evaluate the purity of extracted collagen and to detect the presence of carbon contaminations (DeNiro and Weiner Reference DeNiro and Weiner1988; Yizhaq et al. Reference Yizhaq, Mintz, Cohen, Khalaily, Weiner and Boaretto2005; D’Elia et al. Reference D’Elia, Gianfrate, Quarta, Giotta, Giancane and Calcagnile2007; Gianfrate et al. Reference Gianfrate, D’Elia, Quarta, Giotta, Valli and Calcagnile2007). Near-infrared spectroscopy (Vincke et al. Reference Vincke, Miller, Stassart, Otte, Dardenne, Collins, Wilkinson, Stewart, Baeten and Fernández Pierna2014) and FT-Raman spectroscopy (France et al. Reference France, Thomas, Doney and Madden2014) were successfully applied to identify archaeological samples with a good collagen preservation, and to prescreen the potential of samples for subsequent collagen analyses. Trueman et al. (Reference Trueman, Behrensmeyer, Tuross and Weiner2004) showed a positive correlation between the relative intensity of the organic band by FTIR and the relative content of organic matter in weathered bones. They proposed to use the relative intensity of the collagen amide I band to quantify the remaining collagen content. However, this correlation was established only for well-preserved samples (%wt of organic matter >10%). Recently, FTIR in attenuated total reflection mode (ATR-FTIR) analysis has become widespread because unlike measurement in transmission mode (with the KBr pellet technique), it requires very little preparation, is much faster, and induces less changes in the properties of bone mineral during grinding (Chadefaux et al. Reference Chadefaux, Le Hô, Bellot-Gurlet and Reiche2009; Thompson et al. Reference Thompson, Islam, Piduru and Marcel2011; Hollund et al. Reference Hollund, Ariese, Fernandes, Jans and Kars2013; Beasley et al. Reference Beasley, Bartelink, Taylor and Miller2014). In the present study, we used ATR-FTIR in order to discriminate well preserved bones from poorly preserved archaeological bone samples, and to quantify their collagen content. Two different approaches were tested: peak-to-peak ratio and multivariate calibration. Their advantages and limits are discussed. Archaeological samples were also analyzed using an elemental analyzer to quantify their N wt% content, and these results were used to control the validity and limits of quantification by FTIR analysis.
MATERIAL AND METHOD
Selection of Studied Sample
Data obtained by FTIR spectroscopy in ATR mode or in transmission mode (KBr pellet technique) on bone samples from various archaeological contexts were first compared in order to select samples displaying various states of collagen preservation. Most of the data are already published (Lebon Reference Lebon2008; Lebon et al. Reference Lebon, Reiche, Bahain, Chadefaux, Moigne, Fröhlich, Sémah, Schwarcz and Falguères2010, Reference Lebon, Müller, Bahain, Fröhlich, Falguères, Bertrand, Sandt and Reiche2011; Zazzo et al. Reference Zazzo, Saliège, Lebon, Lepetz and Moreau2012, Reference Zazzo, Lebon, Chiotti, Comby, Delque-Kolic and Reiche2013) but unpublished data were also included. Thirty-seven samples displaying various collagen contents were selected, including samples from the Middle Paleolithic site of Orgnac 3 in France (350 ka; n=1), from the Gravettian layer of Abri Pataud shelter in France (22,000 BP; n=4), from the Magdalenian layers of Bize-Tournal Cave, France (15,000 BP; n=10), and from the Neolithic levels of El Harourra Cave in Morroco (n=6). Four samples previously studied by Zazzo et al. (Reference Zazzo, Saliège, Lebon, Lepetz and Moreau2012) and dated from the Neolithic to the Historic period were also selected (Egyin Gol, Harsova, Agighiol, Magura Buduiasca samples). Finally, archaeological human bone samples from the catacomb of Saints Peter and Marcellinus (hereafter the SSPM Catacomb, Italy, 1st to 3rd century AD; n=12) were also included. These archaeological samples were compared to five modern animal bones from different species (ox, veal, horse, sheep, and turkey). For each sample, about 50 mg of bone powder were finely ground prior to ATR-FTIR and elemental analysis. Elemental analysis showed that some of the samples displayed higher N content than expected according to their collagen content estimated by FTIR analysis. For these samples, including those from the SSPM catacomb as well as from Agighiol and Egyin Gol sites, between 15 and 20 mg of powder were soaked in 2 mL of NaOH solution (0.1M) for 1 hr, then rinsed four times with distilled water. Sodium hydroxide was chosen as this treatment is commonly used for preparation in 14C and isotope analyses sample preparation protocols. The treated powder was dried in an oven for 4 hr at 60°C, then left overnight in a desiccator before the FTIR and elemental analysis.
C and N Content Analysis
Between 0.7 and 1.5 mg of bulk bone powder were weighed based on the evaluation of collagen content by FTIR spectroscopy, and packed in tin capsules. Carbon (C wt%) and nitrogen (N wt%) measurements were subsequently performed on an elemental analyzer (Thermo Scientific Flash). Replicates on standard material indicate reproducibility better that 0.3wt% for N and better than 0.4wt% for C. Three measurements were performed on modern horse bone, HAR, BZ-O30-10, and PAT 78 samples in order to appreciate their homogeneity. Carbon to nitrogen ratios (C:N) were calculated, and collagen content was also estimated considering that modern bones contain ~4% of nitrogen for ~22% of collagen (Stafford et al. Reference Stafford, Brendel and Duhamel1988; van Klinken Reference van Klinken1999).
ATR-FTIR Analysis
FTIR was performed in the ATR mode. Infrared spectra were collected on a Vertex 70 spectrometer (Bruker) with a spectral resolution of 2 cm–1 and the accumulation of 64 scans in the range of 4000–370 cm–1. Less than 1 mg of sample powder was pressed on the surface of a diamond crystal using a single reflection ATR-Golden Gate accessory (Specac). Three measurements were made on each sample in order to determine the homogeneity of sample composition together with instrumental reproducibility. The anvil pressure on the ATR crystal was adjusted from 0.50 to 0.90 N.m–2 in order to obtain a raw absorbance of 0.5 for the ν3PO4 band around 1015 cm–1 (Figure 1). Tests performed in the laboratory (data not shown here) suggest that this normalization of the maximum intensity of spectrum during measurement is essential to obtain reproducible band intensity ratio since variations of raw spectral intensities can lead to changes in the relative absorption of bands. No additional treatment was applied at this step of data acquisition.
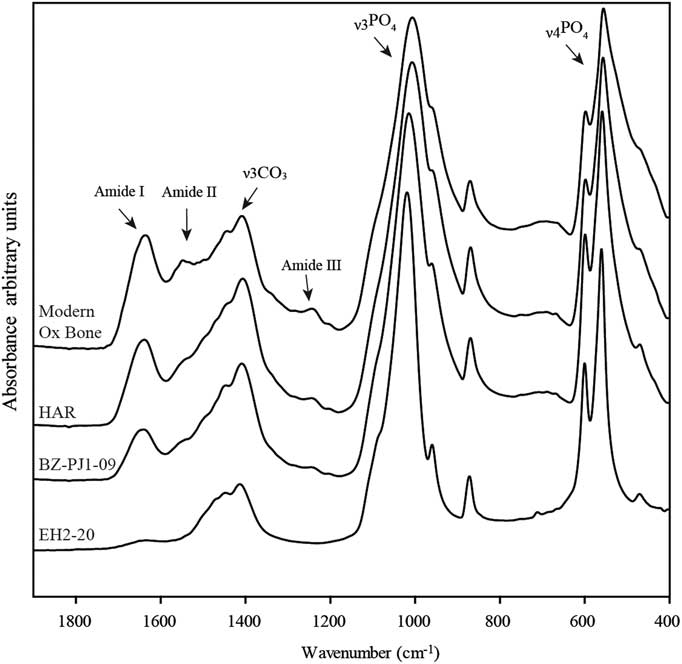
Figure 1 Example of ATR-FTIR spectra with decreasing contents of collagen: modern ox bone, and archaeological bones from Harsova-tell (HAR), Bize-Tournal (BZ-PJ1-09), El Harroura 2 (EH2-20).
ATR-FTIR Peak Ratio Calibration Approach
The relative collagen content of archaeological and modern bone samples was evaluated measuring the amide I/PO4 ratio on raw spectra using OPUS software (Bruker). The amide I band area was measured between 1710 and 1590 cm–1 with a linear baseline. The phosphate ν3 band area was measured between 1110 and 940 cm–1 after linear baseline correction drawn from 1160 to 890 cm–1 (Figure 1). The limit of detection (LOD) and limit of quantification (LOQ) were calculated from calibration curves (Linest function; Excel software) according to Equations 1 and 2, where a 0 is the ordinate intercept of regression curve, SDa 0 the standard deviation of the ordinate intercept, and a 1 is the slope of the regression curve (Feinberg Reference Feinberg2012). Standard errors of estimation were calculated using the Steyx Excel function.
 $$LOQ{\equals}{{a_{0} {\plus}3\,SDa_{0} } \over {a_{1} }}$$
 $$LOQ{\equals}{{a_{0} {\plus}10\,SDa_{0} } \over {a_{1} }}$$
Chemometric Calibration Approach (PLS, PCR)
Multivariate analyses were also applied for quantitative analysis of collagen content. Two different algorithms were tested: partial least-square regression (PLS) and principal component regression (PCR). The Unscrambler X software (Camo) was used to compute PLS and PCR calibration models. All ATR-FTIR spectra were pretreated (OPUS software, Bruker) before application of multivariate analysis: FTIR spectra were ATR corrected, then the baseline offset was corrected. ATR-FTIR spectra were first imported in Unscrambler software, then smoothed using the Savitzky-Golay algorithm (second-order polynomial curve; 17-point window size) and normalized using standard normal variate (SNV) normalization. Different spectral ranges were explored (4000–400 cm–1; 1900–400 cm–1; 1900–800 cm–1). PLS and PCR calibration models were then calculated both on pretreated spectra and on 1st derivative spectra. Using the 1st derivative spectra, one could expect to limit the possible spurious effects of baseline removing, and especially focus on the treatment on intensity variations. Validation of the calibration model was performed using leave-one-out cross-validation (CV). The validity and efficiency of the calibration models were evaluated by visual inspection of predicted versus measured values plots, and using the highest coefficient of determination (R²) and minimal standard error of calibration (SEC) and prediction (SECV) obtained by combining a limited number of latent variables.
RESULTS AND DISCUSSION
Elemental Analysis vs. ATR-FTIR: Repeatability and Sample Contamination
Table 1 presents the mean values (mean), standard deviation (SD), and relative standard deviation (RSD) of the amide I/PO4 peak ratio obtained for three replicate measurements of samples by ATR-FTIR spectroscopy (n=56 samples). These values are compared to C %wt and N wt% and C:N ratio measured using an elemental analyzer. Standard deviation of three measurements of carbon and nitrogen content for modern horse bone (MHB), HAR, BZ-O30-10, and PAT 78 samples are also reported. Despite the homogenization by grinding of bone samples, the samples display a large heterogeneity of composition as shown by RSD of three replicate measurements that can reach 43.2% for N and 36.9% for C contents (mean values of RSD, respectively, 9.7% and 13% for C wt% and N wt%). The relative SD for amide I/PO4 ratio values are similar to those observed for C wt% and N wt% with a mean value of 8.1 and a maximal RSD observed at 23.8%.
Table 1 Measurement of amide 1/PO4, C wt%, N wt%, and C:N ratio and associated standard deviation (SD) and relative standard deviation (RSD). Part of the samples were analyzed before and after NaOH treatment.

Nitrogen contents and amide I/PO4 ratios before and after NaOH treatment are plotted in Figure 2. There is a positive relationship between both variables before treatment (r²=0.84). Samples from the SSPM catacomb before treatment show also a positive relationship between the amide I/PO4 ratio and N content analysis (r²=0.84), but a very different trend compared to samples coming from the other archaeological sites (except for GI samples, and to a lesser extent GOL samples, which show a trend more similar to SSPM catacomb samples) (Figure 2).

Figure 2 Relationship between N content (wt%) and amide/PO4 ratio for archaeological samples. Values obtained before and after NaOH treatment are plotted for SSPM, AGI, and GOL samples.
Figure 3 displays the percent of variation (δ) of amide I/PO4 and N wt% induced by NaOH pretreatment [δ = 100×(value before treatment–value after treatment/value before treatment]. These variations are very heterogeneous between samples and can reach more than 34%. A linear correlation was found between amide I/PO4 ratio increase and N content decrease (r²=0.61). This suggests that the samples from the SSPM catacomb are contaminated by a N-containing organic (humic or fulvic acids) or mineral source (ammonium and nitrates). This contamination is partly removed by the NaOH treatment. The presence of these contaminations can be explained by the very particular function of this site. These catacombs have delivered several mass graves (Blanchard et al. Reference Blanchard, Castex, Coquerelle, Giuliani and Ricciardi2007; Castex and Blanchard Reference Castex and Blanchard2012), suggesting an important accumulation of corpses following an epidemic episode. The accumulation of a high number of corpses over a short period of time and on a limited surface could have promoted the development of microorganisms and the release of decomposition fluids that can explain the contaminations of these samples by noncollagenic nitrogen-containing compounds (Salesse et al. Reference Salesse, Dufour, Lebon, Wurster, Castex, Bruzek and Zazzo2014). The partial elimination of these contaminations can be due to the lack of acetic acid pretreatment in our study, limiting the efficiency of NaOH treatment compared to protocols used before collagen extraction for 14C dating or stable isotopes analyses. The choice to skip the step of acetic acid pretreatment aimed at avoiding any alterations of the organic and mineral matter composition that could have modified ATR-FTIR spectrum features. Despite this absence of acetic acid treatment, amide I/PO4 ratios increase following treatment. This increase can be due to the presence of humic or fulvic acids, which display absorption bands between 1700–1500 cm–1 and 1100–1000 cm–1 that could overlap the amide I and phosphate domain (Stevenson and Goh Reference Stevenson and Goh1971; Ricca and Severini Reference Ricca and Severini1993). The increase of the amide I/PO4 ratio could also result from water absorption (OH stretching vibration band around 1635 cm–1) by bone apatite following NaOH treatment. A dissolution of the mineral phase is however unlikely as carbonated apatite is stable at basic pH (Berna et al. Reference Berna, Matthews and Weiner2004).

Figure 3 Effect of the NaOH treatment on the N content and amide I/PO4 ratio of the bone samples from AGI, GOL, and SSPM catacomb.
Figure 4 shows the spectral features of samples X84-Sq203-FF and X84-Sq205-FF, which display a 38% decrease of their N content following NaOH treatment. No specific band could be identified to explain such changes. However, the subtraction of untreated sample spectrum by spectrum acquired after NaOH treatment (Figure 3c) highlighted two bands around 1715 and 1602 cm–1 that could be attributed to humic acid compounds (Stevenson and Goh Reference Stevenson and Goh1971). Humic acids generally contain from 2 to 7% of nitrogen (Yonebayashi and Hattori Reference Yonebayashi and Hattori1988), and can be detected when their concentrations are above 10% (van Klinken and Hedges Reference van Klinken and Hedges1995). The N excess observed for SSPM samples could not be solely explained by the contribution of these acids as the ATR-FTIR spectra did not clearly display their specific bands. The main source of contamination is probably water-soluble compounds with higher nitrogen contents such as nitrates and ammonia that result from the degradation of organic matter. No traces of nitrates and ammonium were identified on archaeological samples spectra as well as before or after NaOH treatment (main absorption peaks around, respectively, 1380 and 1430 cm–1; Busigny et al. Reference Busigny, Cartigny, Philippot and Javoy2003; Yizhaq et al. Reference Yizhaq, Mintz, Cohen, Khalaily, Weiner and Boaretto2005). Nevertheless, even with a concentration below the ATR-FTIR detection limit (1–2%), nitrates and ammonia could have significantly contributed to the N uptake in SSPM samples.

Figure 4 Comparison of ATR-FTIR spectra before and after NaOH treatment for (a) X84-Sq203-FF and (b) X84-Sq205-FF samples from the SSPM catacomb; (c) subtraction of (a) and (b) spectra.
Whole bone C:N ratios measured for the SSPM catacomb samples before the NaOH treatment vary between 3 and 4.2 and are similar to those observed for Paleolithic bones from Bize-Tournal. The effect of this treatment on the C:N ratios is limited. Archaeological samples from Bize-Tournal, Abri Pataud, and El Harourra display N wt% between 1 and 0.4 and a C:N ratio between 5 and 10. C:N ratios greater than 5 are usually indicative of an extensive alteration of collagen or a high proportion of exogenous carbon such as humic contaminations (Tisnérat-Laborde et al. Reference Tisnérat-Laborde, Valladas, Kaltnecker and Arnold2003). However, for these sites, the relationship between N wt% and ATR-FTIR is similar to that of samples with C:N ratios less than 5. Therefore, it seems that the C:N ratio of whole bone powder does not allow to clearly identify the presence of contamination. This can be due to a correlated variation of inorganic carbon content in altered bone samples that can vary due to carbonate decrease (mineral recrystallization) or carbonate uptake (calcite deposition and carbonate groundwater uptake). In the case of the SSPM catacomb, Salesse et al. (Reference Salesse, Dufour, Lebon, Wurster, Castex, Bruzek and Zazzo2014) suggested that a partial recrystallization causing a decarbonatation of the mineral part could have lowered the C:N ratio of these samples.
Brock et al. (Reference Brock, Higham and Bronk Ramsey2010, Reference Brock, Wood, Higham, Ditchfield, Bayliss and Bronk Ramsey2012) demonstrated that N wt% of whole bone can be a useful prescreening technique to identify bones suitable for 14C dating. Their study, based on sites dating from the Paleolithic to the Bronze Age, showed that a threshold of 0.7 gives a 72% chance to provide sufficient collagen for 14C dating (i.e. ≥1% of collagen) using the ORAU ultrafiltration protocol. However, this threshold can vary between sites since a threshold >1% has to be applied to give a similar chance to extract enough collagen in some archaeological context. Our results obtained on the SSPM catacomb show that the estimation of collagen content based on N wt% on whole bone can be overestimated due to the presence of N-containing contamination. ATR-FTIR analysis seems to provide an interesting alternative to N content prescreening. Even if the amide I/PO4 ratio is modified by NaOH treatment, this ratio increases following decontamination leading to an underestimation of collagen conservation for these samples.
Quantification by ATR-FTIR Peak Ratio: Establishing a Calibration Curve
On the basis of the preliminary screening of the samples, we decided to exclude the contaminated SSPM catacomb samples from our data set to establish a calibration curve. AGI and GOL samples were kept in our data set since NaOH treatment had no effect on their N content. The remaining 30 samples were used to establish calibration models.
Figure 5 shows the relationship between amide I/PO4 ratio and N wt%. A good correlation is observed between the two parameters (r²=0.96). Following Equation 1 and 2, this calibration curve allows to calculate an LOD of N wt% at 0.12wt% and a LOQ at 0.42wt%. These values seem to be overestimated due to the very good correlation of amide I/PO4 ratios and N wt% values between 1 and 4wt%, whereas values for samples presenting lower values of N wt% are less correlated. Figure 5 shows similar amide I/PO4 ratios for samples with N wt% < 0.25 and 0.5–0.7wt% and a LOQ around 0.7 seems more realistic. The relationship is not linear on all the range of N wt% but only between 0.5 and 4wt%. Using the linear regression fitted on the range 0.5–4wt%, the estimation of N by ATR-FTIR spectroscopy can thus be calculated using Equation 3 with a standard error of estimation ±0.22wt%:
 $$\rm N\,\,wt\%\,{=}20.6\,amide\,I\!/\!PO_{4} {\plus}0.31$$

Figure 5 Linear regression between N content (wt%) and amide I/PO4 ratio for modern and archaeological samples. The dotted line representing the regression obtained for all samples (0 to 4.25%wt N) was used to calculate the LOD and LOQ of the calibration. The solid line representing the linear regression between 0.5–4wt% N was used to establish the relationship between N wt% and the amide I/PO4 ratio.
Then, considering that a modern bone contain around 22wt% of collagen and consequently 4wt% of nitrogen (Stafford et al. Reference Stafford, Brendel and Duhamel1988; van Klinken Reference van Klinken1999; Collins et al. Reference Collins, Nielsen-Marsh, Hiller, Smith, Roberts, Prigodich, Wess, Csapo, Millard and Turner-Walker2002), the wt% of collagen remaining in archaeological bone can be calculated by ATR-FTIR using Equation 4 with a standard error of estimation ±1.21wt% (LODcoll=0.65%; LOQcoll=2.30%):
 $$\rm Collagen\,\,wt\%\,{\equals}113.13\,amide\,I\!/\! PO_{4} {\plus}1.69$$
Quantification Using Multivariate Regression
The results of the PLS calibration and leave-one-out validations for the three spectral ranges investigated are summarized in Table 2. The results of PCR models were not reported here because they give consistently higher standard errors and lower coefficient of regression than the PLS model using the same number of factors. All PLS models tested gave R²=0.99 on the three spectral range using limited number for latent variable (n=5). Standard errors of cross-validation varied from 0.22 to 0.23 and are always lower for PLS on 1st derivative spectra. Even if R² and SE are relatively similar, the validation plots comparing the N wt% and predicted N wt% by PLS models highlight significant differences in the ability to quantify low nitrogen concentration by ATR-FTIR. Two models were more effective to quantify low concentrations: PLS on ATR-FTIR spectra (range 4000–400 cm–1) and PLS on 1st derivative spectra (range 1900–800 cm–1). The PLS validation plots for these two models are presented in Figure 6.

Figure 6 PLS validation plots of measured N wt% versus ATR-FTIR predicted values for models established on (a) ATR-FTIR spectra for the range 4000–400 cm–1 and (b) on 1st derivative spectra for the range 1900–800 cm–1. Insets present an enlargement of the curves for low concentrations.
Table 2 PLS regression results of N wt% content obtained using ATR-FTIR spectra or 1st derivative spectra on three different spectral ranges. Asterisks (*) indicate the models that are more effective to quantify low concentrations.

The PLS model based on ATR-FTIR spectra allows a slightly better discrimination of samples with nitrogen content <0.5%wt from those in the range 0.5–0.75wt% than the model based on 1st derivative spectra. However, the ATR-FTIR spectra model can induce an overestimation of N wt% content in the range 0.5–1wt%. The PLS calibration model based on 1st derivative spectra seems to limit the discrimination of samples between 0.5–0.7wt% from those with very low N content (<0.5wt%). Therefore, the ATR-FTIR spectra model should be preferred for detecting low collagen contents, even if the precision of the quantification is lower (standard error of prediction=0.24%). Compared to the peak ratio approach, multivariate calibration models give very similar results, with a slight advantage for the PLS model based on ATR-FTIR spectra for the detection of small amounts of collagen. However, these results are based on a limited number of samples (n=25) and PLS calibration models would benefit from the analysis of additional samples in the future.
CONCLUSION
In this study, we propose a new methodology to detect and quantify collagen content in archaeological bones samples by ATR-FTIR spectroscopy. The method is able to detect samples containing more than 0.5 wt% of N (corresponding to ~3wt% of collagen) and to reliably quantify samples containing more than 0.7±0.22 wt% of N (~4±1.2wt% of collagen). These LOD and LOQ are higher than N detection limits commonly achieved using an elemental analyzer. However, our results show that the measurement of N content using an elemental analyzer can be overestimated by the presence of N-rich contaminants, while ATR-FTIR analyses appear less sensitive to N contamination. Brock et al. (Reference Brock, Wood, Higham, Ditchfield, Bayliss and Bronk Ramsey2012) showed that for ancient archaeological bones, a threshold of 0.7 wt% of N may give a 73% chance to identify samples containing more than 1% of collagen extracted by ultrafiltration. Several sets of triplicates show a large heterogeneity of collagen content evaluated both by FTIR and elemental analyses (up to 23.8% for amide I/PO4 ratio and 43.2% for nitrogen content). These results obtained on homogenized bone powder highlight the high heterogeneity of collagen preservation in archaeological samples. An estimation of collagen content on a single sampling presents a significant risk to fail in assessing the real potential of the sample for 14C or isotopic analyses. We recommend, if low content of collagen is detected, to perform several samplings for collagen prescreening. ATR-FTIR spectroscopy could thus allow obtaining pertinent results within a few minutes, inducing very limited damages to the valuable archaeological samples since less than 1 mg is sufficient for the ATR-FTIR analysis. Although currently very few 14C dating facilities commonly use FTIR spectroscopy, this technique is versatile and available in many laboratories of chemistry, biology, and geology. With the development of instrumentation and the spread of FTIR analyses among many application fields, the price of such device is reducing, and with its low running costs it could be competitive with elemental analysis systems. Furthermore, portable FTIR spectrometers could allow to proceed to the prescreening directly on archaeological sites or in collection storages, minimizing risks of alteration due to displacement of collection. The number of samples examined in this study could be considered as limited, but they are already representative of the whole range of collagen content observed from historical to prehistoric periods. These preliminary results are thus encouraging and ATR-FTIR spectroscopy, combined with a visual selection of samples eliminating samples displaying chalky or friable surface and a low density, should allow a better optimization of bone sample selection prior to 14C dating or stable isotopes analyses. ATR-FTIR analysis is a reliable alternative to optimize the sampling avoiding a partial destruction of valuable samples that contain no more collagen, adapt the size of a sample according to its collagen content, or refine the sampling strategy of samples with a variable conservation before undertaking time-consuming purification and extraction steps.
ACKNOWLEDGMENTS
The authors thank Joël Ughetto and Denis Fiorillo for their assistance for stable isotope analysis at the Muséum National d’Histoire Naturelle and Marie Balasse for providing access to the Service de Spectrométrie de Masse Isotopique of the MNHN (SSMIM). We thank also Gaël Guillou from the LIENSs stable isotope facility for nitrogen content analysis. This work was partly funded by the French Ministry of Culture and Communication thought the PNRCC program OsIRis. We are grateful to Abdeljalil El Hajraoui and Roland Nespoulet for providing the El Harourra bone samples from the excavations of the archaeological mission El Harhoura-Témara, under the administrative supervision of the Institut National des Sciences de l’Archéologie et du Patrimoine (Rabat, Morocco). We are especially thankful to Dr. Aomar Akerraz, Director of the Institut National des Sciences de l’Archéologie et du Patrimoine. We are also grateful to Laurent Chiotti, Roland Nespoulet (Abri Pataud), Kevin Salesse, Dominique Castex, Elise Dufour (SSPM catacomb), and Anne-Marie Moigne (Bize-Tournal) for providing the ancient bone samples. Finally, we would express our gratitude to the two anonymous reviewers for their constructive remarks, which contributed to the improvement of the manuscript.


