INTRODUCTION
Traditionally, artificial 14C labeling techniques are used in biomedical research to understand biological processes at the molecular level, though the high price and scarceness of these labeled substrates significantly limit the implementation of these studies. However, due to the atmospheric testing of the nuclear weapons the amount of the radiocarbon content in the atmosphere nearly doubled within a few years (Levin and Kromer Reference Levin and Kromer2004; Levin et al. Reference Levin, Hammer, Kromer and Meinhardt2008; Hua et al. Reference Hua, Barbetti and Rakowski2013) and this was incorporated into organisms that lived after the 1960s. After the maximum in the 1960s and 1970s, the excess of 14C decreased rapidly in the atmosphere offering a great opportunity for assessing the carbon turnover rates or the molecular turnover rates of different kinds of biological tissues (Libby et al. Reference Libby, Berger, Mead, Alexander and Ross1964; Nydal et al. Reference Nydal, Lövseth and Syrstad1971; Harkness and Walton Reference Harkness and Walton1972; Stenhouse and Baxter Reference Stenhouse and Baxter1977; Druffel and Mok Reference Druffel and Mok1983; Wild et al. Reference Wild, Arlamovsky, Golser, Kutschera, Priller, Puchegger, Rom, Steier and Vycudilik2000; Geyh et al. Reference Geyh2001; Georgiadou and Stenström Reference Georgiadou and Stenström2010; Stenström et al. Reference Stenström, Skog, Nilsson, Hellborg, Svegborn, Georgiadou and Mattsson2010; Falso and Buchholz Reference Falso and Buchholz2013). The execution of these specific tests, which utilize the bomb-14C labeling technique, is slowly running out of time because of the availability of the 14C tracer which is constrained by the date of the atmospheric nuclear tests. In line with this the number of the available donors whose birth dates are in the appropriate age range (between 1960 and 1990) is decreasing, as well.
The 14C content of living organisms remains proportional with the atmospheric level due to the continuous metabolic turnover, substitution and realignment of tissue components. Previous studies have established that some human tissues do not undergo any changes after their initial formation e.g. dental enamel (Spalding et al. Reference Spalding, Buchholz, Bergman, Druid and Frisen2005; Cook et al. Reference Cook, Dunbar, Black and Xu2006) while there are tissue types which keep the changes after reaching maturation at a reduced level and within a well-defined time interval, e.g. the human crystalline lens (Lynnerup et al. Reference Lynnerup, Kjeldsen, Heegraad, Jacobsen and Heinemeier2008; Kjeldsen et al. Reference Kjeldsen, Heinemeier, Heegaard, Jacobsen and Lynnerup2010).
Here, we investigated ten tissue components of the human eye to unveil and determine their virtual 14C ages using the 14C bomb-pulse dating as reference. The 14C map obtained here for the human eye as well as the carbon exchange rates of the investigated tissues allowed to expose so far unknown developmental relationships.
MATERIALS AND METHODS
This study was approved by the Scientific Council of Health, Scientific and Research Ethics Committee of the University of Debrecen (reference number: 63571-1/2017/EKU).
Donor Selection
A key requirement of this study was to find an appropriate subject for the investigations. Specifically, very strict inclusion criteria were applied, i.e. the donor’s birth date had to be close enough to the time range when the nuclear weapon tests reached their peak, all relevant anamnestic and nutritional history had to be available, and any factor that could significantly modify intrabulbar metabolism had to be excluded. Only one donor was found during the selection period who met the above criteria. He was born April 25, 1965, had lived in an agricultural area of Hungary and had a typical provincial diet. He died in March 23, 2013. This subject had no known long-term chronic diseases during his life and systematic drug consumption could also be excluded, which would have influenced the 14C content of the investigated tissues. All in all, the donor may be regarded as a representative of the average population of the Great Hungarian Plain area.
Sample Collection and Purification
The removal of the eyes of the human donor and the separation of the tissue samples were performed on the date of the subject’s death in compliance with the ethics scheme of the University of Debrecen. The enucleation of the eyeballs was carried out carefully with special regard to avoid any contamination with surrounding tissues within less than 6 hr from the time point of death. The process of enucleation took approximately 15 min, and immediately the preparation of tissues was performed by sterile instruments for each tissue. Then the separated tissue samples were frozen at –80ºC in order to prevent potential post-mortem degradation of the tissues.
The water content of the tissues was removed by freeze-drying (at 1–5 mbar pressure, for 24 hr) using a UNICRYO MC2L-60. The dry matter ratios of the samples depend on the particular histological type (Table 1). In order to test and verify reproducibility of the chemical extraction and the measurement processes, i.e. two independent measurements, each tissue sample of the eyeball was divided in two parts and stored separately.
Table 1 Dry matter content of the tissues of the human eye investigated.

A former study of Kjeldsen et al. (Reference Kjeldsen, Heinemeier, Heegaard, Jacobsen and Lynnerup2010) showed that the formation processes of the outer capsule and the nucleus of the human eye lens take place on highly different timescales. Consequently, their 14C content must also differ. In order to confirm this feature, we separated the outer capsule of the eye lens from the nucleus after the freeze-drying process. The tissue separation was helped by their different colors gained during the freeze-drying process. There was no chemical pretreatment, after the freeze-drying process. The dry content of the tissue samples and standards (IAEA-C7 and –C9 Le Clercq et al. Reference Le Clercq, van der Plicht and Gröning1998; Hogg et al. Reference Hogg, Higham, Robertson, Beukens, Kankainen, McCormac, van der Plicht and Stuiver1995; Scott Reference Scott2003, handled/prepared in the same way as tissue samples) were combusted in evacuated quartz tubes with CuO at 1000ºC for 10 min. The extraction of the generated CO2 from the other combustion gases was carried out on a cryogenic gas preparation line (for details, see Molnar et al. Reference Molnar, Janovics, Major, Orsovszki, Gönczi, Veres, Leonard, Castle, Lange, Wacker, Hajdas and Jull2013a). The separated CO2 gas was converted to graphite in a sealed tube according to the graphitization method introduced by Rinyu et al. (Reference Rinyu, Molnar, Major, Nagy, Veres, Kimak, Wacker and Synal2013). In the case of less than 100 micrograms carbon in the tissue sample, the zinc micro-graphitization technique was used (Rinyu et al. Reference Rinyu, Orsovszki, Futo, Veres and Molnar2015).
Measurement of the Radiocarbon Content
The measurements of the 14C contents were carried out on a MICADAS (MIni CArbon DAting System, Synal et al. Reference Synal, Döbeli, Jacob, Stocker and Suter2004, Reference Synal, Stocker and Suter2007) type accelerator mass spectrometer (Molnar et al. Reference Molnar, Rinyu, Veres, Seiler, Wacker and Synal2013b). Graphite targets which were prepared from NIST-SRM-499°c oxalic acid standard (134.07 pMC, δ13C = –17.78 ± 0.08 ‰) were used as normalization standard and from fossil 14C-free CO2 gas (Linde AG, Répcelak, Hungary, 4.5 purity, δ13C = –3.78 ± 0.08‰) were used as instrument blank. For determining the amount of modern versus dead carbon, i.e. recently incorporated carbon, representing contamination during the chemical pre-treatment process, chemical standards with well-known 14C activity were employed (IAEA C7 and C9, Le Clercq et al. Reference Le Clercq, van der Plicht and Gröning1998; Hogg et al. Reference Hogg, Higham, Robertson, Beukens, Kankainen, McCormac, van der Plicht and Stuiver1995; Scott Reference Scott2003) and measured together with the samples in the same magazines.
The Fraction Modern (F14C) (Mook and van der Plicht Reference Mook and van der Plicht1999; Stenström et al. Reference Stenström, Skog, Georgiadou, Genberg and Johansson2011; Reimer et al. Reference Reimer, Bard, Bayliss, Beck, Blackwell, Bronk Ramsey, Buck, Cheng, Edwards, Friedrich, Grootes, Guilderson, Haflidason, Hajdas, Hatté, Heaton, Hoffmann, Hogg, Hughen, Kaiser, Kromer, Manning, Niu, Reimer, Richards, Scott, Southon, Staff, Turney and van der Plicht2013) unit was used to compare the 14C contents of the individual tissues.
Calculating Virtual Age
The F14C unit does not depend on the year of the measurement and is commonly used for 14C measurements and date calibration of post-bomb samples. All 14C results were processed using the BATS AMS data evaluation software developed by Lukas Wacker, ETH Zurich (Wacker et al. Reference Wacker, Christl and Synal2010).
Calibration of the resulting F14C value is required in order to determine the calendar age of the investigated sample. CALIBomb program was used to calibrate post-bomb samples. Calibrated calendar year intervals were obtained using IntCal13 data set (Reimer et al. Reference Reimer, Bard, Bayliss, Beck, Blackwell, Bronk Ramsey, Buck, Cheng, Edwards, Friedrich, Grootes, Guilderson, Haflidason, Hajdas, Hatté, Heaton, Hoffmann, Hogg, Hughen, Kaiser, Kromer, Manning, Niu, Reimer, Richards, Scott, Southon, Staff, Turney and van der Plicht2013) with Levin (Levin and Kromer Reference Levin and Kromer2004; Levin et al. Reference Levin, Hammer, Kromer and Meinhardt2008) bomb curve extension (IntCal13/Levin) and IntCal13 data set with NHZ1 (Hua et al. Reference Hua, Barbetti and Rakowski2013) bomb curve extension (IntCal13/NH Zone 1). Contemporary level of 14C in Hungary is continuously monitored by our research group (Major et al. Reference Major, Haszpra, Rinyu, Futó, Bihari, Hammer, Jull and Molnar2018) using atmospheric 14C analyses. Measured values in Debrecen city and also a rural station in western Hungary (Hegyhátsál) shows very good agreement with the Jungfraujoch continental background station.
The resulting calendar year intervals were named “virtual age” of the given tissue. This year interval is not the real age of the tissue. This year interval, which was determined by the F14C value of the tissue sample, characterizes those living organisms which died during the given annual period and till that time they maintained an active relationship—by metabolism—with the atmospheric 14C concentration. Moreover, the virtual age characterizes the whole tissue as a unit, which has many unique building parts with different 14C content and this value is also determined by the tissue related metabolic exchange processes.
RESULTS AND DISCUSSION
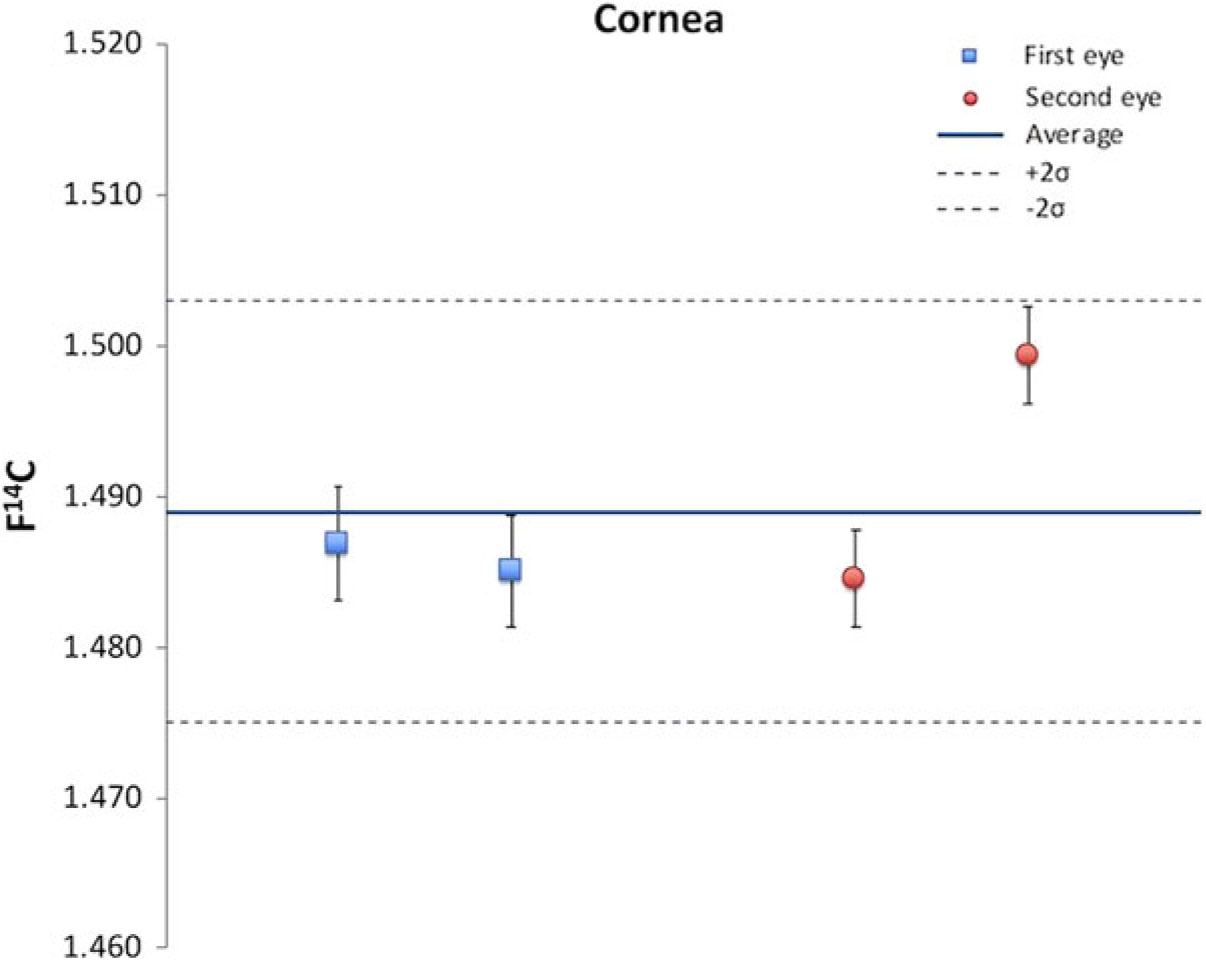
Four individual cornea samples of the cadaver were processed in order to investigate the reliability of the chemical extraction procedure and the measurement process (Figure 1). The average of the four F14C values was 1.489 and the standard deviation was 0.007. At the 0.025 significance level the four measured values cannot be distinguished.

Figure 1 Test of the reproducibility of the chemical extraction and the measurement processes; 14C results of four independent cornea samples.
In order to examine measurement consistencies, we used a previously-developed protein formation function for the crystalline lens (Kjeldsen et al. Reference Kjeldsen, Heinemeier, Heegaard, Jacobsen and Lynnerup2010). Considering that the donor died in January 2013, and that a one-year shift is commonly observed in case of the dietary 14C content relative to the atmospheric ratio, it can be calculated that the 14C content of the nucleus of the crystalline lens should be 1.601 F14C (Kjeldsen et al. Reference Kjeldsen, Heinemeier, Heegaard, Jacobsen and Lynnerup2010). Based on two independent measurements of the nucleus of the crystalline lens taken from our subject the average 14C content was 1.610 ± 0.010 F14C, which is close to the above-mentioned theoretical value.
Table 2 shows all the measured values obtained for the different tissue types of the same eyeball. Of these, there are structures such as the nucleus of the crystalline lens, sclera, limbus and cornea which have relatively high 14C contents. Their calibrated virtual age intervals are quite close to the date of birth. For example, the cornea has the fourth closest time interval to the date of birth, i.e. approximately 9 yr (8.37 yr). This means that tissues possessing relatively high amounts of 14C slowed down their metabolism, formation and substitution processes greatly. It follows that the formation function of these tissues can be determined with high accuracy just as it has been made for the crystalline lens’ (Lynnerup et al. Reference Lynnerup, Kjeldsen, Heegraad, Jacobsen and Heinemeier2008; Kjeldsen et al. Reference Kjeldsen, Heinemeier, Heegaard, Jacobsen and Lynnerup2010).
Table 2 The measured F14C values of the different tissues and their calibrated virtual age intervals. The 1σ and 2σ intervals are given in correspondence to the 68.2% and 95.4% probability of the output from CALIBomb, respectively. Calibrated calendar year intervals were obtained using IntCal13 data set (Reimer et al. Reference Reimer, Bard, Bayliss, Beck, Blackwell, Bronk Ramsey, Buck, Cheng, Edwards, Friedrich, Grootes, Guilderson, Haflidason, Hajdas, Hatté, Heaton, Hoffmann, Hogg, Hughen, Kaiser, Kromer, Manning, Niu, Reimer, Richards, Scott, Southon, Staff, Turney and van der Plicht2013) with Levin (Levin and Kromer Reference Levin and Kromer2004, Levin et al. Reference Levin, Hammer, Kromer and Meinhardt2008) bomb curve extension (IntCal13/Levin) and IntCal13 data set with NHZ1 (Hua et al. Reference Hua, Barbetti and Rakowski2013) bomb curve extension (IntCal13/NH Zone 1).

* These results are the average of two or more measurements of individually handled sample.
The 14C content and the virtual age intervals of the sclera are in line with the measured values of the nucleus of the crystalline lens. However, its more complex structure requires compound specific investigation in order to develop the appropriate model of the formation function of the sclera. Moreover, it should be noted that the mathematical models describing the above attributes cannot be developed and implemented without extensive and well-organized sample collection and measurements using donors with various lifespan and birth dates.
Interestingly, the iris has an intermediate calibrated virtual age, suggesting that the development and exchange processes in this tissue did not stop completely, and the metabolic process worked with higher intensity in this tissue. Clearly, the retina is the virtually youngest tissue of the eye, as expected. Also, interesting but not entirely surprising, is the fact that the virtual age of the outer capsule of the crystalline lens is very close to the virtual age of the retina. Nonetheless, both values are located more than 10 yr away from the date of death, probably due to the decreased substitution and metabolic exchange rate in these tissues.
The measured 14C data of the nucleus and the outer capsule of the crystalline lens show nicely that the epithelial basement membrane isolates the inner part of the crystalline lens completely from the surrounding tissues and there is no sign of transport of metabolites in this area (Table 2).
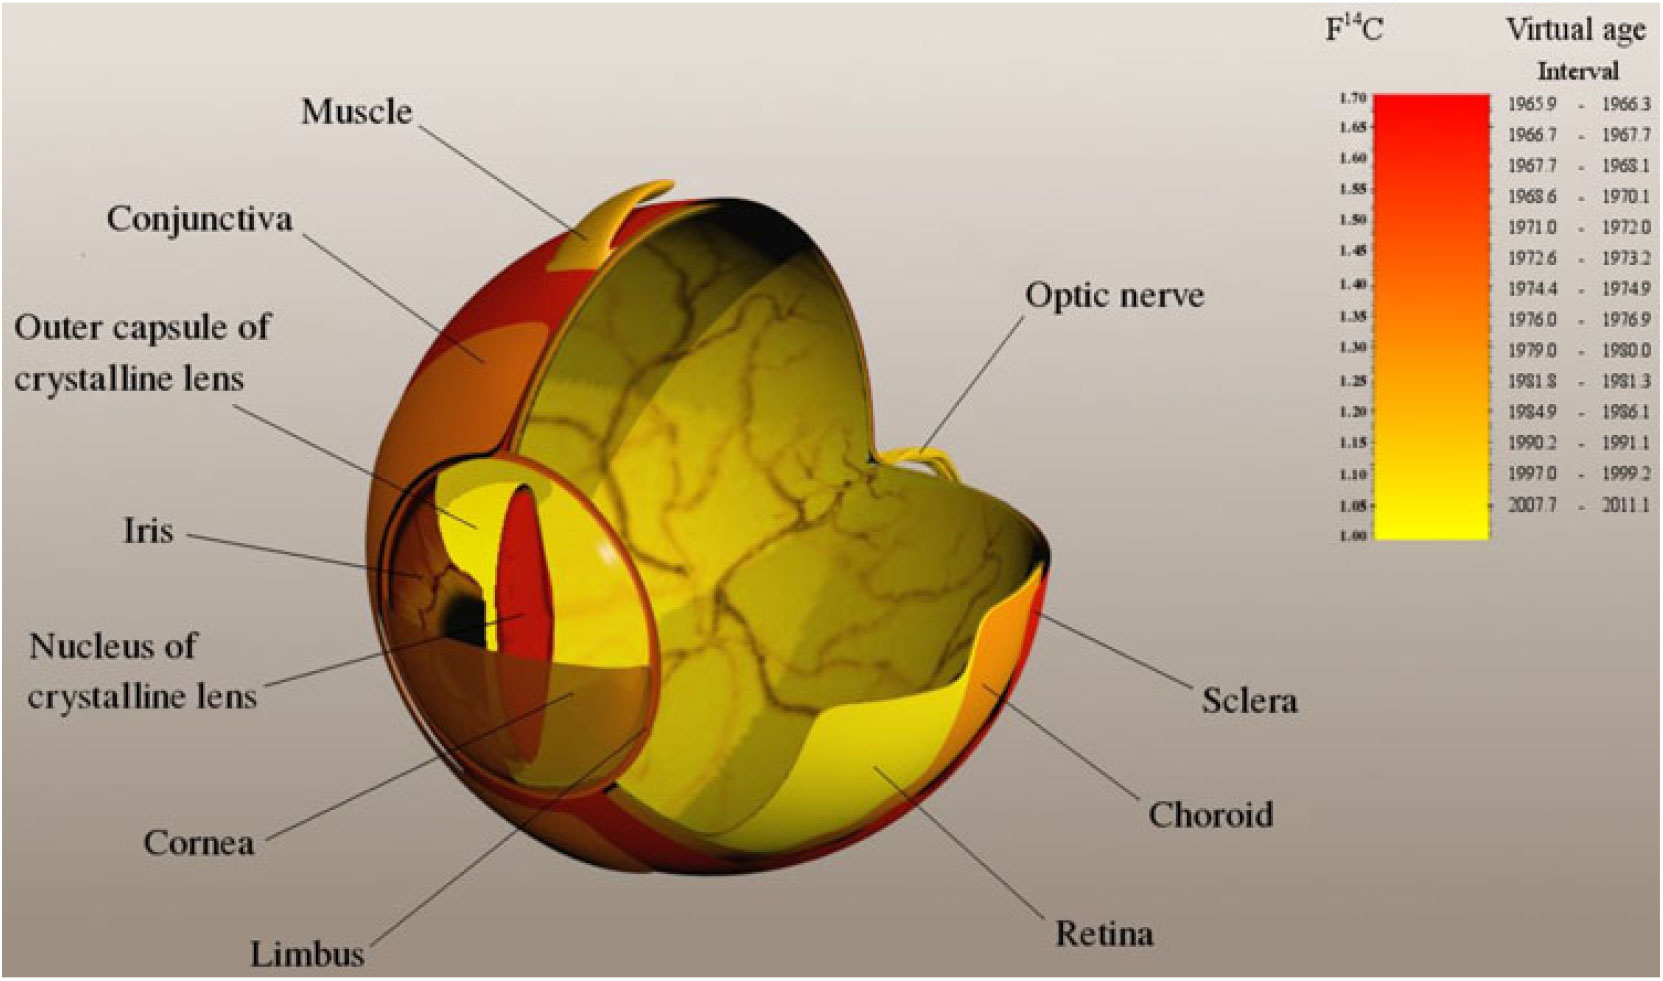
Finally, considering the anatomical location and spatial relationship of the tissues of different virtual ages an interesting picture emerges (Figure 2). As we move from the outer parts towards the inner parts of the eyeball, with the exception of the nucleus of the crystalline lens, the virtual age of tissues is getting lower and lower. The oldest parts of the eye are the sclera, the limbus and the cornea, in this order, whereas further inside we reach the retina, which is the youngest tissue of the human eye. These findings significantly modify current concepts of eye development in terms of the evolution times of different tissue types. The main developmental process conjectured here using the 14C technique is compatible with a delayed maturation of the tissues as we move from the outer parts towards the inner parts of the eyeball with the exception of the outer capsule of the lens. These data add further information to the understanding of postnatal development of the eye.

Figure 2 14C map of a bomb-peak labeled human eye. The gamut represents the 14C content (in F14C unit) and virtual age interval. The darker color means higher 14C concentration and higher virtual age. Virtual age is defined as the calibrated calendar date in which the atmospheric 14C concentration was the same as measured in the given tissue.
CONCLUSIONS
The measured 14C content of the samples confirmed that the completion time and the rate of formation, substitution and realignment of the tissues vary widely. In the eye there are tissue types in which developmental changes rapidly slow down and reach steady state. For each tissue type, the above changes take place during a characteristic time interval. The virtual 14C ages which were determined from the measured 14C content have an ultimate importance in confirming tissue specific evolution of the human eye. The younger virtual age as well as lower F14C value means that the given tissue maintains higher relationship with the nutrient transport and/or it has tighter connection with the blood vessel system. It may indicate that tissues that are virtually younger have a higher flow of contemporary nutrients into the cells. For example, the younger value of the retina could be explained by a higher fraction of contemporary nutrients than e.g. in the lens, which should have no flow of nutrients into it. Based on our 14C measurements, i.e. the amount of 14C, the oldest parts of the human eye are the nucleus of the crystalline lens, the sclera, the limbus and the cornea. Conversely, the youngest tissue of the human eye is the retina as has been suggested by traditional developmental studies. As a next step of this study DNA analysis of specific cell types could help to estimate the average age of the cells.
ACKNOWLEDGMENTS
This work was supported by the European Union and the State of Hungary, co-financed by the European Regional Development Fund (GINOP-2.3.2.-15-2016-00009 “ICER”) and the Hungarian Brain Research Program (NAP2, 2017-1.2.1-NKP-2017-00002). The authors would like to thank Judit Orsovszki for the creation of Figure 2. None of the authors has any potential financial conflict of interest related to this manuscript.