


INTRODUCTION
The southern African Later Stone Age (LSA) is defined on the basis of stone artifact assemblages. Most LSA research is couched in terms of a well-defined succession of lithic industries, which seem to occur more or less simultaneously across the subcontinent (e.g. Lombard et al. Reference Lombard, Wadley, Deacon, Wurz, Parsons, Mohapi, Swart and Mitchell2012). This sequence was in large part first recognized and defined by changes in lithic technology observed in several key sites in southernmost Africa, including Nelson Bay Cave (Deacon Reference Deacon1984), Boomplaas (Deacon Reference Deacon1979), Kangkara (Deacon Reference Deacon1984), Melkhoutboom (Deacon Reference Deacon1976), and Byneskranskop 1 (Schweitzer and Wilson Reference Schweitzer and Wilson1982). Although the sequences of lithic changes are clear, none of these sites is dated comprehensively enough or with sufficient precision to evaluate whether technological changes appear simultaneously or diachronically across the region. Given the marked environmental gradients and the extensive area over which similar LSA industries are found, their apparent synchrony across the subcontinent warrants closer investigation and testing. Moreover, the valuable paleoenvironmental records recovered from these sites (e.g. Klein Reference Klein1976; Avery Reference Avery1982; Scholtz Reference Scholtz1986; Sealy Reference Sealy1996; Faith Reference Faith2013) can be of only limited use in comparison with global and regional climate and environmental records without precise chronologies with which to correlate them to one another and to regional climate shifts.
BACKGROUND
The southern African LSA technological sequence is widely considered as well characterized, with all varieties of toolmaking over the last ~25 ka accommodated within the current schema (see Table 1; Lombard et al. Reference Lombard, Wadley, Deacon, Wurz, Parsons, Mohapi, Swart and Mitchell2012). This stands in contrast to the Middle Stone Age, which is currently the subject of several sustained, intensive research projects addressing fundamental questions about lithic production as well as subsistence behavior, paleoenvironments, and chronology, to better understand the pathways of later modern human evolution in southern Africa (e.g. Henshilwood et al. Reference Henshilwood, Sealy, Yates, Cruz-Uribe, Goldberg, Grine, Poggenpoel, van Niekerk and Watts2001, Reference Henshilwood, van Niekerk, Wurz, Delagnes, Armitage, Rifkin, Douze, Keene, Haaland, Reynard, Discamps and Mienies2014; Wadley Reference Wadley2006; Jacobs et al. Reference Jacobs, Roberts, Galbraith, Deacon, Grün, Mackay, Mitchell, Vogelsang and Wadley2008; Lombard et al. Reference Lombard, Wadley, Jacobs, Mohapi and Roberts2010; Marean Reference Marean2010, Reference Marean2014; Mackay Reference Mackay2011; Mackay et al. Reference Mackay, Sumner, Jacobs, Marwick, Bluff and Shaw2014; Stewart et al. Reference Stewart, Dewar, Morley, Inglis, Wheeler, Jacobs and Roberts2012; Will et al. Reference Will, Kandel and Conard2014; Conard and Will Reference Conard and Will2015). By comparison, LSA technologies and behaviors are thought to be already well understood. For instance, early LSA technologies have even been explicitly linked with historical populations of Kalahari San hunter-gatherers (e.g. D’Errico et al. Reference D’Errico, Backwell, Villa, Degano, Lucejko, Bamford, Higham and Beaumont2012), as an indication of the perceived demographic and cultural continuity throughout this period.
Table 1 Southern African lithic cultural sequence, with key characteristics and approximate age range, as summarized by Lombard et al. (Reference Lombard, Wadley, Deacon, Wurz, Parsons, Mohapi, Swart and Mitchell2012).

There are, however, still major unanswered questions, especially the precise timing, mechanisms, and drivers of major technological transitions. The southern African LSA is unusual in beginning much later than comparable technological transitions in other parts of Africa and Europe. Yet, the earliest LSA assemblages observed in southern Africa are variously assigned to ages that differ as widely as 40 to 20 ka (Opperman and Heydenrych Reference Opperman and Heydenrych1990; Wadley Reference Wadley1991; D’Errico et al. Reference D’Errico, Backwell, Villa, Degano, Lucejko, Bamford, Higham and Beaumont2012), and the relationship of the unstandardized and poorly characterized “early LSA” assemblages to the better-defined Robberg, a “true” LSA industry, is not well understood. There are hints that the origins of the terminal Pleistocene microlithic Robberg technocomplex (commonly given as about 18–12 ka BP) lie in the mountainous grassland interior, but this is based on merely a handful of conventional radiocarbon dates (Vogel et al. Reference Vogel, Fuls and Visser1986; Mitchell Reference Mitchell1996; Mitchell et al. Reference Mitchell, Parkington and Wadley1998). Similarly, the transitions to the terminal Pleistocene non-microlithic Albany/Oakhurst industry, commonly given as ~12 ka BP, and subsequently to the Holocene microlithic Wilton industry at ~8 ka BP, are also dated by just a few widely dispersed, conventional 14C dates in each instance. Consequently, the age boundaries of these industries are defined only approximately across the region, and nuanced comparison of technological change between sites is impossible.
In part, the imprecision in our understanding of the timing of LSA cultural changes reflects the manner in which 14C measurements have been applied by archaeologists in the region. Calibration is surprisingly frequently overlooked, a consequence perhaps of the lack of a reliable method for calibrating Southern Hemisphere dates over longer timespans during the early years of 14C applications. Many archaeologists chose not to calibrate 14C dates and made comparisons between sites on the basis of the uncalibrated dates. However, this results in sometimes very considerable offsets between local and global data sets, and complicates, for example, assessments of climate drivers. The SHCal13 curve now exists for the Southern Hemisphere over the entire 14C timescale (Hogg et al. Reference Hogg, Hua, Blackwell, Niu, Buck, Guilderson, Heaton, Palmer, Reimer, Reimer, Turney and Zimmerman2013), removing previous barriers to calibration.
Furthermore, Bayesian statistical techniques that incorporate prior knowledge and assumptions to better constrain the range of probable values are now routinely applied in archaeological chronology research, but have yet to be widely applied to the southern African Later Stone Age record. Clearly, the prior assumptions employed will greatly affect the resulting age estimates, and so must be chosen with care and justification (Buck and Meson Reference Buck and Meson2015), but generally Bayesian methods enable the construction of more statistically robust age models (Bronk Ramsey Reference Bronk Ramsey2009a). Their application to both individual site chronologies and regional technological transitions will maximize the utility of the comparatively small 14C data set for the region.
Nowhere are these problems more apparent than at the sites of Nelson Bay Cave (NBC) and Byneskranskop 1 (BNK1) (see Figure 1). Both sites contain near-continuous LSA sequences with stone artifact assemblages characterized as Robberg through to the Post-Wilton, and the deposits at NBC extend into the Middle Stone Age. NBC, in particular, has been the focus of several foundational studies of the lifeways of LSA peoples in the region (e.g. Klein Reference Klein1972a, Reference Kleinb; Deacon Reference Deacon1984) and key in establishing the LSA technological sequence and its timing (Deacon Reference Deacon1984). BNK1 is situated at the present boundary of the winter and year-round rainfall zones and consequently the paleoenvironmental proxies contained in the site should be sensitive to past shifts in the regional weather systems. The site is thus a valuable paleoenvironmental repository (Faith Reference Faith2013). However, both sites were excavated in the 1960s and/or 1970s, and the existing chronologies are decades old, predating the adoption of many of the methodological improvements in 14C dating that are now standard. Most obviously, the dates typically have very large errors and some were measured on materials now considered unsuitable for 14C analysis (see Tables 2 and 3). In addition, the materials, contexts and pretreatment methods for the 14C analyses were not reported in detail (Fairhall et al. Reference Fairhall, Young and Erickson1976; Schweitzer and Wilson Reference Schweitzer and Wilson1982; Deacon Reference Deacon1984), making it difficult to evaluate the reliability of each date.

Figure 1 Map of the south coast of South Africa showing the locations of Nelson Bay Cave (NBC) and Byneskranskop 1 (BNK1).
Table 2 Existing conventional 14C dates from Nelson Bay Cave (Deacon Reference Deacon1984) with sample material details (reported in Fairhall et al. Reference Fairhall, Young and Erickson1976). Dates are calibrated using OxCal (Bronk Ramsey Reference Bronk Ramsey1995, Reference Bronk Ramsey2009a) and the SHCal13 calibration data (Hogg et al. Reference Hogg, Hua, Blackwell, Niu, Buck, Guilderson, Heaton, Palmer, Reimer, Reimer, Turney and Zimmerman2013), and reported at 2σ range. Dates on shell are calibrated using Marine13 (Reimer et al. Reference Reimer, Bard, Bayliss, Beck, Blackwell, Bronk Ramsey, Buck, Cheng, Edwards, Friedrich, Grootes, Guilderson, Haflidison, Hajdas, Hatté, Heaton, Hoffmann, Hogg, Hughen, Kaiser, Kromer, Manning, Niu, Reimer, Richards, Scott, Southon, Staff, Turney and van der Plicht2013), with a local reservoir of 172±59 yr calculated from Dewar et al. (Reference Dewar, Reimer, Sealy and Woodborne2012) and Southon et al. (Reference Southon, Kashgarian, Fontugne, Metivier and Yim2002).

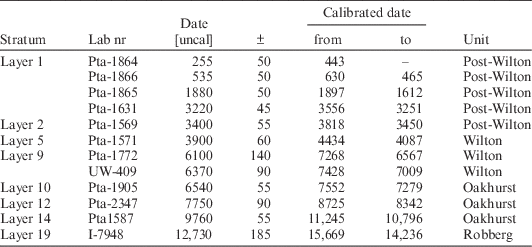
Table 3 Previously published 14C dates from Byneskranskop 1 (materials unreported; Schweitzer and Wilson Reference Schweitzer and Wilson1982). Dates are calibrated using OxCal software and SHCal13 data, reported at 2σ range.
Here, we present new accelerator mass spectrometry (AMS) 14C dates and Bayesian modeled chronologies for NBC and BNK1, both to test and supplement the existing sets of dates for these sites and to evaluate the coherence of the chronologies within the commonly accepted LSA chronological framework.
THE SITES
Nelson Bay Cave
NBC is located a few meters above the modern-day seashore on the Robberg Peninsula near the town of Plettenberg Bay (Figure 1). The upper deposits, spanning the Holocene, consist of a series of shell middens and shell-rich occupations layers (Deacon Reference Deacon1984). The underlying terminal Pleistocene levels are occupation deposits with no marine shell but good organic preservation. The levels redated here, spanning the mid-Holocene to approximately the Last Glacial Maximum (see Figure 2), were excavated in 1970/71 by Richard Klein (Klein Reference Klein1972a, Reference Kleinb) and described in detail in Janette Deacon’s doctoral thesis (Deacon Reference Deacon1984). Stratigraphic levels were identified on the basis of sedimentological changes, and the archaeological material stored according to stratigraphic level and square.

Figure 2 Generalized stratigraphy of the main layers at Nelson Bay Cave, adapted from Deacon (1978).
The chronology for the mid- to early-Holocene and Late Pleistocene levels excavated by Klein was based on 24 conventional 14C dates (Table 2), measured largely at the University of Washington laboratory and reported in Fairhall et al. (Reference Fairhall, Young and Erickson1976). Many of the dates have very broad errors, and in several instances the samples contained mixtures of marine and terrestrial derived carbon. The existing set of dates contains several inversions and some levels are constrained by only a single date. Despite the clear inadequacies of a number of the individual dates, and the inversions, the Nelson Bay Cave sequence is generally considered secure, reflected in the site’s importance for local and regional archaeological narratives. Particular problems include lack of clarity as to the timings of the transitions between layers that have yielded stone artifact assemblages characterized as Robberg, Oakhurst, and Wilton. Refining these boundaries was a focus of the present project. In addition, targeted sample selection and improved pretreatment protocols are expected to influence the age estimates of many levels, probably by extending the age of the older deposits.
Byneskranskop 1
BNK1 is a cave located on the side of the Byneskranskop hill, presently about 7 km from the coastline, in the Uilkraals River valley (Figure 1). The site was excavated by Frank Schweitzer and a team from the South African Museum (now Iziko South African Museum) in 1974 and 1976 and contains a wealth of well-preserved organic material, including remains of large and micromammals, charcoal, and shellfish. The poorly stratified deposits were originally divided into 64 stratigraphic units based on sedimentological features, and subsequently aggregated into 20 levels (Figure 3) (Schweitzer and Wilson Reference Schweitzer and Wilson1982). The deposits span the terminal Pleistocene to the late Holocene, with a complete lithic sequence from the Robberg to the ceramic LSA, and thus comparable to the NBC sequence. The existing chronology of the site (see Table 3) is based on 12 conventional 14C dates produced in the 1970s that span the recent Late Holocene back to ~12 ka BP. The dates were reported in minimal detail (Schweitzer and Wilson Reference Schweitzer and Wilson1982), with little information available about sample material, pretreatment protocols, or detailed stratigraphic information. There are several long gaps in this chronology, but the relative paucity of dates makes it unclear whether they represent true occupational hiatuses, or result from changing intensity of occupation through the sequence. The aim of this redating project was thus principally to constrain the ages of the undated levels and to confirm the existing dates, as a foundation for comparisons with NBC and the regional technological sequence.

Figure 3 Stratigraphy of squares 29 and 30 at Byneskranskop 1, on the O-N line, adapted from Schweitzer and Wilson (Reference Schweitzer and Wilson1982).
MATERIALS AND METHODS
Materials
Fourteen new dates were acquired for NBC from bovid long-bone shaft fragments and 12 new dates were acquired for BNK1 from tortoise carapace fragments. Both collections are accessioned at the Iziko South African Museum in Cape Town where they are stored in paper bags. No consolidants or chemicals were used on the bones for conservation.
Pretreatment and Measurement
The Oxford Radiocarbon Accelerator Unit (ORAU) extraction method for bone collagen, with ultrafiltration, was used (Brock et al. Reference Brock, Higham, Ditchfield and Bronk Ramsey2010). Only samples with >1% collagen yield and C:N ratios in the range 2.9–3.6 were passed for graphitization. Graphite was produced using the method of Bronk Ramsey and Hedges (Reference Bronk Ramsey and Hedges1997) and dated on the ORAU HVEE AMS system (Bronk Ramsey et al. Reference Bronk Ramsey, Higham and Leach2004). The greater sensitivity of accelerator mass spectrometry (AMS) systems permits measurement of considerably smaller samples than required for conventional beta-counting measurements, and typically produces more accurate and precise dates.
Calibration and Bayesian Modeling
The 14C measurements were calibrated using the software OxCal v 4.2 (Bronk Ramsey Reference Bronk Ramsey1995, Reference Bronk Ramsey2009a), using the SHCal13 calibration curve for the Southern Hemisphere (Hogg et al. Reference Hogg, Hua, Blackwell, Niu, Buck, Guilderson, Heaton, Palmer, Reimer, Reimer, Turney and Zimmerman2013) and the Marine13 curve, where the old conventional dates are based on shell (Reimer et al. Reference Reimer, Bard, Bayliss, Beck, Blackwell, Bronk Ramsey, Buck, Cheng, Edwards, Friedrich, Grootes, Guilderson, Haflidison, Hajdas, Hatté, Heaton, Hoffmann, Hogg, Hughen, Kaiser, Kromer, Manning, Niu, Reimer, Richards, Scott, Southon, Staff, Turney and van der Plicht2013). The dates were also modeled according to Bayesian statistical principles in OxCal, using stratigraphic information from the Deacon (Reference Deacon1984) and Schweitzer and Wilson (Reference Schweitzer and Wilson1982) monographs for NBC and BNK1, respectively.
RESULTS AND DISCUSSION
Nelson Bay Cave
The 14C measurements for NBC are presented in Table 4, together with the calibrated range (at 2σ) and δ13C values based on isotope ratio mass spectrometry measurements. The new dates for NBC are largely consistent with the old chronology (Table 2), although the new information modifies the existing interpretation of the technological sequence (Deacon Reference Deacon1984) and the paleoenvironmental reconstruction based on the faunal assemblage (Klein Reference Klein1972a, Reference Kleinb) in several instances (see modeled results in Figure 4).

Figure 4 Bayesian modeled 14C dates from Nelson Bay Cave, indicating the unmodeled age distributions in light shading and the modeled ranges in dark shading. The OxA dates colored green (online version only) are the new AMS dates reported in this study. The conventional dates UW-162 from CS, UW-178 from BSBJ, UW-181, and UW-184 from Rice B and UW-179 from Rice A were identified as outliers and excluded from the model. Not shown in this image are the OxCal Boundaries at the beginning and end and between each Phase.
Table 4 AMS dates on bone collagen (bovid long bone shaft fragments) from Klein’s excavation at Nelson Bay Cave, with %C and δ13C. Dates are calibrated using the SHCal13 curve (Hogg et al. Reference Hogg, Hua, Blackwell, Niu, Buck, Guilderson, Heaton, Palmer, Reimer, Reimer, Turney and Zimmerman2013), and reported to 2σ, rounded outwards to 5 yr.

The age of the lowest LSA level, YGL, is extended by ~500 yr to 19,110±110 BP, making it one of the oldest dated Robberg lithic assemblages in southern Africa, and the earliest assemblage in the southern Cape. The two earliest dated Robberg assemblages are located in the Lesotho highlands, at Melikane (Pta-1407, 20,200±150 BP) and Sehonghong (Pta-6281, 19,400±200 BP) (Vogel et al. Reference Vogel, Fuls and Visser1986; Mitchell Reference Mitchell1996). The new dates for layer YGL hint that the presence of the earliest dates (i.e. the apparent origin of) the Robberg in the interior, grassland region of the subcontinent may simply reflect the frequency of well-dated assemblages there, and the pattern may change as other sites across the region are reliably dated. Alternatively, if the Robberg does first appear in the Lesotho highlands, then the technology spread even faster across the subcontinent than previously realized. Thus, the apparent contemporaneity of the Robberg in these widely dispersed sites has implications for models of the origin and spread of terminal Pleistocene microlithic bladelet technologies across southern Africa.
The new date for layer YSL at 14,715±65 BP is ~2 ka younger than the previous date for this level. This date confirms the discontinuity between YSL and the overlying levels, but indicates that any hiatus was briefer than previously realized, and that the site was possibly occupied more continuously during the terminal Pleistocene. The new date also affects interpretations of terminal Pleistocene megafaunal extinctions in southern Africa: the last appearance of an extinct giant Megalotragus species occurs in this level (Klein Reference Klein1972a, Reference Kleinb), and so the species may have persisted for longer than the previous date for this level suggests. A direct date for this specimen would help clarify the timing of this extinction event.
The new dates for layers GSL (Oakhurst) and BSL (Robberg) were undertaken to try to clarify the dating inversion in these levels, under the assumption that one or more of the existing conventional dates was erroneous, and to better constrain the age of the Robberg/Oakhurst transition at this site. However, three new dates for these levels confirm and extend the inversion, indicating that the stratigraphy in these levels is inverted or mixed. Although the excavation report makes no mention of any mixing, Mitchell’s (Reference Mitchell1988) subsequent assessment of the lithic assemblage suggested that the material from both levels be considered transitional as it reflects a combination of features. The new dates instead indicate that the assemblages may be a mix of Robberg and Oakhurst material. This interpretation, however, conflicts with Klein’s (Reference Klein1972a, Reference Kleinb) observations of a major turnover in the faunal assemblage between BSL and GSL, which he dated at ~12,000 BP and suggested reflected the onset of the Holocene. If BSL and GSL are mixed, then the faunal assemblages should not differ so markedly between the two levels. The evidence for mixing of the stratigraphy also confounds interpretations of the final appearance of the extinct giant buffalo, Pelorovis sp., which occurs in GSL.
New dates for layers Rice B (Oakhurst) and Rice A (Wilton) were undertaken to better constrain the age of the transition between the Oakhurst and Wilton. Previously, Deacon (Reference Deacon1984) suggested that the base of Rice A likely dated to ~7 ka BP, disregarding a date of 9080 ± 185 BP on marine shell. The underlying Rice B was dated to ~8.5 ka BP, more than 1000 yr earlier, providing a very uncertain estimate of the timing of the transition. A new 14C date for Rice A (8281±38 BP) now confirms that the Wilton begins relatively early at this site (at least 9400–9032 cal BP). In addition, two new dates for layer Rice B, constrain the age of this layer to ~9500 cal BP, suggesting that the transition between the Oakhurst and Wilton occurred relatively rapidly at NBC.
Figure 5 shows modeled Date results for two Sequence models produced in OxCal: the upper model includes only the previously published dates, while the lower model incorporates the new AMS dates. Also shown are the modeled values at the 2σ range. In both instances, the model would not run initially due to the inversion in layers BSL and GSL, so these two levels have been combined, assuming that the stratigraphy in these levels was misunderstood. Further, not all the previously published dates reported in Table 3 are included in these models as several were identified as outliers: UW-162 from CS, UW-178 from BSBJ, UW-181 and UW-184 from Rice B and UW-179 from Rice A were excluded, according to the indice method in OxCal (Bronk Ramsey Reference Bronk Ramsey2009b). In general, the additional dates better constrain the modeled age estimates for the levels, even where the new dates are very different from the old dates (e.g. level YSL). The improved estimates reflect the improved errors of the AMS dates and the effect of additional ages in the model.

Figure 5 Modeled Date functions for the stratigraphic levels at Nelson Bay Cave, based on the 14C dates published in Deacon (Reference Deacon1984) (top); and incorporating 14 AMS dates from this study (bottom). The number of individual 14C dates included in each level is indicated in brackets and the modeled age is provided at the 2σ range. Each level is modeled as a Phase, with a Boundary between each.
The modeled Date ranges for each level have some important implications for the timing of technological change as interpreted by Deacon (Reference Deacon1984). Most notably, according to the original chronology, the occupation sequence at NBC witnessed an apparent hiatus of approximately 2000 yr between the Oakhurst (Rice B) and Wilton (Rice A), and although Deacon observed continuities between the assemblages in these levels, she also noted that the hiatus served to accentuate the differences in these assemblages. Her reasoning suggests that the division of Rice A and Rice B assemblages into separate industries may have been at least partly justified by the temporal framework with which she was working, now known to be continuous over that period. Indeed, the updated chronology instead shows a rapid transition between the two levels. In addition, Deacon’s interpretation of technological change from the Robberg to the Albany between levels GSL and BSL is challenged by the new dates for these levels that show that the stratigraphy between these levels was mixed. Consequently, the earliest securely dated Oakhurst assemblage at NBC comes from level CS, with a modeled age of 12,174–11,669 cal BP at the 2σ range.
Byneskranskop 1
The AMS 14C measurements from BNK1 are presented in Table 5, together with the calibrated range (at 2σ) and δ13C values. Dates OxA-32675 and OxA-32676 are repeats of the same sample, undertaken for quality assurance purposes. The % collagen yield for OxA-32684 was below 1%, but the C:N ratio is within the range for well-preserved collagen and the date is considered secure. Layers 10, 13, and 14 were originally also targeted for dating, but unfortunately samples from these levels did not yield sufficient collagen.
Table 5 AMS dates on bone collagen (tortoise carapace fragments) from Byneskranskop 1, with %C and δ13C. Dates are calibrated using the SHCal13 curve (Hogg et al. Reference Hogg, Hua, Blackwell, Niu, Buck, Guilderson, Heaton, Palmer, Reimer, Reimer, Turney and Zimmerman2013), and reported to 2σ, rounded outwards to 5 yr.

Schweitzer and Wilson (Reference Schweitzer and Wilson1982:21) describe the stratigraphy generally as “poor,” and note the possibility that some levels may have been miscategorized. The general coherence of the stratigraphy is confirmed with the new set of AMS dates (see Figure 6), although several inversions in the dates may indicate some mixing. Bayesian models can identify incongruities in the age sequences: in particular, the new ages for Layer 6 (OxA-32679) and Layer 11 (OxA-32683) are not accepted in the model and are highlighted as outliers according to the indice method (Bronk Ramsey Reference Bronk Ramsey2009b). Layer 11 is described in the site report as an “in-fill,” and Schweitzer and Wilson (Reference Schweitzer and Wilson1982) assign the lithic assemblage in levels 10–12 to a separate phase (phase 2/3), transitional between the Oakhurst (phase 2) and Wilton (phase 3), based on tool types and raw material patterning. Thus, the actual dates for these levels may reflect mixing in this part of the sequence. Unfortunately, given that these levels span the change from the Oakhurst to Wilton assemblages, the dating uncertainties undermine the possibility of studying this transition in detail at BNK1.

Figure 6 Bayesian model of 14C dates from Byneskranskop 1, with a combination of Phases and Sequences. The unmodeled age distributions are indicated in light shading and the modeled ranges in dark shading. The OxA dates colored green (online version only) are the new AMS dates reported in this study. Not shown in this image are the OxCal Boundaries at the beginning and end and between each Phase or Sequence.
The inversion between Layer 6 and Layer 7 and 8 may be explained by the following description in the site report: “In places it was difficult to determine the base of layer 6, but on the whole layer 7 was less compacted and less ashy than layer 6[...].” The comparatively tight clustering of the three dates from Layers 6, 7, and 8, is taken to indicate rapid deposition over these levels, and they are modeled as reflecting a single phase.
Two new dates for the lowest level, Layer 19, attributed to the Robberg or a transitional Robberg/Oakhurst assemblage, extend the age range of the site by more than 1000 yr, back to 17,105–16,555 cal BP. The age of the first Oakhurst assemblage in Layer 17 is dated to 14,320–13,860 cal BP. This is the earliest AMS 14C date for an Oakhurst assemblage and is the fourth earliest 14C date for Oakhurst material, after the sites of Heuningneskrans (Vogel and Marais Reference Vogel and Marais1971) and Bushman Rock Shelter (Vogel et al. Reference Vogel, Fuls and Visser1986) in the savanna biome, and Kangkara in the southern Cape (Deacon Reference Deacon1984). The calibrated range for level 17 at BNK1 is about 2000 yr before the age commonly cited for the start of the Oakhurst at ~12 ka BP (e.g. Lombard et al. Reference Lombard, Wadley, Deacon, Wurz, Parsons, Mohapi, Swart and Mitchell2012). This discrepancy highlights the importance of considering the calibrated age range, a surprisingly frequently overlooked consideration in discussions of technological change in southern Africa, and the value of more precise and accurate 14C dating methods.
CONCLUSIONS
The updated modeled chronologies for both BNK1 and NBC provide more robust age estimates for the technological and paleoenvironmental records contained in these sites. This study emphasizes the necessity of re-examining and redating important sites that were excavated decades ago, even where some of the recorded stratigraphic information has been lost. Principally, these results demonstrate that the onset of the major technological shifts in southern Africa occurred earlier than has previously been recognized. Comparing the timing of cultural and environmental shifts at different sites across the region is at present possible only in a very coarse framework. Assessing possible processes of innovation or diffusion is presently beyond our capabilities based on the small number of dates and to some degree to inadequate standards of reporting for 14C data in the discipline (see Bayliss Reference Bayliss2015). Obtaining much denser suites of precise 14C dates, coupled with routine application of calibration and statistical modeling at the local and regional scales, promises to maximize the utility of 14C data for archaeological enquiries. Regardless of whether one chooses the approach taken here, considering technological change in terms of shifts between cultural categories such as Robberg and Oakhurst/Albany, or prefers attribute-based analyses of lithic assemblages, chronological research such as this is necessary to facilitate more detailed and fruitful explorations of the southern African technological and paleoenvironmental sequence.
ACKNOWLEDGMENTS
Permissions for export and sampling were obtained from the curator of the archaeological collections at Iziko Museum and Heritage Western Cape (case number 15021902AS0219E). Thanks are due to W Black, W Seconna, and L Hutten for help accessing the collections at Iziko and VJ Hare, R Staff, M Dee, and M Wencel for help with OxCal. Research costs were supported in part by the South African Research Chairs Initiative of the Department of Science and Technology and the National Research Foundation of South Africa. The analyses were funded by the NERC Radiocarbon Facility (Archaeology), grant number NF/2015/1/11.


