


INTRODUCTION
Cosmic rays interact with the Earth’s atmosphere to produce secondary particles and also various products. These products are called cosmogenic nuclides. Carbon-14 is produced in the atmosphere by the action of secondary galactic cosmic-ray neutrons on nitrogen in the atmosphere according to the reaction 14N(n,p)14C (Burr Reference Burr2007; van der Plicht Reference van der Plicht2007). The mean production rate has been the subject of much discussion in the past, but the current consensus values are 1.6–2.0 atoms/cm2/s (Masarik and Reedy Reference Masarik and Reedy1995; Kovaltsov et al. Reference Kovaltsov, Mishev and Usoskin2012).
The atmosphere today is estimated to contain 829 Gt of carbon (Schuur et al. Reference Schuur, Druffel and Trumbore2016), equivalent to ca. 4.8×1028 14C atoms at a 14C/12C value of 1.21×10⁻¹² (Fraction modern=1.02). The amount of carbon in the atmosphere is increasing due to anthropogenic industrial emissions, and indeed has increased from 750 Gt by 10% in the last 20 years (see Schimel et al. Reference Schimel, Alves, Entwing, Heiman, Joos, Raynaud, Wigley, Prather, Derwent, Ehhalt, Fraser, Sanhueza, Zhou, Jonas, Charlson, Rodhe, Sadasivan, Shine, Fouquart, Ramaswamy, Solomon, Srinivasan, Albritton, Isaksen, Lal and Wuebbles1996; Schuur et al. Reference Schuur, Druffel and Trumbore2016). Before the industrial era, the concentration of CO2 was closer to 600 GtC, and one can calculate that the atmosphere contained ca. 3.5×1028 14C atoms (ca. 814 kg 14C). This value was relatively constant since the end of the Pleistocene. With an annual average production rate of ca. 1.8±0.2 14C/cm2/s (Kovaltsov et al. Reference Kovaltsov, Mishev and Usoskin2012), this would produce ca. 3×1026 14C atoms/yr (6.7 kg/yr).
A number of observations of rapid excursions of 14C in the tree ring records with annual time resolution have been found. The idea that solar flares can increase the production of 14C has been discussed at least since the paper of Lingenfelter and Ramaty (Reference Lingenfelter and Ramaty1970). We know from recent studies that 14C in tree rings can record apparently large excursions. These events have been demonstrated for AD 774–775, AD 994–995, 660 BC, and 3372–3371 BC (e.g. Miyake et al. Reference Miyake, Nagaya, Masuda and Nakamura2012, Reference Miyake, Masuda and Nakamura2013, Reference Miyake, Jull, Panyushkina, Wacker, Salzer, Baisan, Lange, Cruz, Masuda and Nakamura2017a; Usoskin et al. Reference Usoskin, Kromer, Ludlow, Beer, Friedrich, Kovaltsov, Solanki and Wacker2013; Jull et al. Reference Jull, Panyushkina, Lange, Kukarskih, Myglan, Clark, Salzer, Burr and Leavitt2014; Güttler et al. Reference Güttler, Adolphi, Beer, Bleicher, Boswijk, Christl, Hogg, Palmer, Vockenhuber, Wacker and Wunder2015; Fogtmann-Schulz et al. Reference Fogtmann-Schulz, Østbø, Nielsen, Olsen, Karoff and Knudsen2017; Park et al. Reference Park, Southon, Fahrni, Creasman and Mewaldt2017; Wang et al. Reference Wang, Yu, Zou, Da and Cheng2017). These four events appear to have similar structures, with a rapid rise and slow decay, although different amplitudes. The 660 BC event also rises over a longer time (~4–11 yr) compared to the other records. At 5480 BC, a different behavior is observed (Miyake et al. Reference Miyake, Jull, Panyushkina, Wacker, Salzer, Baisan, Lange, Cruz, Masuda and Nakamura2017a), but also with a rise time of approximately 10 years. Other different kinds of events at 2460 BC have already been proposed by Larsson and Larsson (Reference Larsson and Larsson2017). In the case of the most well-documented event at AD 774–775, Mekhaldi et al. (Reference Mekhaldi, Muscheler, Adolphi, Aldahan, Beer, McConnell, Possnert, Sigl, Svensson, Synal, Welten and Woodruff2015) and Miyake et al. (Reference Miyake, Suzuki, Masuda, Horiuchi, Motoyama, Matsuzaki, Motizuki, Takahashi and Nakai2015) have confirmed the nature of the event from studies of other radionuclides, by measuring 10Be and 36Cl in ice cores. Other smaller events at AD 993–994 have also been observed, initially by Miyake et al. (Reference Miyake, Masuda and Nakamura2013) and recently confirmed by Fogtmann-Schulz et al. (Reference Fogtmann-Schulz, Østbø, Nielsen, Olsen, Karoff and Knudsen2017). In addition, other events at 5480 BC (Miyake et al. Reference Miyake, Jull, Panyushkina, Wacker, Salzer, Baisan, Lange, Cruz, Masuda and Nakamura2017a) and 660 BC (Park et al. Reference Park, Southon, Fahrni, Creasman and Mewaldt2017) have been reported. There is also one report of excursions in corals growing in near-surface ocean (Liu et al. Reference Liu, Zhang, Peng, Ling, Shen, Liu, Sun, Shen, Liu and Sun2014), although this is not independently reproduced. Because the amount of 14C in the atmosphere is clearly much higher than the annual average production rate, a tremendous upsurge in production rate is needed to explain the dramatic increase in the AD 774–776 sequence (Pavlov et al. Reference Pavlov, Blinov, Konstantinov, Ostryakov, Vasilyev, Vdovina and Volkov2013; Usoskin et al. Reference Usoskin, Kromer, Ludlow, Beer, Friedrich, Kovaltsov, Solanki and Wacker2013). It is important to understand that even a twofold increase in production rate in one year (and presumably, cosmic-ray flux) would only increase the 14C in the atmosphere by less than 1%. The excursion at AD 774–775 was estimate to require a change in annual flux by a factor of 4 (Miyake Reference Miyake2014).
We know that the global magnetic field directs much of the cosmic-ray flux to latitudes >45ºN and past efforts have also stressed the importance of geomagnetic field changes to long-term measurements of 14C. It is not yet known if very rapid geomagnetic field changes, perhaps due to a coronal mass ejection (CME, e.g. the Carrington Event) can also cause 14C excursions since at least the AD 1859 geomagnetic event (Desnains and Cherault Reference Desnains and Charault1859; Shea and Smart Reference Shea and Smart2006) has not been shown to produce enough 14C to be recorded in the annual layers of tree rings (Jull et al. Reference Jull, Panyushkina, Lange, Kukarskih, Myglan, Clark, Salzer, Burr and Leavitt2014).
Carbon-14 concentrations in tree rings are used to study regular and irregular variations of the 14C production rate in the atmosphere. Almost all studies of 14C spikes measured in tree rings propose that there is a rapid change to the production rate of 14C, which must be several times the normal production rate of galactic cosmic ray (GCR). But what is the nature and origin of these excursions? Much has already been written about the specific AD 774–775 event, with estimates of the cause of this excursion, the size of potential radiation doses and the potential for these events to have effects on biological systems (e.g. Hamabaryan and Neuhäuser Reference Hamabaryan and Neuhäuser2013; Thomas et al. Reference Thomas, Melott, Arkenberg and Snyder2013; Usoskin et al. Reference Usoskin, Kromer, Ludlow, Beer, Friedrich, Kovaltsov, Solanki and Wacker2013; Cliver et al. Reference Cliver, Tylka, Dietrich and Ling2014; Eastwood et al. Reference Eastwood, Biffis, Hapgood, Green, Bisi, Bentley, Wicks, McKinnell, Gibbs and Burnett2017). However, it is impossible to understand the nature and scope of these important excursions in the 14C record without a precise chronology of these events, how often they occur and long enough to overlap with other observations and also historical accounts. It is also necessary to identify as many of these events as possible to build up a record of the periodicity and character of these events. Therefore, we need to separate external events from events that could be attributed to changes in the carbon cycle. In this paper we present (1) a new record of annually resolved 14C measurements from tree rings of sequoia (36° 35′ 5′′N, 118° 44′ 59′′W, 2100 m asl) and cedar (39°13′7′′N, 140°1′7′′E, 360 m asl) grown at similar latitudes locations near 36°N but 8600 km apart (5350 mi), and (2) identification of a new 14C excursion around 813 BC.
SAMPLES AND METHODS
We studied 14C in a series of tree rings of sequoia (Sequoiadendron giganteum) from the Laboratory of Tree-Ring Research Collection and Archives, the University of Arizona. The sampled tree specimen (#CMC-3f, Figure S1) was collected from the Circle Meadow trail in the Sequoia National Park, California. We also studied a series of tree rings from a Japanese cedar (Cryptomeria japonica) from Mt. Choukai, Japan, measured at the Nagoya University. In both cases, the wood specimens were cross-dated against the master tree-ring chronologies, annual growth layers were separated through cutting with a razor blade, and were grounded to 20-μm mesh. In the case of the cedar, biannual samples were combined. Each powdered sample was converted to holocellulose using standard procedures (Molnar et al. Reference Molnar, Janovics, Major and Orsovski2013). Sequoia cellulose samples were combusted to CO2 and converted to graphite and 14C dating was performed using the 200kV MICADAS at the Institute of Nuclear Research in Debrecen, Hungary (Molnar et al. Reference Molnar, Janovics, Major and Orsovski2013). Sample calculation and data reduction were done using the standard BATS software (Wacker et al. Reference Wacker, Christl and Synal2010). The Japanese cedar measurements were independently measured on the 3MV HVEE AMS machine at the Nagoya University, Japan.
If we know the age of the tree-ring, we can define Δ14C as:
 $$\Delta ^{{14}} C{\equals}1000(Fe^{{\lambda _{T} t}} {\minus}1)$$
where λ T is the true decay constant of 14C based on the half-life of 5730 yr, and t is the known age of the material. The fraction of modern carbon, F is defined as the 14C/12C ratio relative to 1950 AD (Stuiver and Polach Reference Stuiver and Polach1977; Donahue et al. Reference Donahue, Linick and Jull1990).
RESULTS AND DISCUSSION
New 14C Excursion Beginning at 814–813 BC
Decadal fluctuations of measured 14C age in IntCal13 show occasionally abrupt and large changes over relatively short intervals that currently are not well understood nor explained. We selected the period beginning at 835 BC because this section of the radiocarbon (14C) curve shows a large decline in the apparent age from 2750 to 2450 yr BP over the period of 100 calibrated years from 850 to 750 BC (Stuiver and Becker Reference Stuiver and Becker1993). The Belfast data in the IntCal database (Reimer et al. Reference Reimer, Bard, Bayliss, Beck, Blackwell, Bronk Ramsey, Buck, Cheng, Edwards, Friedrich, Grootes, Guilderson, Haflidason, Hajdas, Hatte, Heaton, Hoffman, Hogg, Hughen, Kaiser, Kromer, Manning, Niu, Reimer, Richards, Scott, Southon, Staff, Turney and van der Plicht2013; http://intcal.qub.ac.uk/intcal13/) show a change of 114 14C years in the 21 years from 810 to 789 BC. Our new measurement results for the period BC 823–778 are also shown in the supplement Table S1 for the giant sequoia and its Δ14C plotted in Figure 1. We note that there is an increase from about BC 814 where Δ14C is –6.5‰ to BC 804–802 (2753–2751 BP), at which point the value of Δ14C reaches +8‰, with a slow increase back to +10.6‰ at BC 778. In order to confirm our results, we have also compared the results obtained on sequoia with a comparable record from Japanese cedar, independently measured in the Nagoya laboratory. Supplemental Table S2 shows the measurements on Japanese cedar. Both results plotted together in Figure 2 clearly demonstrate that the sequoia and cedar records have a similar increase over the period, although with some differences in the fine structure.
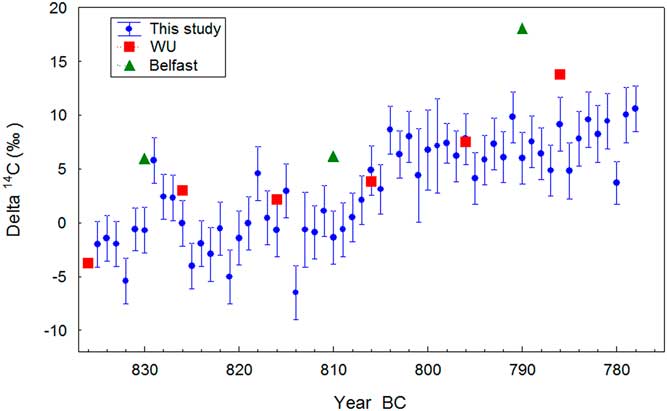
Figure 1 Details of the ∆14C measured in sequoia from 835 to 778 BC in this study. The red squares are raw data from the University of Washington (WU) and Queen’s University of Belfast (green triangles). Data from Washington and Belfast were obtained from the IntCal database (http://intcal.qub.ac.uk/intcal13/). (See online version for color figures.)
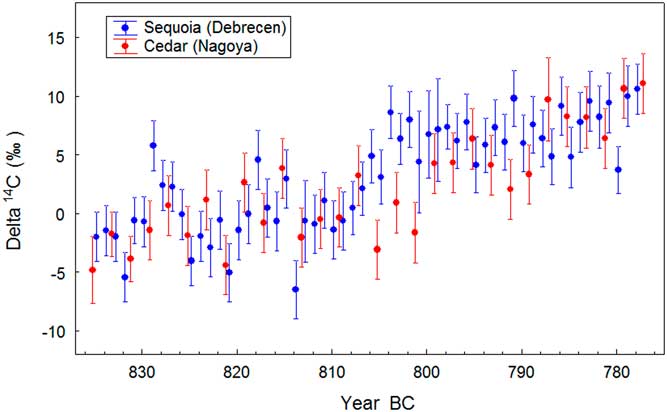
Figure 2 Comparison of the ∆14C results from sequoia and Japanese cedar.
Some interesting features are apparent if we compare the two records. Both records show what appear to be periodicities on the timescale of 10–15 years of the order of a few per mil. There is good agreement between the two datasets apart from the sequoia value at 814 BC (2763 BP). In general, the data do not show any systematic offset between the two datasets, as might be expected if there was a regional effect (Kromer et al. Reference Kromer, Manning, Kuniholm, Newton, Spurk and Levin2001; Miyahara et al. Reference Miyahara, Masuda, Nagaya, Kuwana, Muraki and Nakamura2007). Previous work (Miyake et al. Reference Miyake, Jull, Panyushkina, Wacker, Salzer, Baisan, Lange, Cruz, Masuda and Nakamura2017a) also ruled out any systematic differences between the laboratories. The only exception is that cedar data also shows a minimum at around 794–789 BC not clearly observed in the sequoia data. We postulate this could be related to solar cycles, which impact Japanese trees to a different extent that Californian ones (Miyahara et al. Reference Miyahara, Masuda, Nagaya, Kuwana, Muraki and Nakamura2007).
The structure of this excursion was compared to the 5480 BC anomaly of Miyake et al. (Reference Miyake, Jull, Panyushkina, Wacker, Salzer, Baisan, Lange, Cruz, Masuda and Nakamura2017a). We have plotted them on a comparable scale, which clearly shows considerable similarity to the 5480 BC event as shown in Figure 3. This tends to suggest a similarity in the origin of these two excursions. Figure 4 shows comparison of our results with 14C raw data of the Seattle and Belfast labs for the interval 500–900 BC included into the calibration curve. It shows the relationship between the modeling ages within the studied interval from 835 BC (2784 BP) to 778 BC (2727 BP) on a slope of the rapid decline in apparent 14C age from about 800 to 700 BC. We also compare the 660 BC event of Park et al. (Reference Park, Southon, Fahrni, Creasman and Mewaldt2017), which interrupts the flat feature of constant 14C age for the period 700–500 BC. In order to understand the relationship to Δ14C, we show the same period in Figure 5 and add the 660 BC event studied by Park et al. (Reference Park, Southon, Fahrni, Creasman and Mewaldt2017) on the same scale. There is a marked peak in Δ14C in the IntCal data at 751 BC (2700 BP) followed by a relatively constant decline in Δ14C across this time (see also figure 3 of Miyake et al. Reference Miyake, Masuda, Nakamura, Kimura, Hakozaki, Jull, Lange, Cruz, Panyushkina, Baisan and Salzer2017b). Park et al. (Reference Park, Southon, Fahrni, Creasman and Mewaldt2017) already noted this phenomenon, showing the decline of Δ14C from +20 to −10‰ over the 200-year span from 750 to 550 BC (which can be seen in Figure 4), although this is punctuated by an increase in Δ14C at about 660 BC. We note that the decline of 30‰ in 14C effectively cancels the increase in 14C over 200 years with a decrease in 14C age equivalent to 240 years in the younger (550 BC) sample. This effect causes a relatively flat period in apparent 14C age, as has been noted by earlier studies and referred to as the Hallstatt period (Friedrich and Henning Reference Friedrich and Hennig1996; Grabner et al. Reference Grabner, Klein, Geihofer, Reschreiter, Barth, Sormaz and Wimmer2007; Jacobssen et al. Reference Jacobssen, Hamilton, Cook, Crone, Dunbar, Kinch, Naysmith, Tripney and Xu2017).
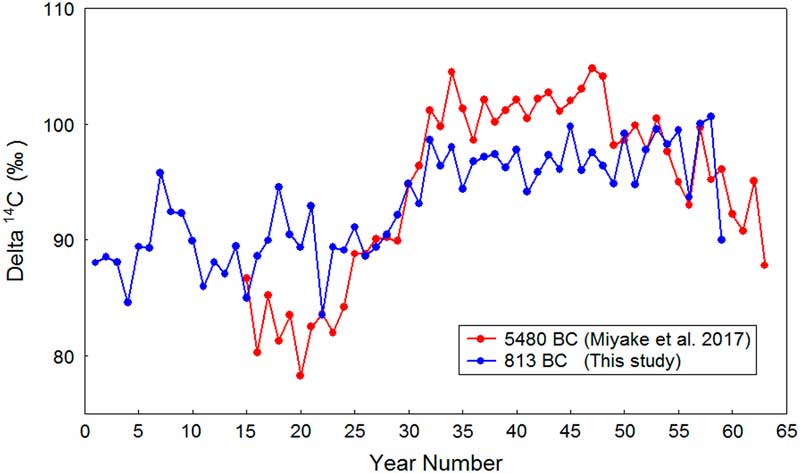
Figure 3 Comparison of the increase in ∆14C for the sequoia samples and the 5480 BC event (Miyake et al. Reference Miyake, Jull, Panyushkina, Wacker, Salzer, Baisan, Lange, Cruz, Masuda and Nakamura2017a). The ∆14C results from sequoia beginning at 835 BC are plotted with an offset of +90‰ to compared the two plots.
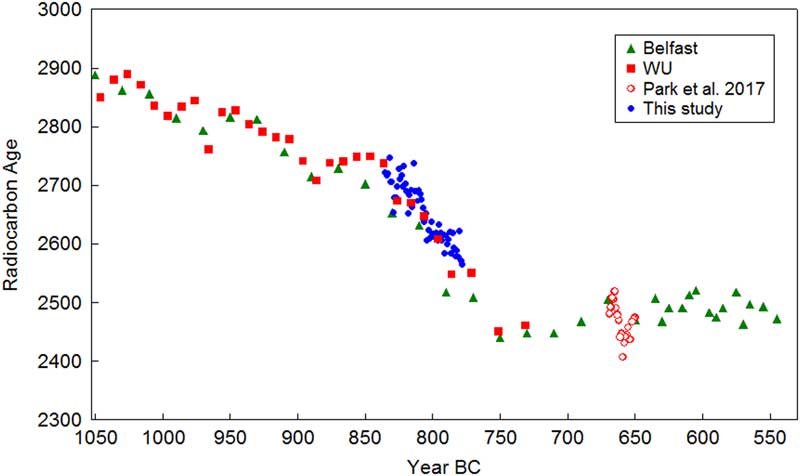
Figure 4 Plot of 14C age vs. calibrated age for the period 1000–500 BC. The points shown are from University of Washington (red squares), Queen’s University of Belfast (green triangles), Park et al. (Reference Park, Southon, Fahrni, Creasman and Mewaldt2017) (open red circles), and our new results (sequoia: solid blue circles). Data from Washington and Belfast were obtained from the IntCal database (http://intcal.qub.ac.uk/intcal13/).
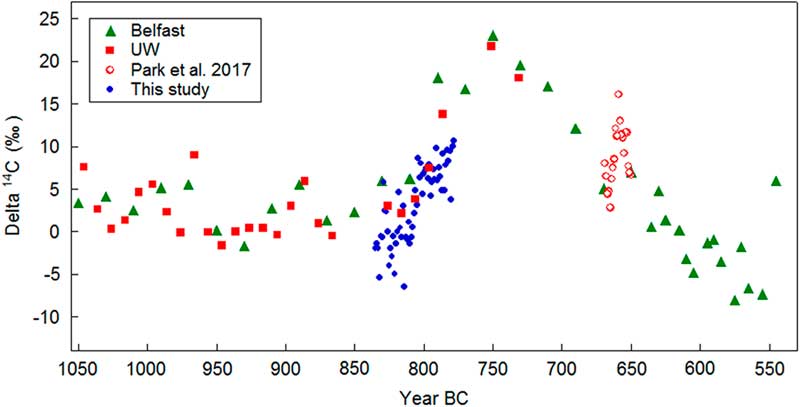
Figure 5 Plot of ∆14C vs. calibrated age for the period 1000–500 BC. The points shown are from University of Washington (solid red squares), Queen’s University of Belfast (solid green triangles), Park et al. (Reference Park, Southon, Fahrni, Creasman and Mewaldt2017) (open red circles), and our new results (solid blue circles). Data from Washington and Belfast were obtained from the IntCal database (http://intcal.qub.ac.uk/intcal13/).
To continue our comparison with the 660 BC event (Park et al. Reference Park, Southon, Fahrni, Creasman and Mewaldt2017), we note the rise time of that event is about 11–12 years between BC 667.5 to 659.5, similar to the increase observed in 814–804 BC and the 5480 BC event (Miyake et al. Reference Miyake, Jull, Panyushkina, Wacker, Salzer, Baisan, Lange, Cruz, Masuda and Nakamura2017a). The 660 BC event of Park et al. (Reference Park, Southon, Fahrni, Creasman and Mewaldt2017) is an increase followed by a rapid decline, in contrast to the 5480 BC event and our new event presented here. However, as noted by Park et al. (Reference Park, Southon, Fahrni, Creasman and Mewaldt2017), that event is on a trend of declining ∆14C. Our excursion of 814–802 BC occurs during a period of increasing ∆14C from −4.05‰ to 22‰, between 846 and 751 BC (2795 and 2700 BP). This period then declines very gradually in the IntCal record back to about 0‰ at 2540 cal BP (see Figure 5). This gradual decrease is the reason for the apparently shift to younger 14C ages about 750–850 BC. The increase over the period of 814–799 BC is almost 14‰, which then declines over the next 11 years, reaching a peak of 9.8‰ at 791 BC and similarly ~9.5‰ at same peak again at 780–782 BC, exhibiting a periodicity similar to a solar cycle of 10–12 yr.
Park et al. (Reference Park, Southon, Fahrni, Creasman and Mewaldt2017) already have discussed that the ∆14C declined prior to the subsequent increase they observed over approximately 7–10 yr between 669 and 660 BC, a similar increase of ~12–13‰, although it is important to note this is part of the long-term ∆14C decline from 2700 to 2450 BP. The difference with the peak of Park et al. (Reference Park, Southon, Fahrni, Creasman and Mewaldt2017) and the event at 814 BC is that the former declines in a similar time-scale, whereas the ∆14C after 814 BC declines at a similar rate, but against a backdrop of generally increasing ∆14C, masking the effect. Our new results are less dramatic than the 660 BC event. Although the changes in slope have a similar magnitude, the peak at 660 BC is more apparent, since it occurs on a flatter part of the calibration curve. However interpreted, both these sets of data show increases and decreases occurring on the order of one solar cycle, even though the solar cycle today (e.g. Stuiver et al. Reference Stuiver, Reimer and Braziunas1998) only has an effect of a few per mil on the value of ∆14C. Hence, we must conclude either that the solar cycles had higher amplitude at this time (800–660 BC) or that there were other changes going on with the solar modulation, perhaps associated with the extended decline of ∆14C to 540 BC, which is coincident with the period of the Hallstatt 14C period (Friedrich and Henning Reference Friedrich and Hennig1996; Grabner et al. Reference Grabner, Klein, Geihofer, Reschreiter, Barth, Sormaz and Wimmer2007). As suggested by Park et al. (Reference Park, Southon, Fahrni, Creasman and Mewaldt2017) and also noted in Miyake et al. (Reference Miyake, Masuda, Nakamura, Kimura, Hakozaki, Jull, Lange, Cruz, Panyushkina, Baisan and Salzer2017b), the association of “spikes” with the onset or decline of solar minima needs further study. We emphasize that these rapid excursions of up to 12–13‰ still require a rapid change in the cosmic-ray flux on an annual basis, so that short-term phenomena such as solar flares or CME are the most likely cause.
Implications of the New 14C Excursion
There is no good explanation or clear understanding of the causes of 14C excursions shown here documented with fine annually resolved 14C measurements. Previously, solar effects were proposed for the AD 774–775 event (Miyake et al. Reference Miyake, Nagaya, Masuda and Nakamura2012; Usoskin et al. Reference Usoskin, Kromer, Ludlow, Beer, Friedrich, Kovaltsov, Solanki and Wacker2013; Jull et al. Reference Jull, Panyushkina, Lange, Kukarskih, Myglan, Clark, Salzer, Burr and Leavitt2014; Güttler et al. Reference Güttler, Adolphi, Beer, Bleicher, Boswijk, Christl, Hogg, Palmer, Vockenhuber, Wacker and Wunder2015). For our new data, the broad peak of increased 14C with a slow decline is consistent with past variations of 14C during Grand solar minima, as discussed by Miyake et al. (Reference Miyake, Jull, Panyushkina, Wacker, Salzer, Baisan, Lange, Cruz, Masuda and Nakamura2017a). Another account for our observed effects may be rapid changes in the geomagnetic field (Mazaud et al. Reference Mazaud, Laj, Arnold and Tric1991; Stuiver and Becker Reference Stuiver and Becker1993), but in our view the more rapid events must be of solar origin. Previously, Stuiver and Braziunas (Reference Stuiver and Braziunas1993a) had identified various periodicities in the ∆14C and ascribed century-scale variability to solar effects, but they ascribed a longer ~512 yr cycle to instabilities in North Atlantic thermohaline circulation. At that time, indeed, they attributed the ∆14C changes to such an effect.
Obviously, these results highlight the need for detailed study of annual ∆14C measurements in tree rings from different parts of the world. Another effect noticeable in the record at this interval is the difference between the Seattle and Belfast data on tree rings included in the IntCal curve. A series of results presented at a recent IntCal workshop (Pearson and Jull Reference Pearson and Jull2017) highlighted several periods where annual data of Bristlecone pine (Pearson et al. 2017), juniper from Jordan (Manning et al. Reference Manning, Griggs, Lorentzen, Ramsey, Chivall, Jull and Lange2018), Japanese cedar (Nakamura et al. Reference Nakamura, Masuda, Miyake and Hakozaki2017), and European oak (Wacker et al. Reference Wacker, Adolphi, Bleicher, Büntgen, Fahrni, Freidrich, Friedrich, Jones, Jull, Kromer, Miyake, Muscheler, Panyushkina, Reinig, Sookdeo, Synal, Tegel and Westphal2017) sometimes give results older than the consensus IntCal13 calibration curve. In general, these deviations appear to be in close agreement with the original Seattle data (Stuiver and Becker Reference Stuiver and Becker1993). Recently, Manning et al. (Reference Manning, Griggs, Lorentzen, Ramsey, Chivall, Jull and Lange2018) discuss some offsets in 14C age from the calibration curve in the period AD 1640–1910 of about 20, but sometimes as much as 50 years. Pearson et al. (2017) discuss similar offsets during the period 1700–1500 BC. It is clear that these small offsets, which are now more easily distinguished with AMS measurements on annual rings, warrant further investigation.
Geomagnetic Field Effects
Fluctuations of geomagnetic field intensity modulate the behavior of 14C activity. It is important to consider rapid 14C changes of the studied interval in comparison to abnormal changes in the Earth’s geomagnetic field occurring at the same time. The geomagnetic dipole moment is often expressed as the virtual axial dipole moment (VADM), which estimates the equivalent dipole required to produce the observed geomagnetic field (that varies with geomagnetic latitude) at a given location. The period 1000–500 BC is characterized by a high VADM with average values higher than today (see Figure 5 of Shaar et al. Reference Shaar, Tauxe, Ron, Ebert, Zuckerman, Finkelstein and Agnon2016), Various geomagnetic proxy records show rapid “spikes” in the geomagnetic signal at certain locations of the Northern Hemisphere. Schaar et al. (2016) discuss geomagnetic phenomena beginning about 1300 BC, which appears to be a precursor to other spikes observed in Chinese and other Far Eastern archeomagnetic samples from East Asia at around 1000 BC (Hong et al. Reference Hong, Yu, Lee, Kim, Park, Doh, Kim and Sung2013; Cai et al. Reference Cai, Jin, Tauxe, Deng, Qin, Pan and Zhu2017). Ben Yosef et al. (Reference Ben-Yosef, Tauxe, Levy, Shaar, Hagai and Najjar2009) and Schaar et al. (2011) also found geomagnetic “spikes” in 14C carbon-dated slag mounds from southern Israel dated to ~980 and 890 BC. Indeed, Cai et al. (Reference Cai, Jin, Tauxe, Deng, Qin, Pan and Zhu2017) have also reported on several apparent excursions as high as 165.8 1021Am2, compared to the average of about 100–110 1021Am2 for ~1000 BC (Cai et al. Reference Cai, Jin, Tauxe, Deng, Qin, Pan and Zhu2017), which were suggested earlier by Hong et al. (2015). Not only high VADM anomaly, Cai et al. (Reference Cai, Jin, Tauxe, Deng, Qin, Pan and Zhu2017) also report a low in VADM about 2200 BC.
Sternberg and Damon (Reference Sternberg and Damon1992) indicate that the global production rate of 14C correlates approximately with the square-root of the magnetic field intensity. Hence, a doubling of VADM should result in a reduction of 14C production by ~1.4 times. Depending on the length of time this occurred, the amount of 14C in the atmosphere might only be reduced by ~6‰ per year. Such a reduction, followed by a return to more normal production rates might be misinterpreted as an increase. The 14C curve during the period 1000–500 BC shows a gradual decline in apparent 14C age (that is, an increase in the amount of 14C) from 1000 to 800 BC with a rapid drop at 814 BC, which we have already discussed. The change from 1000 to 800 BC is ~140 years, and the drop at 814 BC alone is 114 years (a change of Δ14C of ~14‰). It would be difficult to explain this following increase in 14C production (resulting in a younger apparent age) at a time of high geomagnetic field, if it were due only to geomagnetic field variations, but a significant contribution to an explanation of 14C offsets is possible. Hong et al. (Reference Hong, Yu, Lee, Kim, Park, Doh, Kim and Sung2013) note several rapid decreases in VADM at approximately 800–700 BC and AD 700. The VADM maximum varies by location of measurement and is an estimate of the global dipole based on that location. The peak in geomagnetic VADM is about 500 BC (deGroot et al. Reference de Groot, Béguin, Kosters, van Rijsingen, Struijk, Biggin, Elliot, Hurst, Langereis and Dekkers2015; Kissel et al. Reference Kissel, Laj, Rodriguez-Gonzalez, Perez-Torrado, Carracedo and Wandres2015; Cai et al. Reference Cai, Jin, Tauxe, Deng, Qin, Pan and Zhu2017) for sample centered on the Canary Islands, consistent with a reduced ∆14C during this time.
Archaeological, Socio-Cultural, and Climatic Implications
The first millennium BC elapses one of the major technological shifts in the prehistoric world manifested through the transition from the Bronze Age to the Iron Age in Eurasia. High dynamism of socio-economic changes in the ancient communities by 800 BC culminated in the progression of new cultures (e.g. La Tène Celts in Central Europe, Scythians and Sarmatians in Eurasian Steppe, Saka in Central Asia, Yuezhi and Kushans in China) have been linked in many cases to landscape transformations, particularly, vegetation due to the climate change (Davis-Kimball et al. Reference Davis-Kimball, Bashilov and Yablonsky1995; Koryakova and Epimakhov Reference Koryakova and Epimakhov2007). For example, cooling of the Eurasian steppe is often described as the key factor leading to the shift from the Late Bronze Age (LBA) agro-pastoralism to mobile nomadism and riparian agriculture expansion of Iron Age (Davis-Kimball et al. Reference Davis-Kimball, Bashilov and Yablonsky1995; Macklin et al. Reference Macklin, Panyushkina, Toonen, Chang, Tourtellotte, Duller, Wang and Prins2015). Development and initial spread of carbon steel metallurgy (ironworking) marks the boundary between the LBA to the Early Iron Age (EIA) dated ca. 900–800 BC for most regions of Inner Asia, Near East and Europe, and ca. 500 BC for China and South Asia (LeHuray and Schutkowski Reference LeHuray and Schutkowski2005; Koryakova and Epimakhov Reference Koryakova and Epimakhov2007; Higham et al. Reference Higham, Higham, Douka, Ciarla, Kijngam and Rispoli2011). The lack of reliable chronology for the multifaceted exchange of technology during the first millennium BC has resulted in multiple dates and many different models proposed for the LBA-EIA transition.
Although the ambiguous structure of the 14C calibration curve for the transition and EIA complicates the archeological dating, using the 813 BC and 660 BC cosmogenic events as time markers may help to constrain the chronology of technological exchange and synchronization of these cultural changes. Moreover, measuring 14C on tree rings around the cosmogenic event(s) provides the opportunity to date an archaeological occurrence to a single year (Wacker et al. Reference Wacker, Güttler, Goll, Hurni, Synal and Walti2014). We note also the importance of the Hallstatt period in 14C dating (Friedrich and Henning 1997; van der Plicht Reference van der Plicht2004; Grabner et al. Reference Grabner, Klein, Geihofer, Reschreiter, Barth, Sormaz and Wimmer2007; Jacobssen et al. Reference Jacobssen, Hamilton, Cook, Crone, Dunbar, Kinch, Naysmith, Tripney and Xu2017), due to its original association with LBA mine workings at Hallstatt in Austria. Therefore, if we can improve our understanding of the detailed structure of the 14C record in this period, this also has implications for archaeological dating in this region, as well as for our understanding of solar effects on climate.
The evidence of a short-lived but extreme change of cosmic ray flux at ~813 BC followed by the onset of Grand Solar Minimum could have a noteworthy impact on the climatic variability around this time. Climate response to orbital forcing and incoming solar radiation accounts for the significant part of the long-term scale of global climate variation. Cooling of the climatic system between 800 BC and 400 BC is a distinct long-term event across the Eurasian continent related to the two prolonged intervals of low solar activity (8th BC Minimum and 4th BC Minimum) that could be comparable to the Little Ice Age (Dergachev et al. Reference Dergachev, Raspopov, van Geel and Zaitseva2004; Plunkett and Swindles Reference Plunkett and Swindles2008). Changes in the moisture variability driven by astronomical alterations of seasonal solar radiation and cyclone formation documented by geological archives suggest centennially scaled increase of precipitation over Inner Eurasia, Central Europe and other mid latitude regions of the Northern Hemisphere at that interval (Kutzbach and Gallimore Reference Kutzbach and Gallimore1988; Dergachev et al. Reference Dergachev, Raspopov, van Geel and Zaitseva2004).
It is also interesting to note the possible effects of large cosmic-ray events. Most recently it has been demonstrated that increased cosmic ionization significantly amplifies the nucleation rate of small aerosols contributing to cloud formation (Svensmark et al. Reference Svensmark, Enghoff, Shaviv and Svensmark2017). This revolutionizes our understanding of the linkages between the intensity of cosmic rays and ion-induced condensation on the short-term scale, and could have implications for anomalous behavior of thermohaline circulation (e.g. position of North Atlantic Jet and Polar Jet) and extreme precipitation during and shortly after large changes in cosmic ray intensity. Consequently, better documentation of the 813 BC event and other 14C excursions may help to pinpoint the extreme paleo-weather events) in the mid-latitude regions where the irregularity in intensity of cyclonic activity occurs in the response to a large solar-geomagnetic disturbance (Kutzbach and Gallimore Reference Kutzbach and Gallimore1988; Svensmark and Friis-Christensen Reference Svensmark and Friis-Christensen1997; Sukhodolov et al. Reference Sukhodolov, Usoskin, Rozanov, Asvestari, Ball, Curran, Fischer, Kovaltsov, Miyake, Peter, Plummer, Schmutz, Severi and Traversi2017).
CONCLUSIONS
It is clear that there are several types of rapid events in the ∆14C record (Stuiver and Braziunas Reference Stuiver and Braziunas1993a; Miyake et al. Reference Miyake, Jull, Panyushkina, Wacker, Salzer, Baisan, Lange, Cruz, Masuda and Nakamura2017a, Reference Miyake, Masuda, Nakamura, Kimura, Hakozaki, Jull, Lange, Cruz, Panyushkina, Baisan and Salzer2017b; Park et al. Reference Park, Southon, Fahrni, Creasman and Mewaldt2017 and references cited therein). The new events reported here and by Miyake et al. (Reference Miyake, Jull, Panyushkina, Wacker, Salzer, Baisan, Lange, Cruz, Masuda and Nakamura2017a) and Park et al. (Reference Park, Southon, Fahrni, Creasman and Mewaldt2017) seem to associate rapid excursions of 14C with longer-term variations caused by solar minimum-like periodicities. This is a different phenomenon from the apparently short-term and isolated ∆14C events at AD 774–775 and AD 993–994. We also confirm that the behavior of the new record from 813–778 BC is similar in behavior but different amplitude compared to the 5480 BC event. However, we need to better understand the interplay of these various perhaps overlapping series of events. We also plan to extend our study in both directions to better quantify the variations in 14C occurring in this 800–700 BC time period.
Although the rapid events so far observed indicate that a solar event, either solar flare or a CME, is the most easily understood cause for the results reported here and other similar events, the connection with solar minima is an added consideration. So far, many diverse explanations have been offered. It is likely that several different phenomena, including possible rapid changes in the carbon cycle, cannot be totally excluded, as was suggested by Stuiver and Braziunas (Reference Stuiver and Braziunas1993a, Reference Stuiver and Braziunas1993b, Reference Stuiver and Braziunas1998). It is important to try to understand the origins of these different periodicities and which ones can be correlated with external forcing due to solar effects, or whether there is the interplay of several other phenomena. The question arises whether solar flare and CME effects also directly cause other perturbations in the climate system, as some have proposed (Thomas et al. Reference Thomas, Melott, Arkenberg and Snyder2013; Sukhodolov et al. Reference Sukhodolov, Usoskin, Rozanov, Asvestari, Ball, Curran, Fischer, Kovaltsov, Miyake, Peter, Plummer, Schmutz, Severi and Traversi2017), which could make the cause-effect relationship more complex.
ACKNOWLEDGMENTS
We are grateful to the staff of the AMS laboratories in Debrecen and Nagoya for assistance with these measurements. This study was supported by the European Union and the State of Hungary, co-financed by the European Regional Development Fund in the project GINOP-2.3.2.-15-2016-00009 ‘ICER’. The work at the Nagoya University was funded by JSPS KAKENHI Grant Number JP26887019.
SUPPLEMENTARY MATERIALS
To view supplementary material for this article, please visit https://doi.org/10.1017/RDC.2018.53


