


INTRODUCTION
Dating building materials is one of the essential means for a better understanding of construction history. Previous research has shown that the reuse of bricks originating from older structures was a frequent practice (for instance: Galli et al. Reference Galli, Martini, Montanari and Sibilia2004; Bailiff et al. Reference Bailiff, Blain, Graves, Gurling and Temple2010; Guibert et al. Reference Guibert, Bailiff, Baylé, Blain, Bouvier, Büttner, Chauvin, Dufresne, Gueli, Lanos, Martini, Prigent, Sapin, Sibilia, Stella and Troja2012, Reference Guibert, Urbanová, Lanos and Prigent2019). That is the reason why we have been focusing on lime mortar dating for some years, as we consider that it is directly related to the construction (Zacharias et al. Reference Zacharias, Mauz and Michael2002; Goedicke Reference Goedicke2003, Reference Goedicke2011; Martini and Sibilia Reference Martini and Sibilia2006; Feathers et al. Reference Feathers, Johnson and Kembel2008; Gueli et al. Reference Gueli, Stella, Troja, Burrafato, Fontana, Ristuccia and Zuccarello2010; Sanjurjo-Sanchez Reference Sanjurjo-Sanchez2016; Panzeri et al. Reference Panzeri, Caroselli, Galli, Lugli, Martini and Sicilia2019; Sanjurjo-Sanchez et al. Reference Sanjurjo-Sanchez, Urbanová, Guibert, Gueli, Pasquale, Stella, Panzeri, Martini and Sibiliaforthcoming). The basic premise of mortar dating by OSL is that quartz in the sand used for making lime mortar is optically zeroed during the preparation process (optical bleaching). The moment to be dated is the last exposure of sand grains to light, before they are embedded within the masonry and hidden from light. One of the problems encountered is the frequent partial and heterogeneous bleaching of grains, and this has led us to use the single grain technique systematically (SG-OSL) (Urbanová and Guibert Reference Urbanová and Guibert2017).
Single grain dating consists of studying separately the OSL properties of many individual grains extracted from mortar samples. In general, several thousand grains are studied but only a fraction of them show measurable levels of OSL. Several tens of grains, preferably more than a hundred, are necessary to give an exploitable distribution of individual doses. We recall for non-specialists that an individual equivalent dose (ED
i
) is measured by OSL experiments. That dose, in the case of poorly bleached material, is in fact composed of two terms: a residual dose (R
i
) that is the apparent equivalent dose of the remaining geological signal in case a grain was not totally “zeroed” by light exposure during mortar-making, and an archaeological dose, which is the dose of interest for dating, that is proportional both to the time elapsed since the making of mortar (A as age) and to the corresponding intensity of the radioactivity, the individual dose-rate
 $({\dot d_i})$
, individual referring to a given grain, i:
$({\dot d_i})$
, individual referring to a given grain, i:
 $$E{D_i} =\, {{{{.}d}_i}}A + {R_i}$$
The typical results of a single grain OSL study of poorly bleached quartz grains from a lime mortar sample can be illustrated by the distribution displayed in Figure 1. To exploit this kind of data for the purpose of dating mortar by single grain OSL it was necessary to build a theoretical model. Indeed, at the time we started our investigations, in 2011, only pre-existing models appropriated to sediment dating were available (Galbraith et al. Reference Galbraith, Roberts, Laslett, Yoshida and Olley1999). These models, such as the Minimum Age Model were built in view of possible perturbations linked to the geomorphological contexts of natural sites (bioturbations, cryoturbations, etc., all processes that can move individual grains from one level to another in stratigraphy). With buildings, we do not expect such disturbances, and finding poorly bleached grains in mortar samples, in our view, is the result of the mortar making process itself and not that of post-construction disturbances inside the masonry studied.

Figure 1 Histograms of equivalent doses (EDs) of individual quartz grains for two samples illustrating the differences between a totally bleached mortar, Roman foundations of the Picasso Museum in Antibes, and a partially bleached one from ruins of the Palais-Gallien, Roman amphitheater in Bordeaux, the EDs of which are scattered over a large range of values.
Physical background and Implementation of the Exponential Exposure Distribution Model
In the following section, we review the definition of the exponential exposure distribution (EED) model (see Guibert et al. Reference Guibert, Christophe, Urbanová, Guérin and Blain2017), and we will discuss in particular the physical significance of one of the most influent parameters, the so-called Kappa factor, Κ, that characterizes the degree of bleaching of a given sample.
Back to a Grain History
To build this model, we based our approach upon the geological and archaeological history of a grain of sand, from its extraction from a sediment to its extraction by OSL specialists from a mortar sample belonging to the masonry being studied.
As is widely known, lime mortar is the product of mixing sand, lime and water. The first important step of mortar-making history is the extraction of sand from a sediment layer. This sand will become the siliceous aggregate of the future mortar. It has a geological origin and has been archaeologically processed: extracted then transported from the quarry to the work site, potentially sieved and washed, and stored before being mixed with lime. The next important step is the mixing of mortar components. This process is dynamical, meaning this is a forced mechanical operation. The last archaeological step is the setting of mortar inside the masonry of interest, the one that will be studied later by archaeologists and dating specialists.
We examine the evolution of the potential OSL signals of quartz grains during the mortar-making process. At the moment of the extraction of sand, the OSL of the minerals has some initial value which depends on the previous geological and sedimentological history. During the mortar-making process, the grains are likely to be exposed to the light, but at the first stage, we consider that extraction of important volumes of sand do not at all warranty that any sufficient exposure of all grains would reset the OSL of quartz grains homogeneously. The same is true with the storage step. In this latter case, only a thin superficial layer of the sand stack is exposed, some millimeters thick, compared with several decimeters or meters of thickness. We note that the existence of early medieval mortar mixers shows that huge quantities of lime mortar can be produced for the construction of major monuments, and it requires appropriate quasi “industrial” tools to process tons of lime and sand at the same time (Hüglin Reference Hüglin2011). So, the proportion of well-bleached grains, the expected order of magnitude of which is around several grains out of hundreds or thousands of grains, is completely insufficient to be useful for dating. Indeed, we estimate that extraction, transportation and storage of sand will result in very insufficient bleaching. Consequently, the corresponding exposure, made under static conditions, can contribute to the bleaching of a very small minority of sand grains, perhaps those of coarser grain size, as imagined by Goedicke (Reference Goedicke2003, Reference Goedicke2011), located rather at the surface of the stacks.
It is during mixing that all grains are likely to be exposed to the light at the upper surface of the mixture. This is specifically true for the grains that are set into the masonry studied and that are submitted to OSL experiments because they were extracted from the mixture and embedded into the masonry to be dated. The mobility of grains, one of the main conditions for constructing the EED model, is then ascertained. This fundamental property, mobility, induces specificities for the distribution of exposure among individual grains during mixing. We assume that the exposure mechanism for a grain is a memoryless process. That means the probability for a grain already exposed to the light to be exposed again does not vary while the mixing operation is in progress. It is widely known that a memoryless process of that type induces an exponential distribution of time of exposure among the grains (NIST 2016; Pishro-Nik Reference Pishro-Nik2016). Even if the use of mixing tools implies that many grains are forced to move simultaneously, the mobility of individual grains induces the absence of memory effects. The implicit assumption is that the duration of the mixing operation should be sufficiently long.
Parameters of the Exposure of Grains
Among minerals of interest in mortar dating purposes, we consider quartz to be the best candidate. In fact, quartz is one of the most optically sensitive species used in OSL dating, in comparison with other sedimentary minerals, like feldspars. For instance, it takes 10 s of full sunlight to reduce the initial level of OSL by a factor of 100 (Godfrey-Smith et al. Reference Godfrey-Smith, Huntley and Chen1988). More precisely, we focus on quartz grains that show a significant rapid component of the OSL decay that is assumed to follow a decreasing exponential respect to the quantity of light received. As presented by Guibert et al. (Reference Guibert, Christophe, Urbanová, Guérin and Blain2017), if L0 is the initial OSL level of a grain, we can write that the residual OSL level after an exposure Xi to the light is:
 $$L({X_i}) = {L_0}{e^{ - {X_i}}}$$
Xi is a global parameter proportional to the exposure duration relatively to the grain i, the light fluency,
 ${\Phi _\lambda }$
, and the cross section of charge detrapping leading to the rapid component of quartz OSL, sλ , as a function of the wavelength λ:
${\Phi _\lambda }$
, and the cross section of charge detrapping leading to the rapid component of quartz OSL, sλ , as a function of the wavelength λ:
 $${{X_i} = \int_0^{{t_i}} {\bigg(\int {{s_\lambda }\frac{{{d{\Phi _\lambda }}}\over{{d\lambda }}} d\lambda\bigg)\rm{dt}}} $$
After integration with respect to wavelength and time, Equation 3 becomes:
 $${X_i} = s\Phi {|_L}{t_i}$$
where sΦ|L is a constant for a given sample. Xi is proportional to the light fluency during mortar-making, provided the light spectrum remains constant. In fact, the exposure parameter X, because of its proportionality to the time of exposure, is also a random variable distributed among grains according to a decreasing exponential law. The model name derives from this property: Exposure Exponential Distribution. Thus, we characterize the state of bleaching by a specific parameter, Κ (kappa). It represents the mean value of the exposure parameter for a given sample of mortar and, in other words, for a grain having experienced an exposure equal to Kappa, the reduction of its initial level of OSL is equal to exp(-Κ).
Exploitation of Single Grain OSL Data of Mortars: Simulation of an Experimental Distribution of Equivalent Doses
Simulating a theoretical distribution of equivalent doses is a necessary requirement in order to determine the mean archaeological dose of the quartz grains in the mortar sample being studied at the end. The exploitation principle is based upon a comparison between simulated distributions of equivalent doses and the experimental ones.
Constructing a Distribution of Residual Doses
We assume that the growth of the OSL of grains with the radiation dose follows a common saturating exponential, such as:
 $$L\left( D \right) = 1\; - {e^{ - D/{D_0}}}$$
with D, the dose, L(D) the intensity of OSL the maximum of which is supposed to tend to 1 at high doses, D0 the saturation parameter of the OSL.
After an exposure X, the residual level of the OSL is given by Equation (2). By equating Equations (5) and (2), we obtain the residual dose R(X) as follows:
 $$R\left( X \right) = - {\rm{ }}{D_0}\,{\\ln} (\it{1}-{L_0}{e^{ - X}})$$
For a given exposure, the residual dose depends on D0 and L0, L0 being the initial level of the OSL of the quartz minerals from the sediment used as aggregate. We insist on the fact the term “initial” refers to the archaeological history, i.e. the level of potential OSL just before the grains were processed for mortar making. Knowing the distribution of X (exponential distribution with mean value Kappa), it is then possible to deduce the residual dose distribution. In our model, D0 is kept constant for every grain, and L0 is a unique value characterizing the initial state of the quartz minerals in the sediment.
Modeling the Archaeological Dose Distribution
At the grain size scale, the archaeological dose represents the dose acquired by a grain since the mixing of the mortar components. Grains are irradiated by alpha and beta particles, gamma photons and cosmic rays of natural radioactivity. In general, the dimensions of the sample are small compared to the range of the gamma and cosmic contributions, so that these components of the natural radioactivity experienced by the sample are constant among grains. On the contrary, the beta dose can vary widely due to the fact that the range of beta particles is around 2 mm. Heterogeneities in the beta and alpha dose rates originate from the distribution of radioactive sources inside the sample (K, U and Th) according to the mineral assemblage surrounding the quartz grains at the 2-mm scale (Nathan et al. Reference Nathan, Thomas, Jain, Murray and Rhodes2003; Thomsen et al. Reference Thomsen, Murray and Bøtter-Jensen2005, Reference Thomsen, Murray, Bøtter-Jensen and Kinahan2007; Mayya et al. Reference Mayya, Morthekai, Murari and Singhvi2006; Cunningham et al. Reference Cunningham, DeVries and Schaart2012; Guérin et al. Reference Guérin, Mayank, Thomsen, Murray and Mercier2015). In general, the local dose rate can be approached correctly by a log-normal distribution. We note that the identification of this kind of distribution is only supported by the good agreement with experimental data as opposed to the distribution of exposure that is deduced from primary physical considerations. The archaeological dose distribution is then characterized by two parameters: its mean value, AD, and the relative standard deviation of its distribution (sigma or σr).
The Equivalent Dose Distribution
To calculate a theoretical ED distribution, we use random calculations implemented by R or other software, even by excel. Below are some short statements from the dedicated R tool used in Bordeaux (EED MODEL v2.4 beta, Guibert Reference Guibert2019). The first step is the generation of a series of residual doses, using the generic function rexp():
 $$rexp\left( {Nsimul,\,rate = \it1{\rm{/}}Kappa} \right),$$
with Nsimul the number of data drawn, typically 10000, and Kappa, the exposure factor.
The residual dose distribution is obtained using the following statement:
 $$M\hskip -1.2pt{\rm{\_}}Simul\,\left[ {,\it2} \right] \lt\!\!{\hbox {-}} \left( { {\hbox {-}} D\it0^*{\\log} \left( {\it1 {\hbox {-}} Iinit^{\ast}\!{\\exp} \left( {{\hbox {-}}rexp \left( {Nsimul,\,rate = 1/Kappa} \right)} \right)} \right)} \right)$$
Where “D0” is the saturation factor for the OSL growth curve, “Iinit”, the initial state of OSL of the sedimentary quartz (Iinit corresponds to L0). This statement is strictly equivalent to the expression in eq. 6. All residual doses generated and associated temporary variables are stored in a matrix named M_Simul (or “simulation matrix”).
The second step is the generation of a series of “Nsimul” archaeological doses according to the following statement that uses the gaussian generator rnorm() of reduced centered random variables:
 $$M{\rm{\_}}S}imul[,\it1] \lt\!\!{\hbox {-}}\ Expected{\rm{\_}}Dose^*\!{\\exp} (sigma{\rm{\_}}distr^*\!\hskip 0.8ptrnorm(Nsimul))^*{\\exp} ( {\hbox {-}} 0.5^*\!(sigma\_distr \,\^\,\,\it 2))$$
In this statement, the variables “Expected_Dose” and “sigma_distr” are respectively the archaeological dose, AD in its current evaluation (the calculation is iterative), and the relative standard deviation of individual measures of the archeological doses of grains, σr.
Both series are vector summed to build a third series, that of equivalent doses, following this statement, that forms the R statement which corresponds exactly to the relation Equation (1):
 $$M{\rm{\_}}Simul\left\it[ {,3} \right] \lt\!\!{\hbox {-}}\,{\rm{ }}M{\rm{\_}}Simul\left[ {,\!\it1} \right]\ {\scale80%+}\, M{\rm{\_}}Simul\left[ {,\it2} \right]$$
In practice, a series of parameters associated with their expected properties need to be evaluated to build a distribution of equivalent doses:
-
OSL properties: exponential decay with exposure, saturating exponential growth with dose;
-
L0: initial state of OSL of the pristine sediment with 0< L0 ≤1 (the maximum value, 1, corresponds to the OSL saturation state),
-
D0: saturation parameter of the exponential growth of OSL;
-
Kappa: exposure parameter, mean value of the exponential distribution of exposure;
-
Mean value of Archaeological Dose, AD, distributed according to a Log-Normal law, with individual relative standard deviation, sigma (σr).
Practical Implementation of the EED Model
The comparison of a simulated distribution with the experimental one is the general methodology used to implement the EED Model, where the final aim is the determination of the mean archaeological dose of quartz grains extracted from mortar sample. At the very end of the dating process, the age is given by dividing the mean AD by the mean dose-rate, determined from direct measurements of radioactivity of the sample and its environment. In Bordeaux, laboratory measurements of radioactivity are performed by high resolution gamma spectrometry, with supplementary measurements of U and Th of quartz grains by ICP-MS; on site, environmental dose rate is measured by gamma spectroscopy using a NaI:Tl probe and/or Al2O3 OSL dosimeters (more details and references in Urbanová and Guibert Reference Urbanová and Guibert2017 and Guibert et al. Reference Guibert, Christophe, Urbanová, Guérin and Blain2017). We assume that the radioactivity measured by gamma spectrometry experiments in laboratory conditions on homogenized samples and by on-site dosimetry or gammametry provides the mean dose-rates experienced by grains.
From the experimental data which consist of the series of experimental equivalent doses and their associated standard deviation (initial data are treated by the software ANALYST known by any OSL user), the five parameters cited in the previous section, (i.e. L0, D0, Kappa, σr, AD) have to be determined. The EED MODEL calculation, a five-dimension problem, is currently not fully automatic. So, to start a step by step approach to determine the best fit parameters, it is necessary to give a first estimate of their values. We distinguish the parameters that could be fixed as a single value shared by all the grains at the initialization of the calculation, and those that are determined by iterative and least square techniques (Kappa, sigma, mean Archaeological dose).
Fixed Parameters: L0 and D0
We generally set the D0 parameter to a fixed value of 120Gy, which is a common one for quartz OSL (see, for instance, experiments by Heydari and Guérin Reference Heydari and Guérin2018 on calibration quartz samples). A more complete model should probably take into account the distribution of D0 among grains taken into consideration for SG-OSL dating. However, there is a dependence between D0 and Kappa, as demonstrated by Guibert et al. (Reference Guibert, Christophe, Urbanová, Guérin and Blain2017) who obtained a stable value of the archaeological dose for a given experimental series by varying D0. This result has justified (until now) taking a single value, attached to all grains.
The L0 OSL initial level can be approached from the maximum equivalent dose of the grains following the relation:
 $${L_{0m}} = \it1 - {e^{ - {D_{\max }}/{D_0}}}$$
In the cases where L0m is not satisfactory, L0 can be changed to a value within the interval [L0m, 1]. This is the case with well-bleached samples, the initial level of all grains having been erased. But, in such cases, usual treatments such as the central age model or the more recent one the average dose model (ADM) (Guérin et al. Reference Guérin, Christophe, Philippe, Murray, Thomsen, Tribolo, Urbanová, Jain, Guibert, Mercier, Kreutzer and Lahaye2017) can be also applied. In addition, we note that the initial level of OSL is taken as a constant for all grains instead of a Log Normal distribution of initial doses. Except for very low exposure (Kappa below ca. 1), there is no real need to use an LN distribution for L0. A single and unique value (Dirac distribution) is quite sufficient.
Short Summary of the Iterative Procedure Used for the Determination of the Archaeological Dose, Kappa, and Sigma
The mean archaeological dose, the essential parameter that is to be determined for dating, must be set at an initial and transient value before running the calculation. This variable is called “Expected_Dose” in our program that we note here as ~AD. There is no obvious tool to approach this parameter. It is possible to take as ~AD the median of the experimental distribution of doses, but more securely it is better to take the ED corresponding to the maximum of the histogram of individual doses in the low dose region (around 3 Gy in our Roman example BDX 15544, Figure 1), where the importance of the residual doses is lower and the density of points is maximum. What is important at this stage is to give a reasonable order of magnitude for ~AD.
To compare experimental data with simulated ones, the cumulative means of both experimental and simulated EDs are calculated. We plot the ratio between experimental and simulated mean as a function of the maximum equivalent dose taken into account in both series of data (the experimental and the simulated ones). If all parameters are fitted correctly, this ratio tends to 1 and is almost constant whatever the maximal individual dose taken into account (Figure 2). In other words, a plateau is observed. This is the key point to determine Kappa and sigma, both parameters being of primary importance. To do so, we examine the variation of the ratio experimental/simulated cumulative means within a large domain of experimental individual equivalent doses and by a least square technique, we search for the couple Kappa-sigma that provides the best plateau, i.e. the least relative variations within the largest domain of individual doses. In practice, we introduce the minimum and the maximum of both Kappa and sigma variables to be investigated, with the steps of investigation. The variance of the ratio is calculated for each couple Kappa sigma and stored in a table. A cartography of variance (called VarMap, as “variance mapping”) as a function of Kappa and sigma is drawn (Figure 3). The minimum is extracted from the VarMap table and the corresponding Kappa and sigma are returned. A new calculation of the plateau is performed, using these new values from which a new ~AD, or “Expected_Dose”, is calculated. The process is iterative and a second running of the VarMap is made, to ensure the convergence of calculations. The EED MODEL program provides the parameters that best fit the experimental distribution of EDs, from which the final value of the mean Archaeological Dose for the quartz grains taken into consideration is given (more details have already been published in Guibert et al. Reference Guibert, Christophe, Urbanová, Guérin and Blain2017 for the determination of the Archaeological Dose and the calculation of uncertainties).

Figure 2 Comparison between experimental and simulated distributions of EDs showing the plateau plot of a mortar sample from the Roman amphitheater Palais-Gallien in Bordeaux, BDX 15544. Diamond-shaped dots represent the ratio of cumulative means of experimental Equivalent Doses to that of the best fit simulated series. The associated error bars derive from the statistical standard deviation of the experimental measurements only. Open triangle dots represent the variation of the relative importance of the residual dose compared to the archeological dose respect to the maximal individual dose integrated into the calculation. In this example, above 15Gy, the major part of the OSL signal is composed of a residual component (unbleached OSL signals).

Figure 3 Research of the optimal couple of parameters kappa-sigma. Contour plot of the variance map (VarMap) obtained by calculating for diverse couple kappa-sigma the relative variance of the ratio of cumulative means of experimental and simulated series. The best fit values of Kappa and sigma correspond to the “valley” of variance using a two dimensional least square calculation (around 2.75 for Kappa, 0.25 for sigma).
RESULTS: A REVIEW OF SG-OSL DATING OF MORTAR AT THE BORDEAUX LABORATORY
Since the beginning of the mortar dating project in 2011 at the IRAMAT-CRP2A laboratory, we have demonstrated that in comparison with classical procedures single grain OSL dating is the only suitable technique to date mortar, following Goedicke’s conclusions (Reference Goedicke2003, Reference Goedicke2011). Indeed, we can evaluate the degree of bleaching from the examination of the distribution of equivalent doses from individual grains. We note that this was also the conclusion of the Milan group at the University of Milan Biccocca, department of Material Sciences, that developed SG-OSL dating of mortars at the same time as Bordeaux (Panzeri Reference Panzeri2013). By classical procedures, we mean multigrain techniques including the fine grain technique used by some authors for dating buildings in the Mediterranean area, even though some acceptable results were obtained (Gueli et al. Reference Gueli, Stella, Troja, Burrafato, Fontana, Ristuccia and Zuccarello2010; Stella et al. Reference Stella, Fontana, Gueli and Troja2013, Reference Stella, Almeida, Basílio, Pasquale, Dinis, Almeida and Gueli2018; Moropoulou et al. Reference Moropoulou, Zacharias, Delegou, Apostolopoulou, Palamara and Kolaiti2018). After an exploratory stage corresponding to a doctoral research (Urbanová Reference Urbanová2015), we started systematically applying SG-OSL in order to improve the historical knowledge of some late antique and early medieval monuments and to enter the international group on mortar dating (MODIS) that today brings together specialists of radiocarbon and OSL applied to mortars (Hajdas et al. Reference Hajdas, Lindroos, Heinemeier, Ringbom, Marzaioli, Terrasi, Passariello, Capano, Artioli, Addis, Secco, Michalska, Czernik, Goslar, Hayen, Van Strydonck, Fontaine, Boudin, Maspero, Laura, Galli, Urbanová and Guibert2017; Hayen et al. Reference Hayen, Van Strydonck, Fontaine, Boudin, Lindroos, Heinemeier, Ringbom, Michalska, Hajdas, Hueglin, Marzaioli, Terrasi, Passariello, Capano, Maspero, Panzeri, Galli, Artioli, Addis, Secco, Boaretto, Moreau, Guibert, Urbanová, Czernik and Goslar2017).
The potential of the SG-OSL dating method has already been demonstrated and published (see Urbanová et al. Reference Urbanová, Boaretto and Artioli2020 in this issue). So, instead of presenting only successful results, in the following section, we first discuss cases of failure in mortar dating by OSL, and secondly, we present a compilation of results comparing EED-SG-OSL ages and ages of reference monuments that have been studied for some years at the IRAMAT laboratory.
About the Limitation of the Potential of Single Grain OSL Dating of Mortars
The selection of grains as part of the SG-OSL procedure, is usually based on the following criteria:
-
a sensitivity that leads to a statistical error lower than 30% in individual dose determination: the level of all OSL signals from an individual grain must be significantly higher than the detection threshold, this is the first condition.
-
Positive response to recycling tests: this test selects the grains the normalized OSL intensity of which do not change significantly by the iterative processes of bleaching and re-irradiation of the OSL protocol used (Murray and Wintle Reference Murray and Wintle2000).
-
Insensitivity to infrared stimulation: the physical and chemical process of quartz selection during the preparation of the material can be imperfect, notably in case of rock fragments, i.e. polyphased grains containing quartz and feldspars, and also zircons in some cases; fragments of granite, or mica schist can be partially resistant to the etching and flotation in heavy liquids procedures (Guibert et al. Reference Guibert, Bailiff, Blain, Gueli, Martini, Sibilia, Stella and Troja2009).
-
Presence of a rapid component as the very major part of the OSL signal.
As already mentioned, a majority of quartz grains do not show a sufficient sensitivity, and in some cases, the OSL sensitivity of the material is too low to obtain a sufficient number of grains that pass the selection criteria within a reasonable duration of experiments. In such cases, the mortar sample cannot be dated. This is eventually the main cause of failure and it represents around 15% of the structures or samples studied in Bordeaux. To illustrate the difficult cases we had to deal with, we discuss some typical examples below.
At the beginning of our project, we realized that all samples collected at the early and mid-medieval foundations of Basel cathedral (Switzerland) did not exhibit quartz grains with a sufficient sensitivity, so the dating program of early phases of construction of this monument was cancelled (Urbanová Reference Urbanová2015; Urbanová and Guibert Reference Urbanová and Guibert2017). At the same time, we studied samples of mortar coming from the 9th century mortar-mixer found in the 2000s in the Basel Cathedral quarter during rescue excavations (Hüglin Reference Hüglin2011). Some samples of this structure were used by our laboratory and by that of Milan as OSL-intercomparison samples. Unfortunately, they could not be dated by SG-OSL because of the low sensitivity of quartz minerals that are likely to be of the same geological origin as those of the early foundations of the cathedral. Both laboratories gave standard OSL ages that agreed, but both OSL ages were too old in comparison with the conventional radiocarbon age obtained on charcoals extracted from the remains of mortars (Hajdas et al. Reference Hajdas, Lindroos, Heinemeier, Ringbom, Marzaioli, Terrasi, Passariello, Capano, Artioli, Addis, Secco, Michalska, Czernik, Goslar, Hayen, Van Strydonck, Fontaine, Boudin, Maspero, Laura, Galli, Urbanová and Guibert2017). These results show that the standard multigrain procedure applied in different OSL laboratories produces similar ages, and this is a very positive point, but, here, the risk is integrating in the whole OSL signal the contribution of insufficiently bleached grains, inducing an overestimation of the mean archeological dose and an overestimation of the age. This is our principal argument to explain the discrepancy between standard OSL ages and the radiocarbon ones.
Another example of insufficient sensitivity was found in a rural church, Notre-Dame de Sérignac, in the Department of Lot-et-Garonne (France). The archaeological study of this church showed precisely an early phase of construction, before the 11th century, which was followed by a later extension of the church, in the 12th century. To the interior surface of the old masonry a layer of plaster had been applied as a surface treatment of the inner walls of the earlier church. Neither this layer nor the old masonry samples exhibited quartz grains with a sufficient sensitivity to pass the selection criteria. On the contrary, the 12th century walls provided quartz grains that could be dated. We note that the composition of the aggregate of mortars from both constructions was the same, but the OSL properties of quartz were different, indicating possible differences in the sand resources, all of them coming from the river Garonne alluviums.
The last example of failure was encountered in samples of the medieval foundations of an ancient church that was dated to the Carolingian period, around the 9th century AD, by mortar SG-OSL experiments in walls and primitive cocciopesto floors in the rural village of Gironde sur Dropt in the department of Gironde (southwest of France, Nouvelle Aquitaine Region). The only quartz grains in those foundation samples that were sufficiently bright exhibited a too low proportion of bleached ones, with a Kappa value below 1. A very poor bleaching in addition to a low sensitivity of quartz OSL made these foundations impossible to date, but, on the other hand, as already mentioned, the elevated structures of the church exhibited much more favorable dating conditions, notably a better degree of bleaching and brighter quartz crystals.
As an additional remark and according to our experience, a lack of sensitivity of quartz OSL which is the main cause of dating problems can be linked with the geological origin of the quartz grains. For instance, in the Rhine valley, in Basel, we have an example of low sensitivity minerals, associated with low archaeological doses. But in other locations or sites, like in Sérignac, in the Garonne Middle valley, only the earlier masonries exhibit an insufficient sensitivity although the sources of sand seemed to be the same for all structures. So, we will avoid generalizing one-off observations regarding a whole sedimentary basin. To conclude about these potential problems, the strategy we recommend for dating is firstly to check the OSL sensitivity of quartz grains on small samples, in a very preliminary study. If the OSL response is positive, mortar samples can be dated in most cases. It is then possible to proceed with requests to the Cultural Heritage Authorities to authorize sampling and a sampling campaign can be organized.
EED-SG-OSL Dating Reference Monuments
At the present time, many chronological operations on late Roman and early medieval buildings relative to mortar dating by SG-OSL have been published by our group. They all demonstrate that mortar dating by SG-OSL is a suitable way to date monuments. In this section we focus on the results obtained by SG-OSL dating of mortars taken from well-dated monuments. Reference monuments are defined as architectural structures that were dated without any doubt by historical and archaeological approaches, and in some cases, by additional data using radiocarbon, archaeomagnetism or dendrochronology, and even by TL or OSL in earlier studies. All reference monuments studied here belong to the Roman and to the medieval or post-medieval periods, the historical periods that are well documented by texts, inscriptions and archaeological contexts. Table 1 reports data obtained on those reference structures and Figure 4 resumes the age comparison. The SG-OSL dates of the Roman structures cited have already been published (Urbanová Reference Urbanová2015; Urbanová et al. Reference Urbanová, Delaval, Lanos, Guibert, Dufresne, Ney, Thernot and Mellinand2016, Reference Urbanová, Michel, Cantin, Guibert, Lanos, Dufresne and Garnier2018; Guibert et al. Reference Guibert, Christophe, Urbanová, Guérin and Blain2017; Urbanová and Guibert Reference Urbanová and Guibert2017; Javel et al. Reference Javel, Urbanová, Guibert and Gaillard2019). They were revisited with the EED model, recently available, and the new data obtained replace the previous ones, namely those of mortars from the late Roman structure of the St Seurin crypt in Bordeaux, and from the baths at Chassenon in the Charente Department. Concerning the medieval and post-medieval structures, some of them were published recently using the EED model, such as the St Jean-Baptiste de la Cité chapel in Périgueux, Dordogne department (Javel et al. Reference Javel, Urbanová, Guibert and Gaillard2019), and Oudenaarde Abbey in Belgium (Guibert et al. Reference Guibert, Christophe, Urbanová, Guérin and Blain2017); others are original data, namely the Romanesque and Gothic walls of the St Seurin basilica in Bordeaux, and those of Sérignac church, in the Lot-et-Garonne Department.
Table 1 Single grain OSL dating of mortar from reference monuments and architectural structures. For every sample, we have indicated in Gy the range of individual doses measured, the best fit kappa and sigma parameters of the equivalent dose distribution, the total number of grains selected (N) and the number of data (n) taken into account for the mean archaeological dose calculation (corresponding to the number of data leading to the minimum value of statistical uncertainty), the annual dose-rate (mGy.y–1), the final age and standard deviation (y), and the Euclidian distance to the reference age. Complementary details are given in the references cited (more information about dose rate determination in Bordeaux in Urbanová et al. Reference Urbanová, Michel, Cantin, Guibert, Lanos, Dufresne and Garnier2018, for instance).
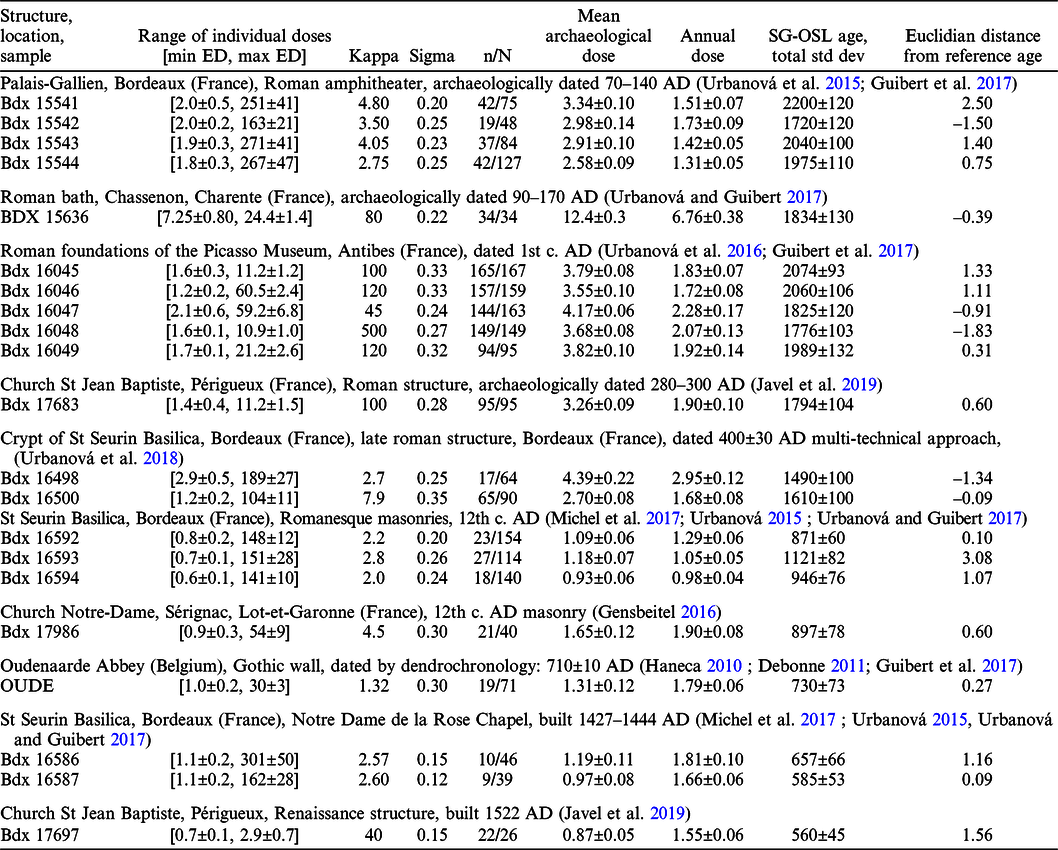

Figure 4 Age control: comparison of EED-SG-OSL ages and reference ages obtained on well-dated architectural structures.
Uncertainties given in Table 1 represent one standard deviation (including systematic errors quadratically added to the statistical ones). As a general rule, the statistical uncertainties vary according to the number of grains taken into consideration for the calculation of the cumulative means in the EED model. Competition occurs between the reduction of the measurement error with the increasing number of grains taken into account and the growth of uncertainties linked to the subtraction of residual doses, the relative importance of which increases very widely with high equivalent dose grains. As a result, we found that the statistical uncertainty passes through a minimal value and grows significantly as more and more points of higher equivalent doses are integrated in the cumulative mean calculations (see Fig. 7 in Guibert et al. Reference Guibert, Christophe, Urbanová, Guérin and Blain2017). We have indicated in Table 1, as a ratio, the number of grains corresponding to the optimal calculation of the archaeological dose and the total number of grains passing the luminescence criteria, all of them having been used to determine the parameters of the EED-Model.
To characterize the significance of the deviation between OSL ages and the expected ages, we calculated the Euclidian distance of every sample, according to the following expression that accounts for individual errors in age determination:
 $${\Delta _e}{\rm{ = }}\left( {{\rm{EED}}\,\,{\rm{SG}}\,\,{\rm{OSL}}\,{\rm{age}} - {\rm{reference\,age}}} \right){\rm{/Std}}{\rm{.}}\,{\rm{Dev}}{\rm{.}}\,{\rm{on}}\,{\rm{OSL}}\,\,{\rm{age}}$$
For normally distributed results, including a realistic estimation of uncertainties, 95% of them should be in the interval [–2, +2]. We observe only two results over 21 beyond these limits: a mortar sample from the foundations of the Palais Gallien Roman amphitheater which exhibited a very heterogeneous pattern with many gravels the size of which were larger than 2 cm (Urbanová et al. Reference Urbanová, Hourcade, Ney and Guibert2015), and another one from a Romanesque wall of the St Seurin basilica, sampled by wet drilling between the calcareous carved stones of the nave (Urbanová Reference Urbanová2015; Urbanová et al. Reference Urbanová, Delaval, Lanos, Guibert, Dufresne, Ney, Thernot and Mellinand2016). We have found some posteriori justifications about the enhancement of discrepancies with these two samples:
-
an enlargement of the expected distribution of dose-rates for the Palais-Gallien sample would have induced supplementary uncertainties that cannot be at present taken into account in our age and error calculation;
-
drilling between carved stones into the Romanesque wall of StSeurin would have mixed quartz grains coming from the stone with the collection of grains of the mortar itself. To explain the overestimation of the OSL age, we may suppose that quartz grains from the stone were not entirely bleached or less bleached than grains of the mortar aggregate. There the difficulty is to separate the limestone fragments from the mortar, during sample preparation in very dim light laboratory conditions. This is one of the points to be improved in the future in order to reduce dating uncertainties.
Apart from these two samples, more than 90% of samples checked in this series exhibit regular behavior and for us this is the best argument to demonstrate the suitability of the SG-OSL process, including the EED treatment of the data.
Regarding the Kappa factor, we note that values above ca. 100 are rare within the series of samples checked (most of the Antibes samples, the Chassenon one, the Roman structure of St Jean Baptiste in Périgueux). Well-bleached samples have Kappa factors higher than 100. For such samples, the usual procedure of CAM, or ADM (Guérin et al. Reference Guérin, Christophe, Philippe, Murray, Thomsen, Tribolo, Urbanová, Jain, Guibert, Mercier, Kreutzer and Lahaye2017) or even the standard multigrain OSL measurements can be performed without taking important risks of significant overestimation of ages. We may note that some scarce high values of dose due to important residuals should exist according to the prediction of the exponential distribution of exposure (less than ca. 1% of grains, more details in Urbanová et al. Reference Urbanová, Delaval, Lanos, Guibert, Dufresne, Ney, Thernot and Mellinand2016). Less bleached samples can be dated by single grain OSL only. In these cases, we have observed very poorly bleached samples such as those of Oudenaarde Abbey (Kappa = 1.32) and those from the foundations and the walls of the Palais Gallien in Bordeaux (from 2.75 to 4.8), and those of the Romanesque and Gothic walls of StSeurin in Bordeaux (from 2.0 to 2.8) as well. The Kappa factor is related to the exposure experienced by quartz grains during mortar-making and this is a parameter that results from the combination of lightening conditions of the mortar-making process, the photon fluency, and the duration of the mixing, that is itself related to the quality of the mixing operation. The variability of the exposure is very wide among samples studied. From these data, it seems there is no particular rule for a given period of time for the quality of bleaching, except the fact that if mortar-making is done inside a building, we expect low exposure factors, and on the contrary if the mortar is mixed outside a building, we can expect a bleaching degree in relation with the environmental light intensity. In this case, we may notice that in our series of samples, the Mediterranean ones are the best bleached in comparison with those close to the Atlantic Ocean (all from the Aquitaine Region) or to the North Sea (that of Oudenaarde Abbey in Belgium).
Conclusion
Single Grain-OSL dating of quartz grains from mortar is one of the most remarkable improvements in archaeometry in the last 10 years. Indeed, it provides a reliable solution to the problem of mortar dating. In general, the proportion of successful results are as high as 85% of samples and situations. The cases of failure are well understood, and they result from situations where OSL properties of individual quartz grains are not found appropriate: low OSL sensitivity and absence of a rapid component in the OSL signal are the major negative cases.
Thanks to a novel model that describes the distribution of exposure among grains and that is based on simple physical considerations like the mobility of grains (the exponential distribution of exposure, EED model), it is possible to date satisfactorily samples that exhibit a wide range of exposure, from a poor to a total bleaching state of quartz OSL measured on individual grains. The first qualitative gain of such an approach is the fact that internal considerations of the technique, that are based on the examination of the distribution of individual equivalent doses, indicate whether the sample was totally bleached or not. On the other hand, using standard multigrain techniques does not provide any internal information on the bleaching state of the sample being studied. The second qualitative gain is the possibility of correcting the archaeological doses from the effects of partial and heterogeneous bleaching of grains and it opens up dating possibilities for any architectural structure that has mortar as material to be dated. The final uncertainty of sample dates is the typical error of 3–10% for luminescence technique. To reduce uncertainties, a dating strategy is needed. For instance, multiplying the number of samples from a structure being studied reduces the statistical uncertainty, and more efficiently, dating a whole chronological sequence, using the stratigraphic relationships between archaeological structures and samples taken from the different structures involved in the dating program (Blain et al. Reference Blain, Guibert, Prigent, Lanos, Oberlin, Sapin, Bouvier and Dufresne2011) enhances the precision and the accuracy of the chronological sequence (Lanos and Philippe Reference Lanos and Philippe2017).
Besides dating purposes, the SG-OSL study of mortar provides a new parameter related to the light exposure conditions of the mortar-making process, the so-called Kappa factor. This parameter results from a combination of light fluency and duration of mixing. It can be considered as a quality factor for the making process and for the archaeological treatment of the sand, accounting for the environmental conditions of solar illumination. But, indeed, we need wider experience to exploit the Kappa factor as one of the quality markers for mortar-making.
Acknowledgments
We are grateful to the following institutions which helped to support this work: the CNRS, The University of Bordeaux Montaigne, the Conseil Régional de Nouvelle Aquitaine (research program: Mortar Dating in Aquitaine), the French Ministry of Culture and Communication, the labex LaScArBx (label of excellence Archaeological Sciences Bordeaux) according to the general program supported by the ANR (Agence Nationale de la Recherche) – n°ANR-10-LABX-5. Data were collected from mortars of different origins and we thank the local authorities involved that allowed us to sample those materials (Mairie de Bordeaux, Mairie d’Antibes, Direction Régionale des Affaires Culturelles d’Aquitaine, Stad Oudenaarde, Conseil Départemental de Charente). Special thanks to the referees and to the editor for their suggestions for improving this article.


