INTRODUCTION
In this study, we examine the applicability of OSL dating to Iron age deposition in Tell Damiyeh in the Jordan Valley. Luminescence dating has the potential to provide a chronological framework for archaeological deposits such as architectural structures of both fired and unfired materials (Liritzis et al. Reference Liritzis, Singhvi, Feathers, Wagner, Kadereit, Zacharias and Li2013) (recent works in the Levant; al Khasawneh et al. Reference al Khasawneh, Murray, Gebel and Bonatz2016, Reference al Khasawneh, Murray and Khalil2019b; Porat et al. Reference Porat, Jain, Ronen and Horwitz2017; Rhodius et al. Reference Rhodius, Kadereit, Siegel, Schmidt, Eichmann and Khalil2017), buried stones (Sohbati et al. Reference Sohbati, Murray, Porat, Jain and Avner2012, Reference Sohbati, Murray, Porat, Jain and Avner2015; Freiesleben et al. Reference Freiesleben, Sohbati, Murray, Jain, al Khasawneh, Hvidt and Jakobsen2015; al Khasawneh et al. Reference al Khasawneh, Murray and Abudanah2019a, Reference al Khasawneh, Murray, Thomsen, AbuAzizeh and Tarawneh2019c), undifferentiated ceramics (al Khasawneh et al. Reference al Khasawneh, Al-Muheisen and Abd-Allah2011, Reference al Khasawneh, Murray, Bourke and Bonatz2017), and other materials usually regarded as difficult to date by more conventional means (typology, 14C, etc.). Unfortunately, the uncertainties on luminescence ages are likely to be >5% of the age (Aitken Reference Aitken1998; Murray et al. Reference Murray and Olley2002). This can be a significant limitation; in young archaeological sites, human occupation and destruction layers often happen in rapid sequence. In the Levantine Iron Age (~1200–600 BCE), multiple occupation layers can be deposited within a space of 100 years; such a short period is comparable with the uncertainties in OSL ages. However, tell formations almost always contain some degree of post-depositional reworking, such as reuse of older architectural features or historical excavation in older deposits. OSL has the potential to identify such reworking, by comparing the age of the surrounding matrix with that of the buried artifact. Older materials may also be deliberately used in later construction. al Khasawneh et al. (Reference al Khasawneh, Murray, Bourke and Bonatz2017) showed that individual potsherds from an excavation at the Pella site were significantly older than both the expected age and the majority OSL age, because of the reuse of Bronze age pottery sherds.
In this study, we used quartz-based luminescence to date deposits in Iron Age occupational layers at Tell Damiyah in the Jordan valley. The luminescence characteristics are first investigated, and the resulting ages compared with both 14C dates and relative and stylistic age estimates of the same layers. Results are interpreted in the terms of the suitability of these Tell sediments for luminescence dating.
ARCHAEOLOGICAL CONTEXT AND SAMPLING
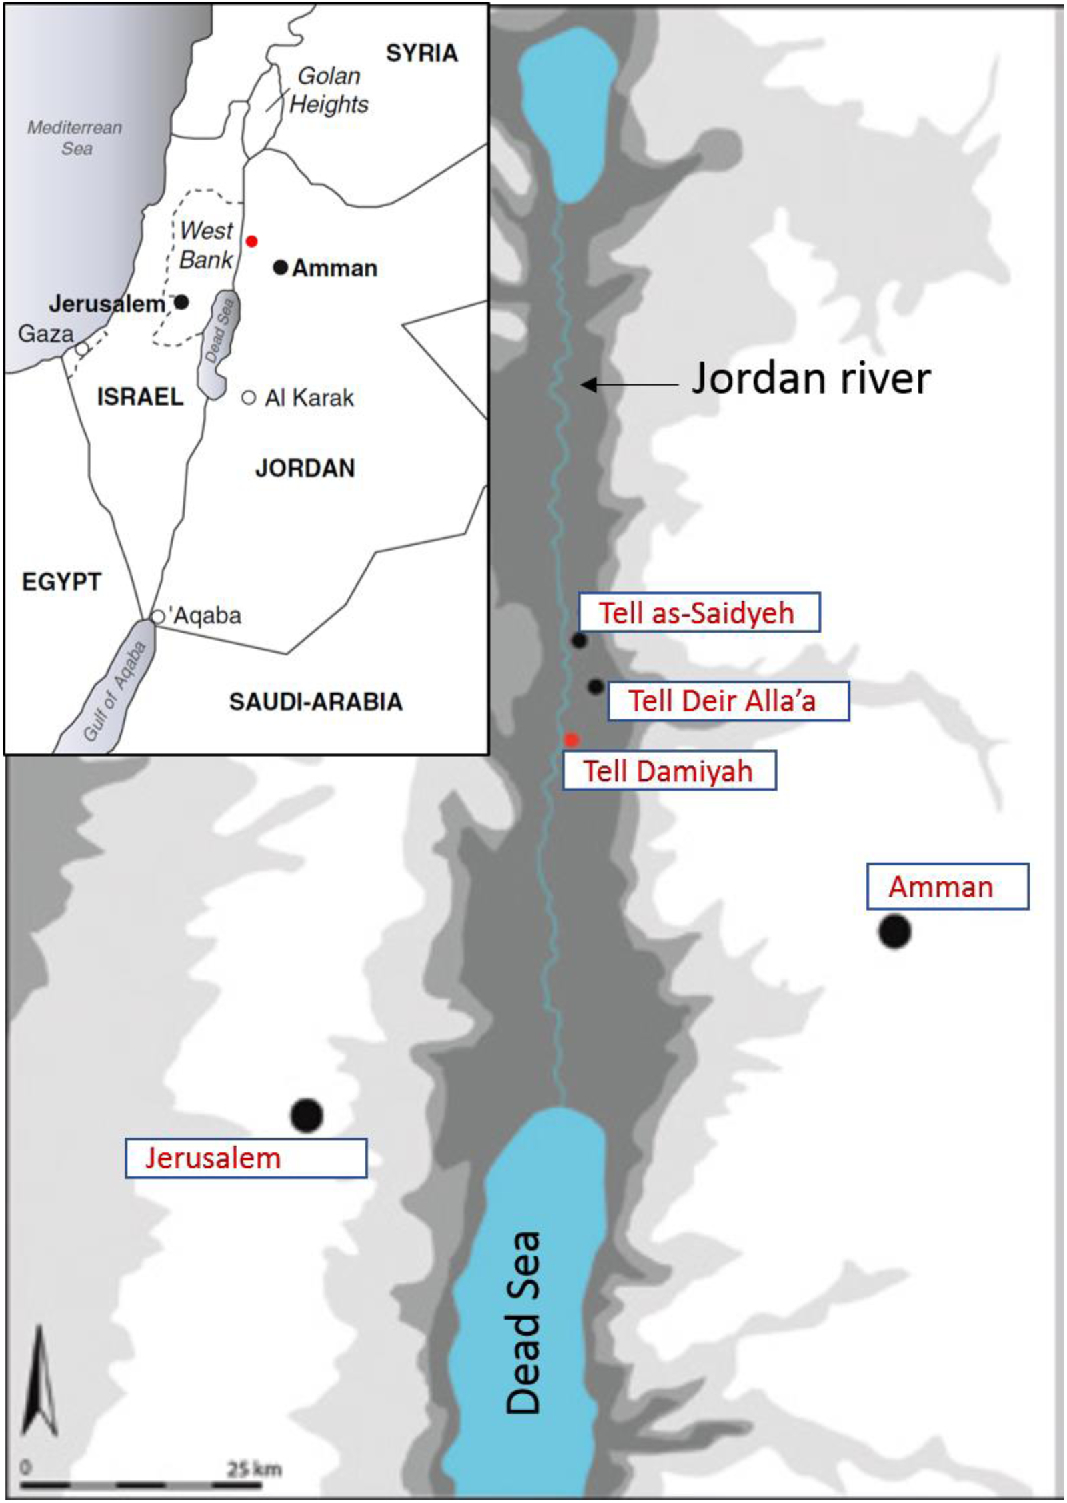
Tell Damiyah is located ~500 m east of the Jordan River in the Zor region and is surrounded by the Katar Hills (Figure 1). Tell Damiyah is an exceptional archaeological site for the Central Jordan valley; it is one of the few which show evidence of continuous occupation during the Iron Ages (1200–600 BCE) (Petit and Kafafi Reference Petit and Kafafi2016). Other sites, such as the nearby Tell Deir ‘Alla, reveal numerous occupational gaps, e.g. in the 10th and 8th century BCE (van der Kooij Reference van der Kooij2001). These periods without anthropogenic activity are simultaneous with dry climate stages, and it is argued elsewhere that the occupational pattern in the central Jordan Valley is closely related to these environmental factors (Petit Reference Petit2009). Iron Age sites in this area are located mainly along major routes such as the North-South road through the Jordan Valley (Figure 1) and especially along the East-West road between ancient Ammon and the Wadi Far’ah. Tell Damiyah seems to have been a central point on these routes, close to one of the few fords across the Jordan River. Recent excavation results suggest that the apparently continuous occupation history of Tell Damiyah had much to do with a cultic function of this site. The small settlement seems to have remained occupied even during periods of harsh climate and after destructive earthquakes (Petit and Kafafi Reference Petit and Kafafi2016, Reference Petit and Kafafi2018; Kafafi and Petit Reference Kafafi and Petit2018).

Figure 1 Location of Tell Damiyah in the Jordan Valley (adapted from Petit and Kafafi Reference Petit and Kafafi2016).
Excavations at Tell Damiyah are divided into a lower (at the western foot of the Tell) and an upper site (the summit of the Tell), together measuring about 3 ha. The upper site rises 17 m above the present surface and this is where most archaeological work has been carried out (Kafafi and Petit Reference Kafafi and Petit2018; Petit and Kafafi Reference Petit and Kafafi2018). Excavations began in 2004, as a reaction to destructive bulldozer cutting on the southern summit. The seventh season of excavation was carried out in October 2016 as a joint Jordanian-Dutch project under the directorship of Zeidan Kafafi of the Yarmouk University and Lucas Petit of the Dutch National Museum of Antiquities. Investigations took place in three areas on the southeastern summit of the Tell.
The prime discovery at Tell Damiyah was two mud brick buildings that had been completely destroyed by a very intense fire in around 700 BCE. The largest of the two buildings, with inner dimensions of ca. 11 × 4 m, was interpreted as a sanctuary with two mud brick platforms. Several cultic items were found, such as horses and females (Petit and Kafafi Reference Petit and Kafafi2016), within and in front of this building. The other structure, located more to the south, was a domestic building. This important phase was dated by pottery and by 14C to ~800 BCE. During the 2016 seasons older layers were excavated that were dated stylistically to the 8th century BCE. After the sanctuary was destroyed, Tell Damiyah was apparently only lightly occupied until the 6th century BCE. Evidence for more recent occupation depends on storage pits from the Persian and Hellenistic times and two cemeteries dated to the Byzantine and Ottoman periods (available 14C ages are summarized in Table 1, after calibration to BCE using OxCal v4.3.2 Ramsey [2017]; InterCal atmospheric curve [Reimer et al. 2013]).
Table 1 Relevant radiocarbon ages for five samples 14C ages to the highest probability, calibrated to BCE using OxCal v4.3.2 Ramsey (2017); InterCal atmospheric curve (Reimer et al. 2013).

OSL samples were collected from two sections in two different excavation squares, the newly excavated north section of square I and the south section of square VII (Figure 2). Both sections represent occupational layers from the Late Iron Age. Samples were collected by driving light-tight tubes into the faces of the sections. All samples were taken from units chosen to be as locally homogeneous as possible. Four samples were taken from discrete layers in the section in square I; these layers were subsequently interpreted at the end of the excavation season as follows (based on the excavation reports of Petit and Kafafi Reference Petit and Kafafi2018 and Kafafi and Petit Reference Kafafi and Petit2018): the upper sample (D1), 70 cm below the excavation surface (a previous bulldozer cutting), was taken from an occupation layer contemporary with the oldest sample taken from square VII (see below) and placed in the 8th century BCE (Stratum VIII). The second and third samples (D2 and D3) were taken from older occupation or courtyard layers also associated with stratum VIII. The lowest sample (D4) came from stratum IX deposited in the late 9th century BCE.

Figure 2 Samples from the two sections in (a) square I (b) square VII.
Another 6 samples were taken from layers in the southern section of square VII. Archaeological evidence (Kafafi and Petit Reference Kafafi and Petit2018; Petit and Kafafi Reference Petit and Kafafi2018) suggests the following chronological associations: sample (D5), closest to the modern surface, was taken from wash and occupation layers from the very late Iron Age, most likely around 600 BCE (Stratum IV). The second and third samples (D6 and D7) came both from occupation layers and debris of Stratum V, dated provisionally to the second half of the 7th century BCE. The fourth and fifth samples (D8 and D9) are associated with a sanctuary from around 700 BCE (Stratum VII). The oldest sample (D10) came from the occupation phase below the sanctuary, dated by archaeological finds to the 8th century BCE (Stratum VIII).
SAMPLE PREPARATION AND MEASUREMENT FACILITIES
Sample Preparation
All samples were treated under dim red light in the TL laboratory of the Faculty of Archaeology and Anthropology, Yarmouk University, Jordan. The sand-sized (180–250 μm) quartz fraction was extracted from the inner part of the sampling tubes using conventional sample preparation techniques (Mauz et al. Reference Mauz, Bode, Mainz, Blanchard, Hilger, Dikau and Zöller2002). Diluted HCl and H2O2 were applied to remove carbonates, clays and organic material, and 10% HF for 40 min to clean the grains. XRF and XRD in Yarmouk University were used to check for the existence of feldspars, and results showed no detectable feldspar in any of the samples. These quartz-rich extracts were then etched for a further 40 min in concentrated HF solution (40%) to remove the alpha irradiated shell (Aitken Reference Aitken1985) and any undetected residual feldspar. Finally, the extracts were washed with dilute HCL to remove any precipitated fluorides.
Experimental Facilities
All luminescence measurements were carried out using an automated Risø TL/OSL-20 system equipped with blue LEDs emitting at 470 nm (~80 mWcm–2) (Bøtter-Jensen et al. Reference Bøtter-Jensen, Thomsen and Jain2010). The quartz OSL signal was detected through a 7.5 mm Hoya filter (UV). The reader is equipped with a 90Sr/90Y beta source delivering an accurately known dose rate of about 0.1 Gys–1. For luminescence measurements, small aliquots were prepared by mounting grains on 10mm diameter stainless steel discs using silicone oil. The calculated intensities of all OSL signals are based on the sum of the initial 0.4 s of the light signal with an early background (0.5–1s) subtracted (Cunningham and Wallinga Reference Cunningham and Wallinga2010).
LUMINESCENCE DATING
Environmental Dose Rates
For the dose rate and water content measurements, we used portions of sediment from the ends of each tube sample; because these were very likely exposed to sunlight during sampling, they were considered unsuitable for dose measurement.
The observed field water content of the samples was measured in the laboratory by weighing, drying at 50ºC for ~48 hr and then weighing again. These values must underestimate the average burial water content, because the sections were exposed at the time of sampling and had had considerable opportunity to dry out to significant depth. Saturation water content was measured by packing loose sediment into a 100-mL syringe, and filling with water; this was then compressed to compact and dewater the sediment before weighing, drying and weighing again. The average field water content for the 10 samples was 7.5% (σ = 3.1%), while the average for the saturated water content is 81.6% (σ = 17.8%); the relative variability of the laboratory saturation measurements is about half that of the field water contents.
Radioactivity concentrations were measured using high-resolution gamma spectroscopy (Murray et al. Reference Murray, Marten, Johnston and Martin1987, Reference Murray, Helsted, Autzen, Jain and Buylaert2018). The measured specific activities were converted to gamma and beta annual dose rates using conversion factors given by Guérin et al. (Reference Guérin, Mercier and Adamiec2011) and beta attenuation factors from Zimmerman (Reference Zimmerman1971) using estimated water content values (based on 20% of laboratory saturated water contents, see below; for comparison, average field water content is 9.5 ± 1.2% of saturation). The contribution from cosmic radiation was estimated for each sample as a function of depth following Prescott and Hutton (Reference Prescott and Hutton1994), and the burial depths measured in the field, assuming an uncertainty of 5%. A small internal dose rate contribution from U of 0.06 ± 0.03 Gy ka–1 was assumed for quartz inclusions (Mejdahl Reference Mejdahl1987; Vandenberghe et al. Reference Vandenberghe, De Corte, Buylaert and Kučera2008). Table 2 summarizes all dosimetric information.
Table 2 Observed and saturated water content values (%), radionuclide concentrations (Bq/kg) and the calculated beta and gamma dose rates (Gy/ka).

SAR Protocol and Internal Checks
A SAR protocol was used with all OSL measurements. Figure 3a presents a natural stimulation curve and dose response curve for sample D1. Quartz dose response curves were fitted using a single saturating exponential function. Comparison with a normalized stimulation curve of calibration quartz (Hansen et al. Reference Hansen, Murray, Buylaert, Yeo and Thomsen2015, Reference Hansen, Murray, Thomsen, Jain, Autzen and Buylaert2018) clearly shows the dominance of the fast component (inset to Figure 3a) (Jain et al. Reference Jain, Murray and Bøtter-Jensen2003; Singarayer and Baile Reference Singarayer and Baile2003).

Figure 3 (a) Quartz OSL SAR growth curve from D4. Inset shows typical natural OSL decay from the same sample (blue) together with a decay curve of an aliquot of calibration quartz (red). (b) Dependence of De on the preheat temperature. (inset) Ratios of measured to given dose in dose recovery test. (Please see electronic version for color figures.)
The luminescence characteristics of the samples were investigated in terms of dose recovery tests and the performance of the chosen SAR protocol (Murray and Wintle Reference Murray and Wintle2000, Reference Murray and Wintle2003).
A dose-recovery preheat-plateau test was first undertaken on 24 fresh aliquots of sample D4. Any natural luminescence was bleached twice using blue light for 100 s at room temperature with an intervening pause of 10 ks. A laboratory beta dose of ~20 Gy was then given. The SAR procedure was then used to measure this given dose, using 6 different preheats temperatures between 180 and 280ºC in 20ºC steps, and a cut-heat 40ºC less than the preheat temperature. Four aliquots were measured at each preheat temperature. The dose recovery ratios were consistent with unity over the preheat temperature range of 180–260°C (Figure 3b). From these data, a 260/220°C preheat/cut-heat temperature was selected for further SAR measurement. In a second dose recovery test, aliquots of sample D4 were bleached using the same procedure described above. Of the 30 aliquots, 24 were given ~20 Gy and the remaining 6 aliquots were used to measure thermal transfer. The measured to given dose ratio was 1.032 ± 0.010 (n=24) (Figure 3b inset), and thermal transfer was negligible (0.011 ± 0.003 Gy, n=6). These results confirm that the selected SAR protocol can measure a laboratory dose given before any thermal treatment with sufficient accuracy, and all later measurements of De employed this protocol, with a test dose of 5.1 Gy. During these De measurements, the average of the recycling ratios was 0.971 ± 0.009 (n=292) and of the recuperation values was 2.0 ± 0.4% (n=292).
QUARTZ LUMINESCENCE AGES AND COMPARISON TO SITE AGE
Calculated equivalent doses and ages from the two profiles are listed in Table 3. Random uncertainties (σr) are based primarily on OSL and gamma ray counting statistics, and OSL curve fitting (Duller Reference Duller2007). The systematic uncertainties (σsys), shared across all samples, originate from gamma spectrometry calibration, beta source calibration and water content estimates.
Table 3. Equivalent doses, total dose rate and calculated OSl ages.

The two sets of OSL ages range from 2.50 to 2.96 ka (Figure 4). The average age of the two OSL samples taken from Phase VII and attributed to the sanctuary structure is 2.82 ± 0.17 ka, indistinguishable from the average of the 14C ages from the same unit, of 2.80 ± 0.02 ka (n=4) cal BP.

Figure 4 OSL ages from the two sections shown as related to their depths. error bars represent total error.
Phases IV, V, VIII, and IX have no direct radiometric age control, but the archaeological estimates of age are 2.65, 2.65, 2.85, and 2.85 ka, respectively, based on stylistic characteristics (Petit and Kafafi Reference Petit and Kafafi2016) as discussed above. The estimated age ranges are given in Table 3 (based on the description in the previous section, “Archaeological Context and Sampling,” and the table provided by Petit and Kafafi [Reference Petit and Kafafi2016: 19]).
Phase IV corresponds to OSL sample D5 with an age 2.76 ± 0.16 ka. The average OSL age for samples (D6, D7) that match phase V is 2.45 ± 0.13 ka. Four OSL samples were taken from Phase VIII (average is 2.74 ± 0.17 ka, n=4). Finally, one sample from phase IX gave an age of 2.86 ± 0.17 ka.
DISCUSSION AND CONCLUSIONS
The luminescence characteristics of quartz extracted from these geo-archaeological sediments are very satisfactory. The OSL signal is dominated by the fast-component, and when used with a SAR protocol, it shows good recycling (0.971 ± 0.009; n=292) and low recuperation (2.0 ± 0.4% of the natural signal; n=292). The dose recovery ratio of 1.032 ± 0.010 (n=24) indicates that our chosen protocol is able to accurately measure a known dose given before any prior thermal treatment. Thus we have no reason to doubt the accuracy of our measured doses. The resulting OSL ages (Table 3) for each unit are, on average, in excellent agreement with expectations (OSL age /expected age = 0.99 ± 0.01; n=5), with 4 out of 5 expected ages lying within the 66% confidence interval of the corresponding OSL age. The largest deviation between OSL and expectation is 8% for Phase V (OSL 2.45 ± 0.11 ka compared with an expected age of 2.65 ka); in this case the expected age still lies within the 95% confidence interval of the OSL age.
However, it must be acknowledged that this agreement is to some degree fortuitous. The observed water content of the samples was, on average 9.5 ± 1.2% (n=10) of saturation. These samples were taken from exposed south and north facing sections, in a semi-arid environment. As a result, the sediment must have dried out to some degree, and the measured average water content must underestimate the present-day water content of sediment buried even a few metres further inside the Tell deposits. On the other hand, the Tell rises up to 17 m above the local valley floor (these samples were taken in the upper part of the site), and so must always have been well drained. Based on these considerations, we assumed that the buried water content was most likely to have been around 20% of saturation; we then used the observed water content to put a lower bound on our uncertainties, by assuming it lies at a probability of 95%. Similarly, it seems very unlikely that the water content was ever higher than 30%, and so we took 20 ± 5% as the assumed average lifetime fraction of saturation. For these samples, the effect of increasing our assumed water content by 1% would be to increase the age by about 1%. Thus, had we (incorrectly) used the observed field water content, our ages would be ~10% younger, and had we used the very unlikely assumption of 30% of saturation, the ages would be 10% older.
If we normalize each sample (and its associated random uncertainty) to the expected age, and neglect uncertainties on the expected age, then the over-dispersion in the ratios is 4.5%. This is not large and suggests that either all samples are equally poorly bleached, and at the same time suffer from some systematic uncertainty that largely compensates for this poor bleaching, or that the samples are well bleached, and unaccounted systematic uncertainties are negligible. We consider the latter the most likely, but acknowledge that it would be desirable to test this assumption by e.g. comparison with feldspar age (Murray et al. Reference Murray, Buylaert and Thiel2015; Thomsen et al. Reference Thomsen, Murray, Buylaert, Jain, Hansen and Aubry2016), or by examining single grain age distributions (Feathers et al. Reference Feathers, Holliday and Meltzer2006; Bateman et al. Reference Bateman, Boulter, Carr, Frederick, Peter and Wilder2007; Arnold and Roberts Reference Arnold and Roberts2009).
Nevertheless, these results confirm the suitability of these Tell sediments for luminescence dating. The typical uncertainty is ± 130 yr, to be compared with corresponding uncertainties on 14C ages of between 15 and 45 yr (based on 25% of the 95% range in calibrated ages). On the other hand, OSL is being used to date an event (deposition) and material (sediment) that cannot be dated directly by 14C. Clearly there are many circumstances where even the larger uncertainties of OSL dating will be useful in dating otherwise undatable material or in resolving ambiguities in typology.