INTRODUCTION
River deltas, despite their small size, are major compartments in the carbon cycle. These zones, which constitute only 0.7% of the global ocean surface, produce a quarter of the CO2 absorbed by the whole ocean (Cai Reference Cai2011). It is also estimated that 50% of the global oceanic carbon burial occurs in deltas (Berner Reference Berner1982). These areas of high sedimentation are key locations for the retention and mineralization of organic carbon and it is important to constrain its origin to better understand the role of different organic matter (OM) pools in the coastal carbon budget.
In river deltas and estuaries, sediments receive OM originating from land, ocean, and coastal wetlands as well as autochthonous, estuarine, and riverine production, which may have very different reactivity owing to their nature and residence time in the soils or aquatic system (Bauer et al. Reference Bauer, Cai, Raymond, Bianchi, Hopkinson and Regnier2013). The use of stable and radiogenic carbon isotopes (13C and 14C) has proven useful in order to characterize the different carbon sources in the sediment. This approach has been widely adopted for river delta sediments (Hunt Reference Hunt1970; Fontugne and Jouanneau Reference Fontugne and Jouanneau1987; Goni et al. Reference Goni, Ruttenberg and Eglinton1997; Goni et al. Reference Goni, Ruttenberg and Eglinton1998, Reference Goni, Monacci, Gisewhite, Crockett, Nittrouer, Ogston, Alin and Aalto2008; Lansard et al. Reference Lansard, Rabouille, Denis and Grenz2009; Blair and Aller Reference Blair and Aller2012; Cathalot et al. Reference Cathalot, Rabouille, Tisnerat-Laborde, Toussaint, Kerherve, Buscail, Loftis, Sun, Tronczynski, Azoury, Lansard, Treignier, Pastor and Tesi2013; Toussaint et al. Reference Toussaint, Tisnerat-Laborde, Cathalot, Buscail, Kerherve and Rabouille2013) and also for their riverine sources (Raymond and Bauer Reference Raymond and Bauer2001; Higueras et al. Reference Higueras, Kerherve, Sanchez-Vidal, Calafat, Ludwig, Verdoit-Jarraya, Heussner and Canals2014; Coularis Reference Coularis2016).
Previous studies carried out on sediment OM showed that their origin is mainly terrestrial near the river mouth with a contribution of marine OM on continental shelves (Goni et al. Reference Goni, Ruttenberg and Eglinton1997; Cathalot et al. Reference Cathalot, Rabouille, Tisnerat-Laborde, Toussaint, Kerherve, Buscail, Loftis, Sun, Tronczynski, Azoury, Lansard, Treignier, Pastor and Tesi2013).
In this paper, we focus on the Rhône River delta and shelf sediments where it has been shown, using paired δ13C and ∆14C signatures (Cathalot et al. Reference Cathalot, Rabouille, Tisnerat-Laborde, Toussaint, Kerherve, Buscail, Loftis, Sun, Tronczynski, Azoury, Lansard, Treignier, Pastor and Tesi2013), that the OM content of the sediments in the prodelta and neighboring shelf is old except for very near the Rhône river mouth and that the age increases with the distance from the river mouth. This observation suggests that the younger OM potentially originating from production in the river is promptly remineralized, conferring on the prodelta its major role of source of CO2 in the carbon cycle of this part of the Mediterranean Sea. The Rhone River is one of the most nuclearized rivers in Europe. Fourteen nuclear power reactors grouped in four nuclear plants are located all along the Rhone River and legally discharge cooling water containing 14C enriched dissolved inorganic carbon (DIC) (Eyrolle et al. Reference Eyrolle, Antonelli, Renaud and Tournieux2015; Jean-Baptiste et al. Reference Jean-Baptiste, Fontugne, Fourré, Marang, Antonelli, Charmasson and Siclet2018a). The isotopic signature of this DIC can be rapidly transferred to the autotrophic OM pool of the river by photosynthesis of plankton and algae (Fontugne et al. Reference Fontugne, Sadouni, Saliot, Siclet and Bouloubassi2002; Coularis et al. Reference Coularis, Tisnérat-Laborde, Pastor, Siclet and Fontugne2016). In the Rhône River and its prodelta, 14C can thus be a powerful tracer of the fresh OM produced in the river.
To verify Cathalot’s hypothesis of rapid mineralization of riverine OM in sediments near the Rhone River mouth, it is essential to document the sediment pore waters DIC isotopic composition, using the nuclear 14C released as a tracer. Previous papers (Aller and Blair Reference Aller and Blair2006; Aller et al. Reference Aller, Blair and Brunskill2008; Zetsche et al. Reference Zetsche, Thornton, Midwood and Witte2011) have shown the importance of coupling the study of pore waters to the study of sediments because the isotopic information they provide can be significantly different. The DIC of sediments pore waters resulting from the oxidation of organic matter provides information on the fate of the most labile and freshest organic carbon. Conversely, sedimentary organic carbon informs about the most refractory component of organic matter.
The aim of this paper was to study the carbon isotope signatures (δ13C and ∆14C) in the sediment pore waters DIC in addition to the sediment itself to obtain new data and a better understanding of the origin of the OM fraction mineralized in the Rhône River prodelta sediment and its adjacent shelf.
We first present the study site with its characteristics and its background. Two periods will be considered and described with bibliographic 14C data: the pre-nuclear or natural period and the last 50 years affected by nuclear anthropic activities. Different analyses (DIC concentration, δ13C and ∆14C) conducted on sediment pore waters as well as on the sediment itself will be presented. Then, a mixing model calculating the original characteristics of the OM mineralized in the pore waters DIC will be introduced. Finally, the results will be discussed and compared with results from previous studies in order to better understand the fate of the different OM pools in the complex system of the Rhône River prodelta.
MATERIAL AND METHODS
Study Site
The Rhône River is a major source of freshwater, particles, and OM brought to the western Mediterranean Sea (De Madron et al. Reference De Madron, Abassi, Heussner, Monaco, Aloisi, Radakovitch, Giresse, Buscail and Kerherve2000; Sempere et al. Reference Sempere, Charriere, Van Wambeke and Cauwet2000; Pont et al. Reference Pont, Day, Hensel, Franquet, Torre, Rioual, Ibanez and Coulet2002). The river’s catchment basin covers an area of 97,800 km2 with strong climatic and geological heterogeneity. The hydrological regime of the Rhône fluctuates between under 700 m3 s–1 during the low flow period and over 3000 m3 s–1 during the flood period. The majority of the terrigenous material is delivered by floods to the sea where it is rapidly deposited at the river mouth between 0 and 20 m water depth (Maillet et al. Reference Maillet, Vella, Berne, Friend, Amos, Fleury and Normand2006) before redistribution to the prodelta by wave action. The sedimentation rates at the river mouth (20 m depth) vary between 30 and 40 cm yr–1 (Charmasson et al. Reference Charmasson, Bouisset, Radakovitch, Pruchon and Arnaud1998), decreasing to 1 to 10 cm yr–1 at 60 m water depth (Radakovitch et al. 1999 Reference Radakovitch, Charmasson, Arnaud and Bouisseta and Reference Radakovitch, Cherry and Heussnerb) in areas farther from the coast (prodelta) and reaching a rate of <0.3 cm yr–1 on the continental shelf (Miralles et al. Reference Miralles, Radakovitch and Aloisi2005; Radakovitch et al. Reference Radakovitch, Charmasson, Arnaud and Bouisset1999a; Zuo et al. Reference Zuo, Eisma, Gieles and Beks1997).
It is also important to note that because of the microtidal context the freshwater plume from the Rhône River spreads on the surface of the sea and is only mixed with the seawater in the first meters of the water column (Many et al. Reference Many, Bourrin, Durrieu de Madron, Ody and Doxaran2017). At a depth of 20 m, the bottom water is strictly “pure” seawater with a salinity around 38‰. The Rhône plume is then driven westward by the Liguro-Provençal current along the Languedoc coast (Estournel et al. Reference Estournel, Kondrachoff, Marsaleix and Vehil1997).
In this study, we focused on three stations located along a north-south/west transect in the freshwater plume (Figure 1). Two of the stations are directly located at the mouth of the river at the top of the prodelta (stations A and Z, seabed at 20 m) while the third one, 12 km farther from the coast, is located on the continental shelf (station D, seabed at 75 m).

Figure 1 Map of the Rhône prodelta with the sampling stations A, D, and Z.
Background
The sources of riverine particles discharged to the delta are highly dependent on floods (Pont et al. Reference Pont, Day, Hensel, Franquet, Torre, Rioual, Ibanez and Coulet2002; Ollivier et al. Reference Ollivier, Hamelin and Radakovitch2010) carrying soils of various ages, vegetation debris and river phyto-planktonic production. During the warmer seasons, the in-stream photosynthesis based on riverine DIC delivers new sources of carbon with an isotopic signature that depends directly on the nature of the drainage basin for 13C and 14C and on anthropogenic 14C input (Harmelin-Vivien et al. Reference Harmelin-Vivien, Dierking, Banaru, Fontaine and Arlhac2010; Coularis Reference Coularis2016). The 14C activity of inorganic and organic carbon in the Rhône River and its delta have been affected for the last 50 years by releases from nuclear power plants and military reprocessing plants. These anthropogenic activities and particularly the nuclear inputs which bring enriched 14C-DIC to the system lead to high 14C activity of the OM synthetized in situ (Toussaint Reference Toussaint2013; Eyrolle et al. Reference Eyrolle, Antonelli, Renaud and Tournieux2015; Jean-Baptiste et al. Reference Jean-Baptiste, Fontugne, Fourré, Marang, Antonelli, Charmasson and Siclet2018a). On the other hand, the old carbonates dissolved from the drainage basin generate a freshwater reservoir effect (FRE) for 14C in DIC which could generate an apparent 14C aging of freshly photosynthetized OM in the pre-nuclear period, as was observed in the Loire watershed upstream of nuclear power plants (Coularis et al. Reference Coularis, Tisnérat-Laborde, Pastor, Siclet and Fontugne2016). Nevertheless, the anthropogenic 14C marked carbon offers the opportunity to trace the evolution of organic matter after its discharge to the coastal zone if the partitioning between natural (pre-nuclear) and nuclear 14C is clear.
Pre-Nuclear Period
Before the anthropogenic nuclear activities of the last 50 years the 14C signature of the OM in the Rhône River and its prodelta was linked to various natural 14C sources such as soils and plant debris but also autotrophic phytoplankton and algae which depend on the isotopic signature of river DIC. As the course of the Rhône River in its final stretch flows through carbonate sedimentary formations, this induces a notable FRE (see for the Loire River, Coularis et al. Reference Coularis, Tisnérat-Laborde, Pastor, Siclet and Fontugne2016). For the Rhône River, the FRE measured on DIC was evaluated at ∆14C=–114‰, a value indicating the strong influence of the main tributary, the Durance river which is known to be depleted in ∆14C as indicated by a value obtained in May 2014 (∆14C=–138‰, Jean-Baptiste et al. Reference Jean-Baptiste, Fontugne, Fourré, Marang, Antonelli, Charmasson and Siclet2018a). The FRE observed for the dissolved inorganic carbon can be transferred to the algal production present in the river. The work by Coularis et al. (Reference Coularis, Tisnérat-Laborde, Pastor, Siclet and Fontugne2016) showed, for the Loire River basin, that the particulate organic carbon (POC) has the same activity as the total dissolved inorganic carbon. These results imply that the contribution of FRE to in-stream production can be high and contributes with the detritic geological carbon fraction and the contribution of soil to the 14C activity of the total particulate organic carbon. The pre-nuclear signature of riverine plankton should thus show ∆14C=–110‰ in accordance with the FRE of the Rhône River.
During this period, the particulate organic carbon discharged during the flood and deposited in the Rhône pro-delta was a mixture of fresh POC (∆14C=–110‰) and an older particulate carbon removed from the river catchment basin or resuspended from the bottom of the river. Previous studies of prodelta sediment cores show that OM 14C activity during this period ranged between ∆14C=–600‰ and ∆14C=–400‰ depending on the distance from the mouth of the Rhône river (Cathalot et al. Reference Cathalot, Rabouille, Tisnerat-Laborde, Toussaint, Kerherve, Buscail, Loftis, Sun, Tronczynski, Azoury, Lansard, Treignier, Pastor and Tesi2013; Toussaint et al. Reference Toussaint, Tisnerat-Laborde, Cathalot, Buscail, Kerherve and Rabouille2013; Jean-Baptiste et al. Reference Jean-Baptiste, Fontugne, Fourré, Marang, Charmasson and Siclet2018b submitted). Far offshore, under typical marine influence, DIC from Mediterranean Seawater and phytoplankton had 14C activities around ∆14C=–50‰ during the pre-nuclear period (Siani et al. Reference Siani, Paterne, Arnold, Bard, Métivier, Tisnérat and Bassinot2000; Tisnérat-Laborde et al. Reference Tisnérat-Laborde, Montagna, Frank, Siani, Silenzi and Paterne2013).
Modern Nuclear Period
The nuclear era started in 1955 with the first thermonuclear experiments in the Pacific Ocean and led to the doubling of 14C activity in the atmosphere in 1963 (∆14C “indicative value” around 1000‰). The impact of these changes is not well known for photosynthetic matter in the Rhône river but according to the decrease of 14C activity in the atmosphere, it also decreased by about 50% before 1970.
Later, the legal recurrent discharge of cooling water from the nuclear plants (Eyrolle et al. Reference Eyrolle, Antonelli, Renaud and Tournieux2015) directly impacted the activity of the river DIC and consequently the fresh OM via algal production. The 14C activity of the OM in suspended particular material (SPM) of the river is very variable because it depends on the discharge by the nuclear industry and on the season.
Regulations prohibit discharges during floods and during periods of low water, limiting the impact of the release because of dilution of water and particles. However, at the end of spring and summer, the algal photosynthesis activity is strong and flows are relatively low which induces a stronger release impact than in winter.
For POC/SPM collected in Arles near the River outlet, the integrated monthly samples from 2010 to 2013 showed an amplitude of variation of ∆14C values from –172‰ to +908‰ with an average value of ∆14C=285 ± 320‰ (Jean-Baptiste et al. Reference Jean-Baptiste, Fontugne, Fourré, Marang, Antonelli, Charmasson and Siclet2018a). Between 2010 and 2013, measurements of ∆14C activity of the POC collected in the Rhone prodelta sediments ranged from –120‰ to +140‰. (Cathalot et al. Reference Cathalot, Rabouille, Tisnerat-Laborde, Toussaint, Kerherve, Buscail, Loftis, Sun, Tronczynski, Azoury, Lansard, Treignier, Pastor and Tesi2013; Toussaint Reference Toussaint2013; Jean-Baptiste et al. Reference Jean-Baptiste, Fontugne, Fourré, Marang, Antonelli, Charmasson and Siclet2018a). On the continental shelf, at depths greater than 75 m, the values decreased to between –200 and –400‰. The DIC of coastal surface waters, beyond the influence of the Rhône, displayed an activity around +30‰ in 2010 and 2011 (Fontugne et al. Reference Fontugne, Jean-Baptiste, Fourré, Bentaleb, Dezileau, Charmasson, Antonelli, Marang and Siclet2012). This activity is close to the measurements conducted on biological materials (mussels, algae) in the Western Mediterranean region at the same time (Jean-Baptiste et al. Reference Jean-Baptiste, Fontugne, Fourré, Marang, Antonelli, Charmasson and Siclet2018a). In this context of large changes in the 14C activity of DIC and organic particles due to the nuclear activity in the watershed, it is important to understand the sources of OM in deltaic sediments and understand its mineralization through analysis of the isotopic composition of DIC in sediment pore waters (Aller and Blair Reference Aller and Blair2004; Aller et al. Reference Aller, Blair and Brunskill2008).
Sampling
The sampling campaign (Carbodelta II; Rabouille Reference Rabouille2013) was carried out on the Rhône River delta and adjacent shelf on the CNRS/INSU R.V. Tethys II in April 2013, during a period of average freshwater discharge (April 2013: 2360 m3/s). The three stations A, Z, and D were sampled during the Carbodelta II cruise. Sediment, bottom water and pore waters were collected at each station to analyze alkalinity, DIC, δ13C, and ∆14C.
Sediment
Sediment cores (internal diameter: 9.5 cm) were collected with a gravity corer (Uwitec), using PVC crystal clear tubes; their length varied between 20 and 40 cm, depending on the texture and hardness of the seabed. With current sedimentation rates of 20–30 cm/yr in the prodelta (station A and Z), the entire core corresponds to nearly one year of sediment deposition. Each core was sliced at the following depth intervals: 0.5 mm from 0 to 2 cm, 1 cm from 2 to 10 cm, 2 cm between 10 and 20 cm, and 5 cm from 20 cm to the end of the core.
Each slice was carefully stored in plastic bags, frozen at –20°C directly on board and kept frozen in the laboratory.
Pore Waters
Separate sediment cores were collected to extract pore waters. Predrilled tubes (every 2 cm) sealed with black tape were collected with the same corers. The extraction of the pore waters was done using 10 mm long 0.2 µm rhizons (Rhizosphere Research Products, see Seeberg-Elverfeldt et al. Reference Seeberg-Elverfeldt, Schlüter, Feseker and Kölling2005) connected to rubber-free 10-mL syringes. During Carbodelta II, the samples to be analyzed for both 13C and 14C were placed in 10-mL Pyrex glass ampoules (previously combusted at 450°C for 5 hr) sealed immediately on board with a welding torch and stored frozen at –20°C until analysis. A separate core was sampled similarly for DIC and alkalinity measurements.
Bottom Water
Bottom water samples were collected as close as possible to the bottom (around one meter) using a Niskin bottle. The water was poisoned with mercuric chloride (HgCl2) and stored in 250-mL glass bottles (previously cleaned and combusted at 450°C for 5 hr). During the expedition, pore and bottom water samples analyzed for DIC/TIC (total inorganic carbon, see below) were placed in 15-mL falcon tubes, stored at 25°C and analyzed within the day.
Measurements
TIC/DIC Analysis
We discriminate between water TIC and DIC content. Inorganic carbon measured in bottom water samples will be referred to as TIC or total inorganic carbon because samples were not filtered before analysis. Inorganic carbon measured in pore waters will be referred to as DIC or dissolved inorganic carbon because during extraction the water passed through the 0.2 μm ceramic filter inside the rhizons. The two notions are very similar when the particulate content of bottom water is low and the results are therefore comparable.
The analysis was carried out using an Apollo Scitech Dissolved Inorganic Carbon Analyzer with a LI-COR CO2 detector (see Rassmann et al. Reference Rassmann, Lansard, Pozzato and Rabouille2016 for details). The uncertainty of DIC/TIC measurements is at most 0.5%.
13C and 14C Analysis
Preparation of all the samples and analysis of the 14C was done at the LMC14 laboratory, Saclay and 13C measurements were carried out by the Geotrac team of the LSCE laboratory.
a) Extraction of CO2 from the pore waters:
The main difficulty of the sample preparation and analysis was the very limited volume of pore water available for processing. Extracting enough CO2 to perform reliable 14C measurements from 10 mL samples can prove challenging. On water column samples, such measures are normally done on much larger volumes (around 70 mL) to ensure enough C content. However, since pore waters DIC concentration is generally higher than in the water column (Aller and Blair Reference Aller and Blair2004; Aller et al. Reference Aller, Blair and Brunskill2008), the existing CO2 extraction line used at the LMC14 described by Dumoulin et al. (Reference Dumoulin, Caffy, Comby-Zerbino, Delque-Kolic, Hain, Massault, Moreau, Quiles, Setti, Souprayen, Tannau, Thellier and Vincent2013) was well fitted to work on smaller pore waters volumes.
The main modification to the previous version of the line consisted in the sample introduction procedure for small volume samples. The glass ampoule containing the 10 mL pore water sample was defrosted and pre-cut on the upper part with a power saw. Then, the ampoule was broken and the sample rapidly (2 seconds) introduced inside the reactor to limit contact with air. Once broken, the ampoule was fitted with a gas tight stopper pierced by 2 microtubes, one used to deliver pure Argon gas (CO and CO2<10 ppb) into the ampoule and the other to transfer the sample into the reactor. The sample delivery tube was sharpened and used to pierce an air-tight septum located on the inlet of the reactor vessel. Once the tubes were in place, the argon flux was started and the sample gently pushed from the ampoule directly into the reactor vessel.
Once the transfer was complete, 2 mL of 85% phosphoric acid (H3PO4) was added to the reactor via the septum and the acidification reaction started. After 45 min, all the DIC contained in the sample was transformed into CO2 gas, which was then removed from the reactor by the helium flow and pushed through the line for 30 min to be dried in the two water traps at –78°C, condensed in the liquid nitrogen solenoid trap at –190°C, measured in the calibrated cold finger and finally split into two separate aliquots, one for the 14C measurement and the other for 13C measurement. The CO2 aliquot for 14C measurement was then sent to the graphitization laboratory whereas the 13C aliquot was measured directly at the LSCE with an isotope ratio mass spectrometer (Dual Inlet VG Optima through a manifold).
The isotopic ratio13C/12C is reported on the δ13C notation and is expressed relative to the PDB standard (fossil CaCO3) in ‰:
 $${\rdelta ^{{{\rm 13}}} {\rm C}{\equals}\left[ {{{{}^{{{\rm 13}}}{\rm C}\,/\,{}^{{{\rm 12}}}{\rm C}\left( {{\rm sample}} \right)} \over {{}^{{{\rm 13}}}{\rm C}\,/\,{}^{{{\rm 12}}}{\rm C}\left( {{\rm standard}} \right)}}1} \right]}{\asterisk\,}1000$$
The precision of the isotopic measurements is ±0.3‰.
b) Production of CO2 for 14C analysis from the sediments:
After total decarbonation with HCl 0.5N to remove the carbonate fraction, sediments and filters were dried for one night in an oven at 65°C. The total organic carbon concentration (%TOC) of the sediment was obtained with an elemental analyzer (Thermo Fisher Scientific Flash 2000 series). The samples were precisely weighed according to their %TOC to get nearly 1 mg of CO2 and then sealed in quartz tubes under vacuum (residual pressure<10–5 mbar) with an excess of CuO and a 1 cm silver wire. The quartz tubes were then combusted at 850°C for 5 hr and cooled slowly. Finally, they were cracked inside a glass line under vacuum (<10–5 mbar) and the CO2 gas produced was cryogenically collected in tubes via liquid nitrogen. After collection, the tubes were sealed using a welding torch and sent to the graphitization laboratory (Dumoulin et al. Reference Dumoulin, Comby-Zerbino, Delqué-Količ, Moreau, Caffy, Hain, Perron, Thellier, Setti, Berthier and Beck2017).
c) Graphitization and AMS measurements.
The CO2 previously collected was reduced to graphite at the LMC14 laboratory using hydrogen and iron powder at 600°C (Vogel et al. Reference Vogel, Southon, Nelson and Brown1984; Cottereau et al. Reference Cottereau, Arnold, Moreau, Baque, Bavay, Caffy, Comby, Dumoulin, Hain, Perron, Salomon and Setti2007; Dumoulin et al. Reference Dumoulin, Comby-Zerbino, Delqué-Količ, Moreau, Caffy, Hain, Perron, Thellier, Setti, Berthier and Beck2017). The iron and graphite powder was pressed into the 1 mm hole of an aluminum cathode and loaded into the ion source of the ARTEMIS facility for the AMS measurement (Moreau et al. Reference Moreau, Caffy, Comby, Delqué-Količ, Dumoulin, Hain, Quiles, Setti, Souprayen and Thellier2013).
The 14C activities were calculated with respect to the international standard of Oxalic Acid II. Data were corrected for the isotopic fractionation measured in the AMS and 14C activities were normalized for a –25‰ δ13C. Conventional radiocarbon calculations were done using the Mook and van der Plicht method (1999). Errors take into account the statistics, variability of results and background correction. The Δ14C uncertainty values are ± 3‰ at a confidence interval of 1σ. The 14C contents are expressed in ∆14C which is defined as the deviation in parts per mil from the modern standard. All ∆14C values were then recalculated to 1950, and corrected for the delay between sampling and measurement year (Mook and van der Plicht Reference Mook and van der Plicht1999).
 $$\rDelta {14^{\rm C}}{\equals}\left[ {{{pMC} \over {100}}{\rm }e^{{\lambda {\rm }(date \ {\rm }measure{\minus}date \ {\rm }sampling)}} {\minus}1} \right]{\rm {\asterisk}}\,1000$$
with
decay constant of 14C λ= ln2/ T with T= 5730 yr BP.
and
 $${\rm pMC}\,\left( {{\rm percent}\ {\rm modern}\ {\rm carbon}} \right){\equals}100 \, {\asterisk}{{\rm A_{{na}} } \over {\rm A_{{std}} }}$$
where Ana is the normalized 14C activity of the sample and Astd the activity of the standard Oxalic Acid II in 1950. The “typical” uncertainty of the results is ±3‰.
d) Mixing model for calculating the isotopic signature of mineralized organic matter:
At each depth in the sediment, pore waters DIC is a mix of bottom water DIC and DIC originating from the mineralized OM, carbonate dissolution being ruled out in these sediments (Rassmann et al. Reference Rassmann, Lansard, Pozzato and Rabouille2016).
To ascertain the origin of the OM mineralized in the sediment, we have to calculate the original isotopic signature of the organic matter mineralized in the sediment using a mixing model. This information is crucial in order to better understand the relative contribution of terrigenous versus marine organic carbon in the mineralization process and compare it to known sources in the river basin, or marine production.
The pore waters mixing model used is similar to that of Bauer et al. (Reference Bauer, Reimers, Druffel and Willimas1995). The first step consists in calculating the fraction of bottom water in the mix (x) by calculating the ratio between bottom water DIC concentration [DICBW] and measured pore waters DIC concentration [DICpore] in μmol/L.
 $${\rm x}{\equals}\left[ {{\rm DIC}_{{{\rm BW}}} } \right]\,/\,\left[ {{\rm DIC}_{{{\rm pore}}} } \right]$$
In association (1–x) is the fraction of DIC produced by the mineralization of organic matter present in the sediments.
The second step consists in using these fractions (x) and (1–x) to calculate the real isotopic signature (δ13COM, ∆14COM) of the mineralized OM, knowing the isotopic signature of the pore waters (δ13Cpore, ∆14Cpore) and the bottom water (δ13CBW, ∆14CBW).
 $$\rdelta ^{{13}} {\rm C}_{{{\rm pore}}} {\equals}{\rm x}{\,\asterisk\,}\rdelta ^{{13}} {\rm C}_{{{\rm BW}}} {\plus}\left( {1{\minus}{\rm x}} \right){\,\asterisk\,}\rdelta ^{{13}} {\rm C}_{{{\rm OM}}} $$
 $$\rdelta ^{{13}} {\rm C}_{{{\rm OM}}} {\equals}(\rdelta ^{{13}} {\rm C}_{{{\rm pore}}} -{\rm x}{\,\asterisk\,}\rdelta ^{{13}} {\rm C}_{{{\rm BW}}} )\,/\,(1-{\rm x})$$
A similar set of equations leads to the 14C signature of mineralized organic matter:
 $$\rDelta ^{{14}} {\rm C}_{{{\rm OM}}} {\equals}(\rDelta ^{{14}} {\rm C}_{{{\rm pore}}} -{\rm x}{\,\asterisk\,}\rDelta ^{{14}} {\rm C}_{{{\rm BW}}} )\,/\,(1-{\rm x})$$
where ∆14CBW is the ∆14C signature of DIC in bottom waters (in ‰), ∆14Cpore is the ∆14C signature of DIC in the pore waters at depth in sediments, and ∆14COM is the ∆14C signature of the mineralized organic matter.
RESULTS
Sediment Pore Waters DIC Concentrations
As shown in Table 1 and Figure 2, bottom seawater [DIC] was quite constant at the three stations (around 2530 µmol/L) with a salinity around 38‰, indicating that bottom waters are from the same origin and under the influence of Mediterranean seawater. [DIC] in sediment pore waters increased with depth at all stations. For station Z, the DIC concentration ([DIC]) varied between 2530 µmole/L for bottom seawater to about 29,800 µmole/L in sediment pore waters at 23 cm depth. At station A, a larger increase in [DIC] was observed in the first 5 cm than at station Z, followed by a slower increase in [DIC]. At station D, in the first centimetre, [DIC] was 2857 µmol/L, 1.5 to 2 times lower than the DIC concentration in the prodelta. We also observed a tenfold smaller increase (100 µmol/L per cm) for the marine station D compared to the prodelta stations A and Z (nearly 1000 µmol/L per cm).

Figure 2 Evolution of the DIC concentrations (µmol/L) as a function of the sediment core depth (cm) at stations A, D and Z.
Table 1 Dissolved inorganic carbon (DIC) concentrations measured in bottom seawater (BW) and sediment pore waters. ND means no data.

δ13C and ∆14C of Pore Waters DIC, Bottom Seawater and Sediment Organic Carbon
All the results are presented in Table 2 station by station for the two different pools: sediments and pore waters.
Table 2 δ13C and ∆14C data of pore waters DIC, bottom seawater water, and sediments. Values are given in per mil notation (‰). The values with * refer to a range of literature values for these stations from Cathalot et al. (Reference Cathalot, Rabouille, Tisnerat-Laborde, Toussaint, Kerherve, Buscail, Loftis, Sun, Tronczynski, Azoury, Lansard, Treignier, Pastor and Tesi2013) and Toussaint (Reference Toussaint2013).

δ13C values of DIC of bottom water is –1.17‰ at Station A. δ13C values of the sediment pore waters ranged between –19.8 to –24.7‰ at the prodelta stations (A and Z). At marine Station D, δ13C values are around –8.8‰ and were notably higher than the prodelta ones. However, δ13C of DIC pore waters at the three stations presented a similar decrease with core depth indicating the addition of 13C-mineralized OM DIC.
At stations A and Z, pore waters DIC-δ13C values reached, at depth, values around –23‰ to –25‰, which is slightly higher than that of sediment organic carbon which has varied between –25.5 to –27.5‰ (Lansard et al. Reference Lansard, Rabouille, Denis and Grenz2009; Jean-Baptiste et al. Reference Jean-Baptiste, Fontugne, Fourré, Marang, Charmasson and Siclet2018b submitted) during the last 50 years.
At station D pore waters DIC showed higher δ13C values than prodelta stations (around –9‰) indicating that in the continental shelf station, a lower proportion of 13C-mineralized OM DIC is added to the pore waters DIC. Note that the station D profile is shorter because the carbon content of the last two samples was too low to provide reliable measurements (Figure 3).

Figure 3 Results of 13C analysis, expressed in δ13C (‰), at the three stations A, Z (prodelta) and D (shelf) for sediment pore waters DIC.
The results of the ∆14C analysis of both sediment organic carbon and the corresponding pore waters DIC as well as bottom seawaters are reported in Figure 4. The ∆14C signature of the bottom seawater was analyzed for station A (∆14C=+39‰) and we assume that this value is the same for all three stations which is confirmed by Pozzato et al. (Reference Pozzato, Rassmann, Lansard, Dumoulin, van Brugel and Rabouille2018), since, as shown above, the concentration of DIC is the same and the salinity of bottom waters is consistently around 38‰ at the three stations, suggesting that no mixing with fresh river water occurred.
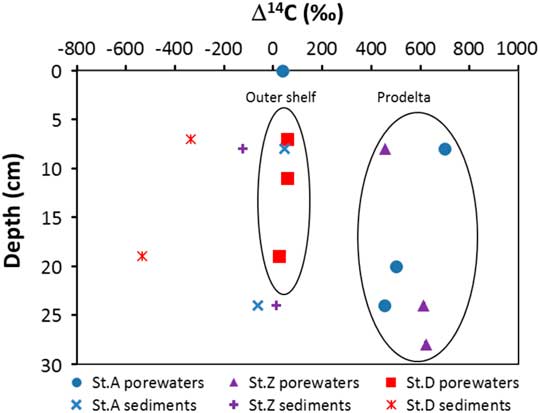
Figure 4 Results of 14C analysis, expressed in ∆14C (‰), at the three stations A, Z, and D and for two different kinds of samples: sediment pore waters DIC (symbols) and sediment organic carbon (crosses). Colors refer to stations. (Please see online version for color figures.)
∆14C of prodelta pore waters DIC (stations A and Z) presented similar values varying between +452 to +697‰ while sediment organic carbon varied between 46 to –125‰. At station D on the continental shelf, the ∆14C values of pore waters DIC were not very different from bottom seawater water, at between 25 and 57‰. Figure 4 shows clearly that organic carbon in sediment is systematically 14C depleted compared to the pore waters DIC of these sediments. At Station D, the ∆14C values of sediment were low, between –335± 3‰ and –569± 2‰, in good agreement with a previous study (Cathalot et al. Reference Cathalot, Rabouille, Tisnerat-Laborde, Toussaint, Kerherve, Buscail, Loftis, Sun, Tronczynski, Azoury, Lansard, Treignier, Pastor and Tesi2013).
Original Isotopic Signature of Organic Matter Mineralized in Sediment Pore Waters
Using the mixing model, the isotopic signature of the organic matter mineralized in the sediment was calculated. The results are given in Table 3. In order to provide a more robust estimate, we used the asymptotic values of [DIC], δ13C, ∆14C to calculate this signature. We chose the deepest result for [DIC] and the mean between the two deepest values for δ13Cpore and ∆14Cpore. For bottom water composition we used the values measured at station A: δ13Cbw= –1‰ and ∆14Cbw=+38.5‰.
Table 3 Parameters and results of the DIC mixing model with the fraction of bottom water (x) and pore waters (1–x) DIC in the mix, the signature of pore waters (pore) and bottom waters (BW) adopted from the results (δ13C and ∆14C) and the calculated signature of mineralized OM in δ13C OM and ∆14C OM.

Table 3 shows that with the assumptions made here, the original isotopic signature of the OM remineralized at each station of the prodelta (A and Z) has a δ13C signature ranging between –25.3‰ and –25.7‰ and a ∆14C signature between +475‰ and +618‰, whereas values of –20.1‰ and +41‰ respectively are obtained further on the shelf at station D.
It is worth mentioning that the recalculated isotopic parameters for the mineralized OM are quite uncertain especially for station D where the DIC increase is limited. The mixing model would perform much better with a denser set of data at depth, since for this station, a slight change of 200 µmol/L in the asymptotic DIC concentration changes the recalculated δ13C by almost 1‰. Nevertheless, the aim of this work was to constrain the origin of OM mineralized in delta sediment using simultaneous 13C and 14C measurements of pore waters DIC and limited uncertainty does not alter the conclusions drawn from this study.
DISCUSSION
At stations A and Z located close to the river mouth, DIC concentrations in pore waters show a large increase downcore and reach around 30 mM at 23 cm depth, a factor of 10 larger than bottom seawater water. Lansard et al. (Reference Lansard, Rabouille, Denis and Grenz2009), Cathalot et al. (Reference Cathalot, Rabouille, Pastor, Deflandre, Viollier, Buscail, Gremare, Treignier and Pruski2010), and Pastor et al. (Reference Pastor, Deflandre, Viollier, Cathalot, Metzger, Rabouille, Escoubeyrou, Lloret, Pruski, Vetion, Desmalades, Buscail and Gremare2011) showed that the Rhône River delta sediments form a significant deposition zone where large quantities of OM brought by the Rhône River are mineralized and accumulation of particles is high (between 30 and 40 cm yr–1). This organic-rich environment promotes the presence of a community of benthic fauna, bacteria and archaea that actively transforms the incoming Org-C into DIC via oxic and anoxic remineralization processes (Pastor et al. Reference Pastor, Deflandre, Viollier, Cathalot, Metzger, Rabouille, Escoubeyrou, Lloret, Pruski, Vetion, Desmalades, Buscail and Gremare2011; Rassmann et al. Reference Rassmann, Lansard, Pozzato and Rabouille2016). On the continental shelf, however, the deposition of organic matter is much lower (<0.3 cm yr–1) and its mineralization displays a lower intensity (Lansard et al. Reference Lansard, Rabouille, Denis and Grenz2009; Pastor et al. Reference Pastor, Deflandre, Viollier, Cathalot, Metzger, Rabouille, Escoubeyrou, Lloret, Pruski, Vetion, Desmalades, Buscail and Gremare2011). In the prodelta area, the SPM Org-C content is around 10% whereas on the shelf near station D it is around 4% (Cathalot et al. Reference Cathalot, Rabouille, Tisnerat-Laborde, Toussaint, Kerherve, Buscail, Loftis, Sun, Tronczynski, Azoury, Lansard, Treignier, Pastor and Tesi2013; Toussaint et al. Reference Toussaint, Tisnerat-Laborde, Cathalot, Buscail, Kerherve and Rabouille2013). This is also noticeable from the Org-C content of surface sediments which decreases from 2% in prodelta sediments to 1% in continental shelf sediments (Cathalot et al. Reference Cathalot, Rabouille, Tisnerat-Laborde, Toussaint, Kerherve, Buscail, Loftis, Sun, Tronczynski, Azoury, Lansard, Treignier, Pastor and Tesi2013; Toussaint et al. Reference Toussaint, Tisnerat-Laborde, Cathalot, Buscail, Kerherve and Rabouille2013).
In order to elucidate the sources of sediment OM and remineralized OM, all δ13C and ∆14C results are plotted in the same graphic. We also report the isotopic signatures of different sources of organic carbon in the square boxes. These fractions can possibly be mineralized in the sediments (Olsson and Osabede 1974) (Figure 5).
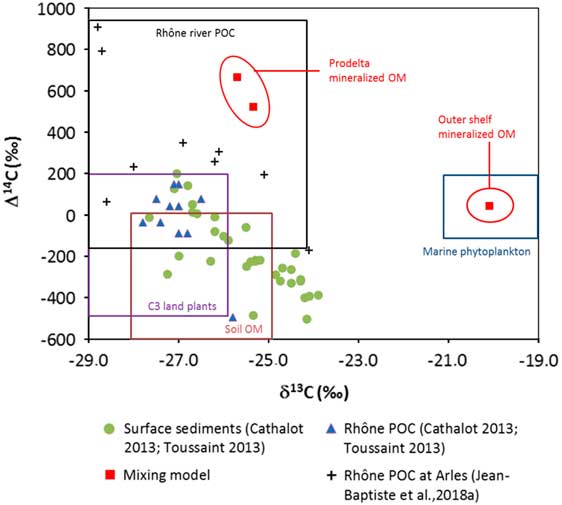
Figure 5 All ∆14C versus δ13C data measured on the Rhône river POC, in the Rhône delta surface sediments from previous studies (Cathalot Reference Cathalot, Rabouille, Tisnerat-Laborde, Toussaint, Kerherve, Buscail, Loftis, Sun, Tronczynski, Azoury, Lansard, Treignier, Pastor and Tesi2013; Toussaint Reference Toussaint2013; Jean-Baptiste et al. Reference Jean-Baptiste, Fontugne, Fourré, Marang, Antonelli, Charmasson and Siclet2018a) and values calculated with the mixing model.
Terrestrial organic matter has a stable isotopic carbon composition estimated around 26±1‰ (Cathalot et al. Reference Cathalot, Rabouille, Tisnerat-Laborde, Toussaint, Kerherve, Buscail, Loftis, Sun, Tronczynski, Azoury, Lansard, Treignier, Pastor and Tesi2013; Higueras et al. Reference Higueras, Kerherve, Sanchez-Vidal, Calafat, Ludwig, Verdoit-Jarraya, Heussner and Canals2014) and values between –19‰ and –21‰ for marine material (Harmelin-Vivien et al. Reference Harmelin-Vivien, Dierking, Banaru, Fontaine and Arlhac2010). The δ13C values around –25.5‰ calculated for the mineralized OM in the prodelta sediments (station A and Z) indicate strong mineralization of terrigenous sources whereas the calculated δ13C value around –20‰ at station D on the outer shelf indicates a marine source. These results are in accordance with Toussaint et al. (Reference Toussaint, Tisnerat-Laborde, Cathalot, Buscail, Kerherve and Rabouille2013) and the idea that most of the terrestrial OM is rapidly deposited and mineralized in the prodelta (Pozzato et al. Reference Pozzato, Rassmann, Lansard, Dumoulin, van Brugel and Rabouille2018) whereas further on the shelf less terrigenous substrate is deposited and it is mainly marine OM that is mineralized. In this zone, mineralization has a lower impact on the δ13C of pore waters DIC than in the prodelta with an isotopic composition strongly influenced by the seawater water bicarbonate (δ13C= –1‰). These results contrast with the stability observed in particulate organic carbon isotopic compositions which range between –25 and –27.5‰ on the entire continental shelf (Jean-Baptiste et al. Reference Jean-Baptiste, Fontugne, Fourré, Marang, Antonelli, Charmasson and Siclet2018a; Cathalot et al. Reference Cathalot, Rabouille, Tisnerat-Laborde, Toussaint, Kerherve, Buscail, Loftis, Sun, Tronczynski, Azoury, Lansard, Treignier, Pastor and Tesi2013).
Radiocarbon distribution in pore waters and sediments is also different in the prodelta and the outer shelf. At Station D, degraded OM with a calculated 14C signature around +45‰ presents a value very close to that of surface or bottom marine waters while sediments are heavily depleted in 14C (mean ∆14C=–335 to –569‰) in agreement with previous measurements (Cathalot et al. Reference Cathalot, Rabouille, Tisnerat-Laborde, Toussaint, Kerherve, Buscail, Loftis, Sun, Tronczynski, Azoury, Lansard, Treignier, Pastor and Tesi2013). Conversely, at stations A and Z, the signature of mineralized OM recalculated using the mixing model shows enriched ∆14C values around +523‰ (A) and +667‰ (Z), comparable to the high range of values observed in the Rhône River SPM in Arles (Jean-Baptiste et al. Reference Jean-Baptiste, Fontugne, Fourré, Marang, Antonelli, Charmasson and Siclet2018a) and the few previous measurements available.
Sediments do not display such extremely enriched values as pore waters with a mean of ∆14C=–33‰ at stations A and Z. This 14C distribution can be explained by the preferential and rapid mineralization by organisms of fresh SPM rich in 14C in the prodelta sediments. In the sediment, the fraction that remains is composed mostly of old 14C-depleted organic matter corresponding to residues from previous mineralization and carbon from erosion or stored for a long time in the river conduit.
These observations are in agreement with the findings of Aller et al. (Reference Aller, Blair and Brunskill2008) in the Fly River delta who showed that younger, labile, more reactive fractions of organic matter are preferentially degraded in sediments whereas a major semi-refractory fraction is mostly buried in the sediment. These two combined processes can create an “apparent aging” of the sediment and may distort interpretation of the data. Such a discrepancy ultimately justifies the importance and the necessity of working on both sediment and pore waters simultaneously in order to understand the origin and dynamics of OM in deltaic/estuarine sediments.
CONCLUSION
The results obtained by the paired 13C/14C DIC isotopes associated with a mixing model are compatible with the reported view of a prodelta system dominated by riverine inputs near the river mouth and progressively losing the river influence offshore on the shelf. However, this paper provides interesting insights into the origin of mineralized organic matter. In shelf sediments, mineralization is largely dominated by marine organic matter, as calculated by the mixing model. In prodelta sediments where mineralization of continental organic matter dominates, the enriched 14C signature of sediment pore waters DIC indicates that in-stream production, freshly produced and possibly marked by anthropogenic nuclear activities, is preferentially mineralized in the pore waters and does not remain in the sediment. A shift exists between ∆14C values of deposited OM and mineralized OM. Two different classes of particulate OM with contrasted properties are discharged by the Rhône River to the prodelta sediments. One is a labile and fresh OM originating from river algae production via photosynthesis with a nuclear 14C signature which is mostly and quickly mineralized in surface sediments. The other is a semi-refractory OM originating from soil erosion or long-stored material transported by floods, which is mostly buried. If the young and labile component is preferentially mineralized and the old and refractory material is buried, this explains the large difference in ∆14C activities between the two different pools which creates an apparent aging of the sediment. Pore waters prove to be an extremely useful tool for understanding the fate of organic carbon in marine sediments and provide additional information to sediments alone. It therefore seems promising to couple the two approaches to better understand the carbon budget in estuarine sediments.
ACKNOWLEDGMENTS
The authors gratefully acknowledge C Hatté and C Gauthier for the δ13C analysis. The authors thank the captains and crews of the RV Thetys II and for their help during the sampling campaign. B Bombled and Weifang Chen provided technical help during the expedition. Thanks to CNR and MOOSE for Rhône hydrological data. We also thank ANR-AMORAD Investissement d’Avenir and Mermex-MISTRALS for their funding. The LMC14 is funded by five French organizations: CEA, CNRS, IRD, IRSN, and MCC. This is LSCE contribution number 6407.