


INTRODUCTION
The main aims of the EU 2003/30/EC directive are to increase sustainability, reduce fossil fuel dependence, and reduce the increase of atmospheric CO2 levels (Chase et al. Reference Chase, Pielke, Kittel, Zhao, Pitman, Running and Nemani2001; Oinonen et al. Reference Oinonen, Hakanpaa-Laitinen, Hamalainen, Kaskela and Junger2010). Renewable components or biofuels are produced by different biological processes, such as anaerobic digestion or fermentation from recent organic matter. In contrast, fossil fuels were produced by geological processes from prehistoric biological matter which does not contain radiocarbon (14C). The chemical properties and composition of these biological components are generally quite similar to recently used fossil fuels. Due to the chemical and physical similarities of the biobased compounds to the fossil fuel, it is simple to intermix them without any major special modifications to the engine systems of vehicles (Deepanraj et al. Reference Deepanraj, Dhanesh, Senthil, Kannan, Santhoshkumar and Lawrence2011; Lawrence et al. Reference Lawrence, Mathews and Deepanraj2011). On the other hand, due to these physical and chemical similarities, the post-production verification measurements of the bio/fossil mixing ratio is often quite difficult using common industrial analytical or chromatographic methods. Consequently, the independent determination of bio/fossil mixing ratio is a primary issue from both technical and the economic aspects. Measurement of fossil and biological fuel origin is highly effective using radiocarbon as a biogenic tracer (EU Directive 2003; Dijs et al. Reference Dijs, Windt van der, Kaihola, Borg and van der2006; Norton and Devlin Reference Norton and Devlin2006; Norton et al. Reference Norton, Hood and Devlin2007; Yunoki and Saito Reference Yunoki and Saito2009; Oinonen et al. Reference Oinonen, Hakanpaa-Laitinen, Hamalainen, Kaskela and Junger2010; Vrtiška and Šimácek Reference Vrtiška and Šimácek2016). The biogenic fraction determination based on 14C content measurement is possible in different ways. The direct measurement of the 14C activity of liquid fuels by liquid scintillation counter (LSC) is a fast method but burdened by some disadvantages. For example, the color of fuels causes different quenching properties in the scintillation cocktail and affects the measurement efficiency (Doll et al. Reference Doll, Wright, Morley and Wright2017). Based on the measurement of radiocarbon content as 14C/12C and 14C/13C isotope ratio, the biogenic fraction is also measurable by accelerator mass spectrometry (AMS), where the number of 12C, 13C, and 14C atoms can be counted directly (Bronić et al. Reference Bronić, Barešić, Horvatinčić and Sironić2017). In this study, the biobased content of reference samples from the Hungarian oil company, MOL Nyrt., with predetermined mixing ratios were measured by the EnvironMICADAS AMS at the Hertelendi Laboratory of Environmental Studies (HEKAL) (Molnár et al. Reference Molnár, Janovics, Major, Orsovszki, Gönczi, Veres, Leonard, Castle, Lange, Wacker, Hajdas and Jull2013). The main aim of the study was to develop a simple, fast, and reproducible sample preparation method for AMS 14C measurement of liquid fuel samples.
Methods
Properties of the Applied Bio- and Diesel Fuels
In this study, we used fuel blends that included fossil and biofuel mixtures. The different fuel types have quite similar physical and chemical properties, as shown in Table 1.
Table 1 Typical properties of different fuel components (Aatola et al. Reference Aatola, Larmi, Sarjovaara and Mikkonen2009).
* Calculated carbon content. The carbon content was calculated from FAMEs of different chain lengths by the molecular formula. The carbon content of the FAME slightly depends on the length of polycarbon chains and carbon number.
HVO (hydrotreated vegetable oils) are sulfur and aromatic compound-free, chemically hydrogenated vegetable oils, or paraffin hydrocarbon mixes. HVO is produced from raw vegetable oil or different triglycerides-rich material, such as used cooking oil and animal fat (Huber et al. Reference Huber, O’Connor and Corma2007). These HVO compounds are known as renewable diesel fuels, while fatty acid methyl esters (FAME) are known as biodiesels, as these compounds are biodegradable and eco-friendly with low toxicity and vapor pressure. The leading process of producing FAME is transesterification of plant oils, fats and extraction from algae (Vyas et al. Reference Vyas, Verma and Subrahmanyam2010; Nigam and Singh Reference Nigam and Singh2011). The production of HVO is less difficult from these waste materials than the production of FAME. As shown in Table 1, the properties of fossil and renewable liquid fuels from different sources are quite similar (Gonzalez et al. Reference Gonzalez, Caro, Thiebaud-Roux and Lacaze-Dufaure2007; Aatola et al. Reference Aatola, Larmi, Sarjovaara and Mikkonen2009). Furthermore, differentiation by classical chemical methods is rather complicated, due to the colour and physical properties of the compounds, and differentiation by liquid scintillation counting is also difficult.
Mixed Fuel Test Samples from MOL
Fourteen different test samples with known composition and biocomponent mixing ratio were provided by MOL Nyrt. company for this study (Table 2). Note that FUEL_2 sample is EN 590 standard diesel fuel.
Table 2 Biocontent composition of test fuel samples.

The biocompound mass percentages were calculated using the weight of the added biocompound and the fossil fuel measured at the laboratory of MOL by gravimetric methods with a Sartorius 1702MP8 Electronic Analytical Balance, giving a precision of ≤±0.1 mg. Certain samples contained only FAME or HVO as biocompounds, while other samples were mixed with both of them (FAME and HVO) (Table 2).
The biocontent of the test mixtures was defined by MOL in connection with the recent EU regulation for mixing rates of liquid fuels in the transport sector (0.7–2% biofuel content) and the projected higher rates (2–10% biofuel content). In this way the method developed can be tested to determine FAME and/or HVO derived proportions of fuel blends, which are very close to the recently used commercial fuels.
As the weight percent of reference sample mixtures were known, it was possible to test and evaluate the ultimate accuracy and performance of the complete AMS 14C measurement based biocontent analyses at HEKAL. The samples were stored in sealed glass vials until the AMS sample preparation, at +5ºC.
Preparation and Combustion for AMS Analyses
The samples were prepared without filtration or any other physical pretreatment. 4–5 mg of the samples was dropped onto MnO2 powder in a borosilicate glass combustion tube (Duran, 150 mm long, 9 mm O.D.) then attached to a vacuum system, cooled in advance by dry ice and alcohol slush before being evacuated using a vacuum pump. After a short pumping time, the combustion glass tubes were sealed using a gas torch. Finally, all of the sealed tube samples were combusted at 550ºC, for 24 hr following a simplified MnO2 based combustion method, developed in HEKAL (Janovics Reference Janovics2015). A compact vacuum line was used to quantitatively extract and purify the CO2 from the combusted samples. Combusted sealed tube samples were attached and cracked up in the vacuum line (ultimate vacuum is <1×10⁻² mbar, by dry scroll pump) by a special glass tube cracker supplied with a needle (Janovics Reference Janovics2015). The water vapor was trapped with isopropyl alcohol-dry ice mixture trap (at –78ºC) and the CO2 was frozen into a next trap by liquid nitrogen at –196ºC. The pressure of collected CO2 gas sample at room temperature was measured by a high precision MKS Baratron pressure transducer in a known volume to determine the exact amount of the C yield/content. The purified CO2 samples were graphitized by the sealed tube Zn-based graphitization method (Rinyu et al. Reference Rinyu, Molnár, Major, Nagy, Veres, Kimák, Wacker and Synal2013) and their 14C activity was measured by AMS at HEKAL (Molnár et al. Reference Molnár, Janovics, Major, Orsovszki, Gönczi, Veres, Leonard, Castle, Lange, Wacker, Hajdas and Jull2013). For each test sample, 4–7 parallel repetitions were prepared and measured to examine the reproducibility of the method. In this study, IAEA C-9 standards were also prepared along with the samples for quality control and chemical blank investigation. After the AMS analyses, pMC (percent modern carbon, where 100 pMCabs which refers to a specific 14C activity concentration of 226 Bq/kg C, normalized to AD 1950 and –25‰ δ13CVPDB), was used for the calculation of the biocomponent fraction. MICADAS Bats data reduction software was used for the evaluation of the results (Wacker et al. Reference Wacker, Christl and Synal2010) including δ13C isotope fractionation correction.
Determination of the Biocontent Ratio
The radiocarbon-specific activity of fossil fuel carbon is zero, which refers to 0 pMC (hereafter pMCF), as its 14C content has completely decayed away (half-life is 5700±30 yr) during long geological storage. The percent modern carbon in the bio-components (hereafter pMCB) is similar to the value of the atmospheric CO2 (close to 100 pMC) (Berhanu et al. Reference Berhanu, Szidat, Brunner, Satar, Schanda, Nyfeler, Battaglia, Steinbacher, Hammer and Leuenberger2017) as carbon in plant organic compounds are result of photosynthesis of the atmospheric CO2. Total 14C activity (AT) and total mass (mT) of the fuels are the sum of the 14C activity and mass of the fossil fuel component (AF and mF, respectively) and the 14C activity and mass of the biogenic fuel component (AB and mB, respectively):
 $${\rm A}_{\rm T} {\equals}{\rm A}_{\rm F} {\plus}{\rm A}_{\rm B} \quad\,{\rm and}\,\quad {\rm m}_{\rm T} {\equals}{\rm m}_{\rm F} {\plus}{\rm m}_{\rm B} $$
As the fossil fuel total 14C is zero (AF=0), thus the total 14C activity of the fuel can be defined from its bio content:
 $${\rm A}_{\rm T} {\equals}{\rm A}_{\rm B} $$
The total 14C activity (normalized to stable isotope fractionation and to AD 1950) can be expressed as a product of the percent modern carbon (pMC), total carbon content (m), and carbon mass concentration (c), as:
 $${\rm A}_{\rm T} {\equals}{\rm pMC}_{\rm T} {\times}{\rm m}_{\rm T} {\times}{\rm c}_{\rm T} {\equals}{\rm pMC}_{\rm B} {\times}{\rm m}_{\rm B} {\times}{\rm c}_{\rm B} {\equals}{\rm A}_{\rm B} $$
Thus, the mass ratio of biogenic fraction in a mixed fuel (mB/mT) can be calculated by the following equation, based on the radiocarbon content and the mass balance:
 $${\rm m}_{\rm B} \,/\,{\rm m}_{\rm T} {\equals}\left( {{\rm c}_{\rm T} {\times}{\rm pMC}_{\rm T} } \right)\,/\,\left( {{\rm c}_{\rm B} {\times}{\rm pMC}_{\rm B} } \right)$$
where cT and cB is the carbon concentration of the total mixture and biogenic component, respectively, while pMCT and pMCB is the pMC values of total mixture and fossil component, respectively.
According to the assumptions of the ASTM D6866-12 standard, if the carbon percentage of fossil (cF) and biobased (cB) components are close to each other, their ratio is close to 1. With this assumption, Equation 4 can be further simplified to:
 $${\rm m}_{\rm B} \,/\,{\rm m}_{\rm T} {\equals}{\rm pMC}_{\rm T} \,/\,{\rm pMC}_{\rm B} $$
Furthermore, the ASTM D6866-12 standard makes an assumption to the specific 14C activity of the commonly used biocomponent to fix it as a constant value (about 105% as pMCB for all kind of biocomponents, for the year 2010). The theory behind is that nearly all new biobased products are produced in a post-bomb environment, all pMC values (after correction for isotopic fractionation) must be multiplied by 0.95 (as of 2010) to better reflect the true biobased content of the sample. Considering the effect of the 1960s bomb peak, the value is not 100 pMC (F) (1F=100 pMCabs), but a little higher value (1.05 F, 105 pMC), which means practically a multiplication by 0.95 (as a reciprocal of ∼1.05 fM) in these equations (1/pMCB=0.95). Using this further assumption the standard applies the next simplified equation for the bio/fossil mass ratio calculation for mixed fuels:
 $${\rm m}_{\rm B} \,/\,{\rm m}_{\rm T} {\equals}{\rm pMC}_{\rm T} {\times}0.95$$
In practice, different biocompounds may have varying 14C (pMCB) values, depending on whether only FAME, only HVO, or FAME and HVO together were added to the blend. The actual pMCB is also dependent on the year of biogenic production, because the specific radiocarbon activity of the atmospheric carbon level was constantly decreasing since the 1960s, after the bomb-peak (Hua et al. Reference Hua, Barbetti, Jacobsen, Zoppi and Lawson2000; Quarta et al. Reference Quarta, Elia, Valzano and Calcagnile2005). Hence, more precise biocontent value may be obtained using Equation 4 or 5 if it is possible measure directly the pMCB of the biocompounds used instead of relying on the fixed (assumed) constant pMCB value assumed by the ASTM D6866-12 standard (Equation 6). In this study, we present results according to ASTM D 6866-12 also (see Equation 6) instead of the later versions of the standard (etc ASTM D 6866-16 and ASTM D 6866-18). At the time of the measurements and the evaluation of our results only the ASTM D 6866-12 standard was available. ASTM D 6866-12 standard was widely applied around the world by many other studies that is why we also aimed to highlight the possible related problems as well.
RESULTS AND DISCUSSION
Carbon Contents
The extracted CO2 gas from the samples was measured in a calibrated volume to determine the carbon content (Measured cT) of the blends as described in the Methods section. Using the biocontent composition and measured cT data of the pure, non-mixed bio (FUEL_8, FUEL_9) and fossil fuel (FUEL_2) samples, an expected cT was calculated for the mixed blends. Then, comparing the expected and measured cT of mixed samples, the carbon (C) yield was determined, which was >98% in every case, as shown in Table 3.
Table 3 Carbon content and yield of preparation.

* Expected cT was calculated using the measured cT of the pure bio- and fossil fuel compounds and biocontent composition of blends.
As Table 3 shows, the pure FAME samples have the lowest cT. The exact carbon content value is important, if we use Equation 4 for the determination of biocomponent ratio, because this data affects the final result.
14C Analysis of Fuel Mixtures by AMS
For estimation of the biocomponent ratio, the calculated biocomponent ratio was determined from the calculated mass percentage and measured carbon content of blends. The measured 14C content results of fuel blends between 0.7 and 9.4% biofraction ratio are shown in the Table 4 in pMC units. Based on these data, the biobased content ratio was determined using different assumptions (as given by Equations 4–6) within a weight precision of±0.2 m/m %, except for the samples FUEL_12, 13, and 14, where we could estimate the biocomponent ratio within a precision of 0.3 m/m %. The pMC of the pure FAME samples (FUEL_9, FUEL_14) are lower than 100 pMC, because FAME contains a methyl group originated from fossil sources that are usually used in the production process due to the cost-efficiency (Holmgren et al. Reference Holmgren, Gosling, Marinangeli, Marker, Faraci and Perego2007).
Table 4 Results estimated by 14C AMS measurement and different calculation methods.

Comparisons between the estimated and real mixing ratios value can be made, as the exact biocomponent ratio value was known. The results obtained using the different assumption (as given by Equations 4–6) are quite similar for all the tested sample mixtures, as shown in Table 4 and Figure 1. The R2 value is higher than 0.99 in each case, showing that all of the estimations made from the measured 14C activity correlate very well with the calculated biocomponent ratios. Clearly, the different assumptions (in Equations 4–6) gave quite accurate results with relatively low error and good agreement in each case. The lowest difference between the calculated and the estimated biocontent values is given by Equation 4, which used the real measured carbon concentrations for the calculation of the biocontent. This confirms that fewer assumptions and more measured parameters give better results. On the other hand, this approach also have higher reported error bars at the end of the whole calculation due to the propagation of known uncertainties of the applied more measured parameters. Lower errors are found for the simpler calculations (Equations 5 and 6) however, these can underestimate error ranges, as the uncertainty of the applied assumptions are not taken into account.
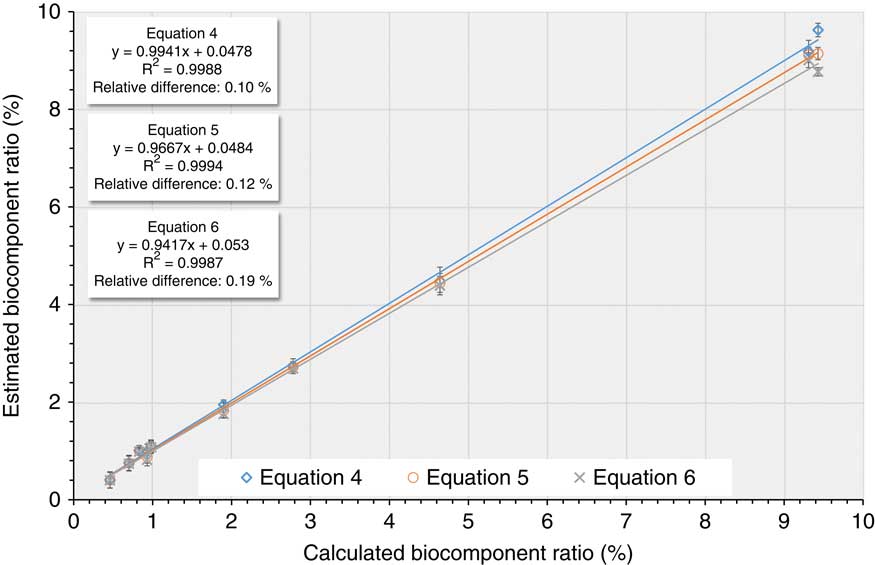
Figure 1 Correlation of the mixtures’ estimated biobased content to the calculated biofraction.
The simplified biocontent calculation methods result in underestimated error ranges and they gave almost twice the scatter compared to Equation 4. From a practical point of view, all of the estimated biocarbon content shows a good agreement with the calculated values, however the simplified approaches (i.e. Equations 5 and 6) also resulted in a bit higher deviations from the real, expected values. If the exact carbon content was not used for the determination of biocomponent ratio, the final value can be underestimated, because the carbon concentrations of the different components are not the same, and this can affect the final results. These results show that the AMS measurement and the sample preparation techniques developed are precise enough to determine the biobased content of fuel blends in the range of 0–10% bio content. Quarta et al. (Reference Quarta, Calcagnile, Giffoni, Braione and Marisa2013) pointed out that δ13C mass fractionation correction for fossil/biogenic mixtures is complex and can give rise to problems when AMS technique is applied, however, when the biogenic content is lower than 10%, this gives only a negligible change in the uncertainty (Quarta et al. Reference Quarta, Calcagnile, Giffoni, Braione and Marisa2013; Palstra et al. Reference Palstra and Meijer2014).
CONCLUSION
A relatively easy and fast method was used at the MTA ATOMKI Hertelendi Laboratory of Environmental Studies for liquid biofuel biocontent analyses. The method was effectively used for 14 fuel samples with a 1σ uncertainty to better than±0.3 m/m %. The precision and reproducibility of our method give similar precision to published techniques (Norton et al. Reference Norton, Hood and Devlin2007; Oinonen et al. Reference Oinonen, Hakanpaa-Laitinen, Hamalainen, Kaskela and Junger2010), even in the quite low mixing ratio range (<1%). The preparation time was significantly reduced by using a sealed-tube combustion method with MnO2. Thanks to the low volume vacuum line, the gas purification time on the vacuum system can be performed in less than 10 min/sample. The bottlenecks of the AMS measurement technique are the sample preparation, combustion, and graphitization whereas the time of a normal AMS measurement itself is fixed. Using the specified MnO2 combustion method combined with the sealed tube graphitization, all of the samples can be combusted and later graphitized altogether (up to 30 samples/normal working day). All things considered, the complete analyses of 30 unknown samples is feasible within 3 normal working days. These results show that the AMS 14C measurement technique is an excellent method for determination of biobased content in fuel blends, even below 1.0 m/m %.
Acknowledgments
The research was supported by the European Union and the State of Hungary, co-financed by the European Regional Development Fund in the project of GINOP-2.3.2-15-2016-00009 “ICER”.


