INTRODUCTION
Significant advances in the graphitization and accelerator mass spectrometry (AMS) dating of small samples have been made in recent years (e.g. Santos et al. Reference Santos, Southon, Griffin, Beaupre and Druffel2007; Delqué-Količ et al. Reference Delqué-Količ, Caffy, Comby-Zerbino, Dumoulin, Hain, Massault, Moreau, Quiles, Setti, Souprayen, Tannau, Thellier and Vincent2013), but only one of these studies has specifically targeted small carbonate samples for use in paleoceanograpic research (Shah Walter et al. Reference Shah Walter, Gagnon, Roberts, McNichol, Gaylord and Klein2015).
Carbonate samples, primarily foraminifer shells, are graphitized in the Godwin Radiocarbon Laboratory and pressed into cathode targets before being sent for AMS analysis. The laboratory was initially set up and developed to run samples containing ~0.6 mg C (~6 mg of carbonate), but demand for running smaller samples allowing, in particular, dating of foraminifera from deep-sea cores where abundances are low, has led us to adapt the process to run smaller samples.
In order to do this, background contamination must be accurately determined and reduced. The contamination in our methodology is predominantly modern carbon, with high 14C/12C, such that older and smaller samples are most affected. Fractionation of isotopes during the graphitization process must also be minimized for samples of all sizes and ages, primarily by ensuring the reduction reaction goes to completion.
The graphitization process is complex and involves several reactions that are sensitive to temperature, pressure, the initial ratio of H2:CO2, water content, the catalyst, and various other factors. Since a high yield of graphite must be produced in order to minimize fractionation of the carbon isotopes, all of these parameters need to be optimized. Here, the yield, fractionation (using both δ13C and Δ14C measurements), and contamination are used to optimize the setup and procedures in order to produce accurate 14C measurement on small samples of carbonate.
Both the background contamination and the amount of fractionation during graphitizing were minimized by changing various aspects of the process for both full-size and small samples. The new setup was then tested with the secondary standard IAEA-C8 and with a mix of IAEA-C2 and Icelandic spar calcite combined to give an age of around 20,300yr that was split into small samples.
METHODS
Laboratory Setup and Experimental Procedure
The new Godwin 14C preparation facility was set up based on that used at the Australian National University (ANU), which is in turn based on the CAMS-LLNL design. The laboratory contains one vacuum line with 11 small-volume reactors (~4.0 cm3) fitted with 0–15psi pressure transducers and two 50-mm quartz tubes (with 4-mm internal diameter) (Figure 1). These reactor tubes are connected to a modified stainless steel Swagelok Ultra-Torr T connector, with three
 $${\raise0.5ex\hbox{$\scriptstyle 1$}\kern-0.1em/\kern-0.15em\lower0.25ex\hbox{$\scriptstyle 4$}}$$
inch connections (for the input, reactor tube, and perchlorate tube) and one 1/8 inch connection (for the pressure transducer). Each reactor is preloaded with iron powder and magnesium perchlorate and flushed with hydrogen several times. One atmosphere of hydrogen is added to the reactors that are then heated for 90 min at 450°C to precondition the line immediately prior to graphitizing. This removes much of the carbon contamination and improves the effectiveness of the iron powder as a catalyst. For carbonate samples, CO2 is produced by reacting the sample with phosphoric acid in an evacuated double-septum vial at 80°C for a minimum of 1 hr. The carbonate is loaded into the vial, which is then evacuated before warmed phosphoric acid is injected using a single needle and gas-tight syringe. The CO2 is then introduced into the line via a needle and water vapor is removed using an ethanol cold trap at –80°C. The CO2 is transferred into a reactor and hydrogen added to give the desired H2:CO2 (see Discussion). Each reactor is then heated at 650°C for at least 2.5 hr, until the reactor pressure reaches a minimum. Finally, the graphite is removed from the line and pressed into cathode targets to be sent to the AMS laboratory along with backgrounds and standards. The carbonate backgrounds and secondary standard IAEA-C2 are graphitized in the same way as the samples. Primary standard OXII and additional secondary standards IAEA-C7 and IAEA-C8 are heated with copper oxide and silver at 900°C for 300 min in sealed evacuated quartz tubes to produce CO2, which is then introduced to the line and split into individual samples.
$${\raise0.5ex\hbox{$\scriptstyle 1$}\kern-0.1em/\kern-0.15em\lower0.25ex\hbox{$\scriptstyle 4$}}$$
inch connections (for the input, reactor tube, and perchlorate tube) and one 1/8 inch connection (for the pressure transducer). Each reactor is preloaded with iron powder and magnesium perchlorate and flushed with hydrogen several times. One atmosphere of hydrogen is added to the reactors that are then heated for 90 min at 450°C to precondition the line immediately prior to graphitizing. This removes much of the carbon contamination and improves the effectiveness of the iron powder as a catalyst. For carbonate samples, CO2 is produced by reacting the sample with phosphoric acid in an evacuated double-septum vial at 80°C for a minimum of 1 hr. The carbonate is loaded into the vial, which is then evacuated before warmed phosphoric acid is injected using a single needle and gas-tight syringe. The CO2 is then introduced into the line via a needle and water vapor is removed using an ethanol cold trap at –80°C. The CO2 is transferred into a reactor and hydrogen added to give the desired H2:CO2 (see Discussion). Each reactor is then heated at 650°C for at least 2.5 hr, until the reactor pressure reaches a minimum. Finally, the graphite is removed from the line and pressed into cathode targets to be sent to the AMS laboratory along with backgrounds and standards. The carbonate backgrounds and secondary standard IAEA-C2 are graphitized in the same way as the samples. Primary standard OXII and additional secondary standards IAEA-C7 and IAEA-C8 are heated with copper oxide and silver at 900°C for 300 min in sealed evacuated quartz tubes to produce CO2, which is then introduced to the line and split into individual samples.
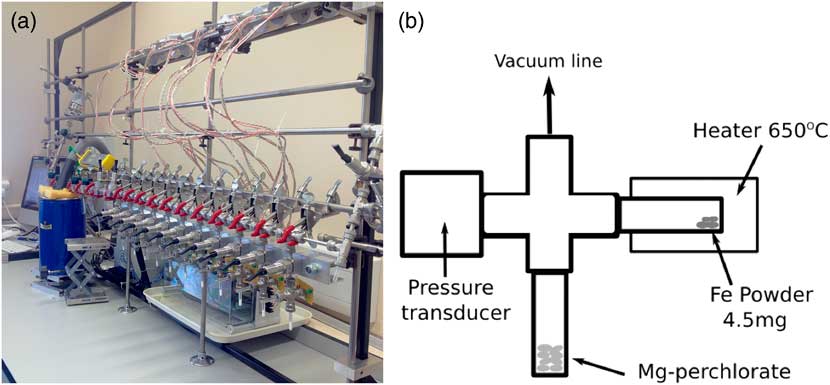
Figure 1 (a) Photograph of the Godwin Radiocarbon Laboratory. (b) Schematic diagram of the reactor setup.
Isotope Measurements
Once graphitized, samples were either prepared for stable isotope analysis or for 14C dating at an AMS facility. Samples for stable isotope analysis were ground into a fine powder and transferred into tin capsules in the Godwin Laboratory, University of Cambridge. These were then run on a Costech elemental analyzer attached to a Thermo DELTA V mass spectrometer in continuous-flow mode along with IAEA reference standards. The precision of analyses is better than 0.1‰ for 13C/12C.
Samples for 14C analysis were pressed into NEC aluminium cathode targets before being sent to the Chrono Centre, Belfast, or on one occasion for this study, the AMS facility at ANU. Each set of samples was run with primary and secondary standards along with calcite blanks (Icelandic spar) produced in our laboratory via the aforementioned methods.
Yield
The yield is calculated based on the pressure in each reactor, using the equation
 $${\rm Yield}{\equals}{{(p{\rm H}_{2} {\plus}p{\rm CO}_{2} )_{{{\rm initial}}} {\minus}{\rm residual}\,{\rm pressure}} \over {3{\times}p{\rm CO}_{{2,\,{\rm initial}}} }}$$
where pH2initial and pCO2initial are the initial pressures of H2 and CO2, respectively, and residual pressure is the final pressure at the end of heating.
Optimizing the Process
Three different iron powders were tested: Analar Normapur, Alfa Aesar-325 mesh, and Fisher Fe. For each, the amount was kept constant at 4.5–5 mg and the experimental procedure was identical. The amount of hydrogen added to the CO2 was varied to find the optimal H2:CO2. The temperature and duration of heating were also investigated to maximize the yield and the rate of reaction. Each of these variables was optimized using the yield, δ13C, and Δ14C measurements to ensure the reaction was complete, with minimal contamination, and within the shortest time. A standard and a carbonate sample of approximately 20 kyr age were then used to test the new setup for a range of sample sizes.
RESULTS AND DISCUSSION
Iron Powder
Samples of 14C-“free” Icelandic spar calcite were graphitized using three different iron powders as the catalyst. For each, a range of sample sizes was graphitized and the yield determined to assess the completeness of the reaction and hence the potential for fractionation. The samples were then sent to the AMS laboratory to be dated in order to determine the background contamination levels.
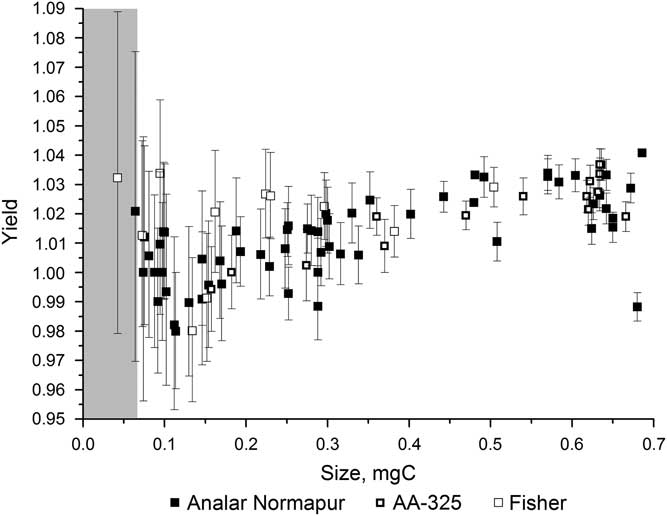
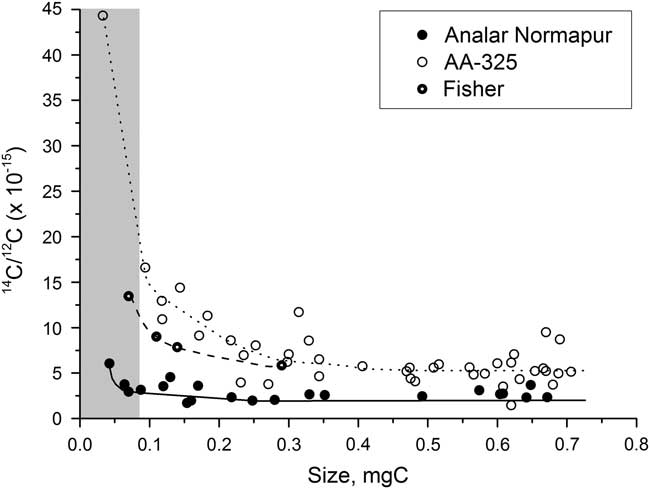
Figure 2 shows the variation in yield for the different iron powders over a range of sample sizes. The yield was high, over 98%, for all of the iron powders for samples ranging from 0.04 to 0.7 mg C and often greater than 100% (see section “H2 to CO2 Ratio”). There is a fair amount of scatter in the yields, especially for the smaller samples, but none of the iron powders had a significantly better yield than the others. Figure 3 shows the background 14C/12C data for a range of sample sizes using each of the three iron powders. This clearly shows that the background varies significantly depending on the iron powder used, with Alfa Aesar-325 leading to the highest background values and Analar Normapur being associated with the lowest background values. A lower background means that samples can be smaller and/or older before they are significantly affected by the contamination. Background (i.e. “14C-dead”) samples smaller than 0.3 mg C start to be significantly affected by the contamination when Alfa Aesar-325 is used, whereas only those smaller than around 0.07 mg C are affected when Analar Normapur is used. For this reason, Analar Normapur is now used as the catalyst for all samples.

Figure 2 Yields resulting from using different iron powders to catalyze the graphitizing reaction, for a range of sample sizes. The gray bar indicates the region where samples cannot be accurately dated.

Figure 3 Background measurements using different iron powders, for a range of sample sizes. The gray bar indicates the region where samples cannot be accurately dated.
The amount of catalyst (4.5 mg) is kept constant regardless of the size of the sample. This has the advantage of keeping the contamination constant and the current beam as high as possible for the small samples (Turnbull et al. Reference Turnbull and Prior2010).
Temperature and Duration of Heating
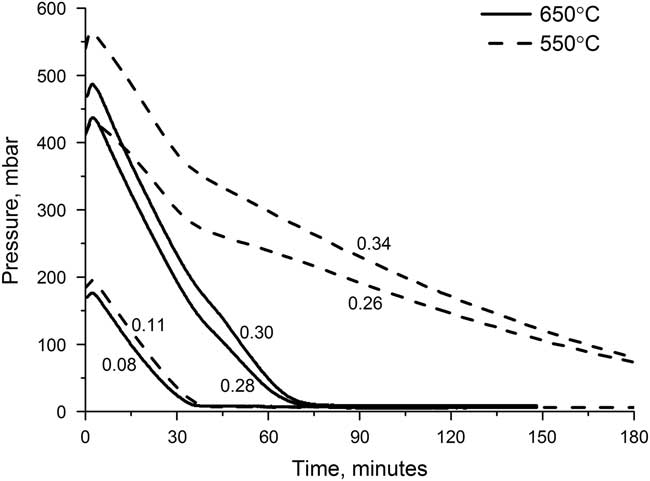
The graphitization reaction is highly sensitive to temperature, with the yield and the reaction time both being affected. The optimal temperature will allow the reaction to have a high yield in a short amount of time. The reactor pressure can be used as an indicator of the reaction completeness as the reaction involves two gases, CO2 and H2, being converted into a solid, graphite. Water vapor is also produced but is removed by the magnesium perchlorate. Figure 4 shows the reactor pressure for a series of reactors containing different initial amounts of CO2 over the course of the graphitization at both 550°C and 650°C. The pressure initially increases as the heaters are switched on, but quickly decreases as the reaction starts to occur. For samples heated at 550°C, the decrease is much slower than for those heated at 650°C, and, for the larger samples, the reaction at 550°C is still not complete after 3 hr. For samples heated at 650°C, the reaction is complete within 1.5 hr for all sample sizes.

Figure 4 Reactor pressure over the course of graphitizing at either 550°C (dashed) or 650°C (solid), for various sample sizes. Each line is labeled with the sample size (mg C).
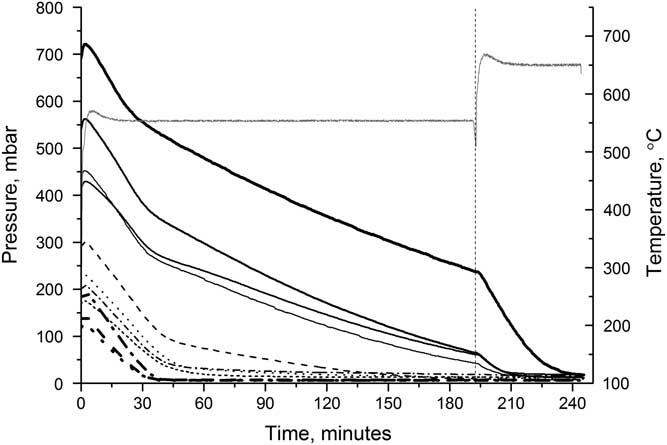
Figure 5 shows the effect of increasing the temperature during the reaction. Samples were heated at 550°C for just over 3 hr before the temperature was increased to 650°C. On increasing the temperature, the rate of reaction immediately increases and the reaction was completed after a further 40 min, for the largest sample. Graphitizing at higher temperatures can cause the graphite to sinter, and while this does start to occur in our reactors, it is insufficient (even at 650°C) to prevent samples from being pressed effectively and does not affect the AMS results.

Figure 5 Reactor pressure (black lines) over time when heated initially at 550°C, then at 650°C. Each line represents a different reactor. The reactor temperature (gray line) is also shown.
While many 14C laboratories use lower temperatures for smaller samples (e.g. Santos et al. Reference Santos, Southon, Griffin, Beaupre and Druffel2007; Delqué-Količ et al. Reference Delqué-Količ, Caffy, Comby-Zerbino, Dumoulin, Hain, Massault, Moreau, Quiles, Setti, Souprayen, Tannau, Thellier and Vincent2013), high yields and low fractionation have been achieved during these experiments for samples as small as 0.04 mg C at 650°C, thus demonstrating no need to lower the temperature in our procedure. This could be a result of very effective water removal (Turnbull et al. Reference Turnbull and Prior2010).
Water Removal
Magnesium perchlorate [Mg(ClO4)2] flakes are used to chemically remove any water, following Santos et al. (Reference Santos, Southon, Griffin, Beaupre and Druffel2007). Around 40 mg of magnesium perchlorate flakes are preloaded in the reactors prior to preconditioning. These remove water during both the preconditioning and during the graphitization reaction. The water removal appears to be highly effective, so this part of the setup remained unaltered.
H2 to CO2 Ratio
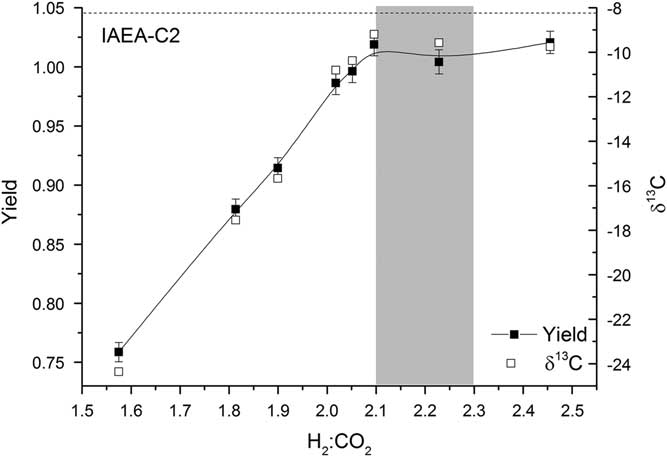
For each reactor, the pressure of hydrogen added to the line is twice the pressure of CO2 in the reactor. The CO2 is frozen down and the reactor opened to allow H2 in (this is done as rapidly as possible in order to minimize excess condensation and overpressurization of H2 in the reactors). This results in a ratio of H2:CO2 in the reactor of 2.1:1 to 2.3:1, depending on the size of the CO2 sample frozen down. For larger samples, the ratio is at the higher end and the yield is typically greater than 1, indicating that more H2 is used in the reaction than expected from the stoichiometry of the reaction. This could be attributed to the formation of a small amount of CH4 or CO (Rinyu et al. Reference Rinyu, Futó, Kiss, Molnár, Svingor, Quarta and Calcagnile2007); however, the lack of any deviation from the expected δ13C and Δ14C values for the larger samples indicates that no significant fractionation takes place (Figure 6). If additional carbon-bearing products were produced, fractionation would be expected. Alternatively, hydrogen molecules may be adsorbed onto the graphite. Lower H2:CO2 ratios were also tested, but the yield dropped off rapidly and fractionation was observed (Figure 6).

Figure 6 Yield (solid squares) and δ13C (open squares) for various H2:CO2 ratios. The shaded region represents the typical range of H2:CO2 values used. The expected δ13C value of IAEA-C2 is shown by a dashed black line.
Size Corrections
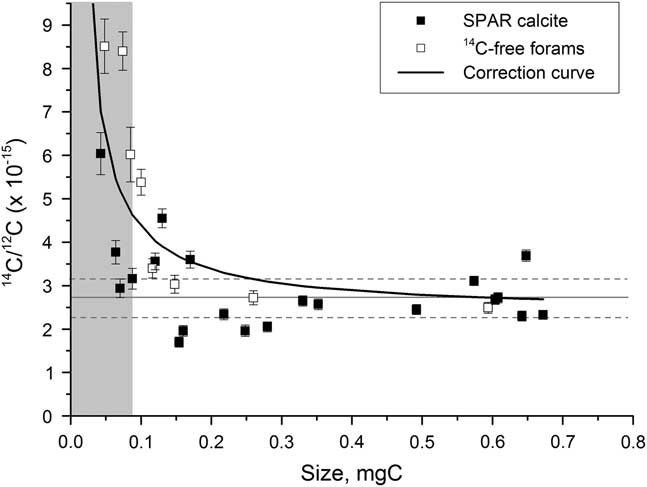
Background values for the new setup were determined using both spar calcite and 14C-dead planktonic foraminifera (from Marine Isotope Stage 6; >130 ka). The small samples of 14C-dead planktonic foraminifera were individually weighed out and processed rather than being split on the line, so that the background represents that of our sample process as closely as possible.
The constant background contamination has an inverse mass relationship that becomes significant for background samples smaller than around 0.3 mg C and particularly important for those less than 0.07 mg C. A correction is therefore applied of the form
 $y\left( {x_{i} } \right){\equals}a{1 \over {x_{i} }}{\plus}b$
, where x is the mass of the sample (Figure 7). The constant coefficient a is 0.1958e–15, determined using a least-squares minimization and b is calculated using a full-size background sample for each wheel run at the AMS facility. Typically, b is around 2.5e–15, with an error of 25%, corresponding to 0.3–1.3 μg of modern carbon contamination.
$y\left( {x_{i} } \right){\equals}a{1 \over {x_{i} }}{\plus}b$
, where x is the mass of the sample (Figure 7). The constant coefficient a is 0.1958e–15, determined using a least-squares minimization and b is calculated using a full-size background sample for each wheel run at the AMS facility. Typically, b is around 2.5e–15, with an error of 25%, corresponding to 0.3–1.3 μg of modern carbon contamination.

Figure 7 Background values for spar calcite (solid squares) and 14C-dead planktonic foraminifer samples (open squares) graphitized using Analar Normapur iron powder. The solid line represents the size-dependent background correction. The gray bar indicates the region where samples cannot be accurately dated.
Testing the New Setup
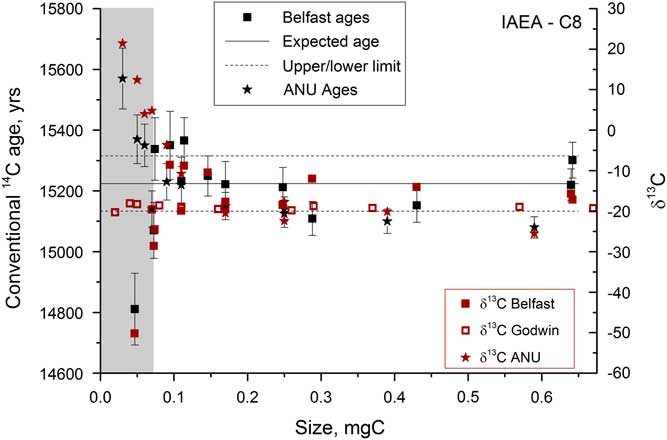
Once the graphitization process had been refined, a series of samples were run in order to assess the size range over which accurate 14C dates could be measured. A secondary standard was used, IAEA-C8, which has a known age of 15,224±91yr (15.03 pMC) and a δ13C value of –18.31‰ (Le Clercq et al. Reference Le Clercq, van der Plicht and Groning1998). Figure 8 shows the δ13C and 14C ages obtained on samples from 0.04 to 0.7 mg C. The current beams were >40 μA for the largest samples but dropped to 6–10 μA for the smallest samples. Samples <0.07 mg C could not be measured accurately on the AMS, as indicated by the large deviations in δ13C measured by AMS that are not present in the graphite δ13C values measured off-line in the Godwin laboratory. The large deviations in 14C activity and δ13C are therefore not due to fractionation during graphitization, and instead are most likely due to the ion optics that become particularly important when the beam current is low. Deviations were found to be roughly of the same magnitude, but in the opposite direction for similar-sized samples run at the Chrono Centre versus at the ANU 14C facility.

Figure 8 Radiocarbon and stable carbon measurements for a range of sizes of IAEA-C8 samples analyzed at various different locations. The gray bar indicates the region where samples cannot be accurately dated.
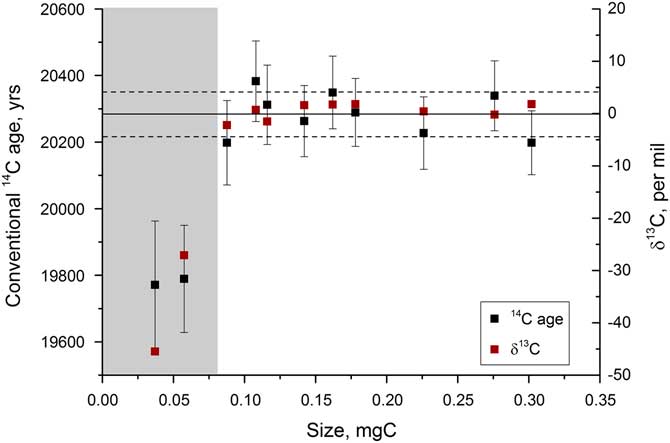
In order to assess the performance of the graphitization procedure for typical samples that would be analyzed (i.e. relatively old carbonate), tests were run on a mix of IAEA-C2 and Icelandic spar calcite, combined to give an age of around 20,300 yr. These tests indicated similar trends in 14C and δ13C, with significant deviations in the AMS occurring for samples <0.07 mg C (Figure 9). The smallest samples were up to 400 yr offset from the expected age of 15,224 yr for IAEA-C8 and 500 yr offset from the average age of 20,295 yr observed for the spar-C2 mix. For this reason, samples smaller than 0.08 mg C are not run at present. Having said this, the fractionation trends do initially look to be consistent at the different AMS facilities. If this is the case, by size matching samples of similar age, for example coexisting benthic and planktonic foraminifera, the age difference between the two samples could be determined accurately so long as they are measured at the same facility. This remains to be tested, however.

Figure 9 Radiocarbon and stable carbon measurements for a range of sizes of an approximately 20,300-yr-old sample, measured at the Chrono Centre, Belfast. The gray bar indicates the region where samples cannot be accurately dated.
CONCLUSIONS
The Godwin Radiocarbon Laboratory has been set up at the University of Cambridge allowing the graphitization of carbonate and organic carbon samples, and the preparation of standards. The experimental procedure has been streamlined for small and relatively old carbonate samples (>15,000yr), and refined to maximize the yield, ensuring no fractionation occurs, while minimizing the background 14C levels. The reaction time has also been reduced. Standards have been used to show that samples containing 0.08–0.7 mg of carbon, with fraction modern (Fm) >0.08, can be graphitized successfully. Samples smaller than 0.08 mg C can be graphitized without any fractionation occurring, but 14C measurements will not be accurate unless the AMS analysis of these samples can be optimized for such small current beams, which remains to be demonstrated.
ACKNOWLEDGMENTS
We would like to thank James Rolfe for running the stable isotope measurements, as well as the Royal Society, NERC grant NE/L006421/1 and the Isaac Newton Trust for research support.