


INTRODUCTION
EnvironMICADAS, the first accelerator mass spectrometer (AMS) in Hungary, was installed in the summer of 2011 (Molnár et al. Reference Molnár, Rinyu, Veres, Seiler, Wacker and Synal2013a). EnvironMICADAS was developed and built by ETH Zürich (ETHZ), as an improved version of the first MICADAS (Mini Carbon Dating System) of ETHZ, and was designed specifically for environmental studies (Molnár et al. Reference Molnár, Rinyu, Veres, Seiler, Wacker and Synal2013a). Details of the MICADAS AMS-concept and GIS measurements can be found in Fahrni et al. (Reference Fahrni, Wacker, Synal and Szidat2013), Synal et al. (Reference Synal, Stocker and Suter2007), and Wacker et al. (Reference Wacker, Bonani, Friedrich, Hajdas, Kromer, Němec, Ruff, Suter, Synal and Vockenhuber2010a).
Our first measurements directly from gaseous CO2 started in 2013, but routine CO2 gas sample measurements by gas ion source (GIS) have been performed since 2015. Since then, more than 500 archeological and environmental gas samples have been measured with the instrument. Thanks to the gas interface system (GIS), EnvironMICADAS is able to analyze samples with mass smaller than 100 μg carbon content, such as aerosols, collagen, carbonate, and water samples, avoiding the graphitization step in CO2 form.
The aim of this study is to report our data and results of GIS measurements performed by EnvironMICADAS over the past 4 years. It is important to point out that the GIS used in the Hertelendi Laboratory of Environmental Studies (HEKAL) is one of the first gas handling systems for the MICADAS AMS developed in ETHZ. The first samples were introduced from gas tanks and sealed glass ampoules. Results of graphite and micro-graphite measurements can be found elsewhere (e.g. Molnár et al. Reference Molnár, Rinyu, Veres, Seiler, Wacker and Synal2013a; Rinyu et al. Reference Rinyu, Orsovszki, Futó, Veres and Molnár2015).
EXPERIMENTAL
Instrumentation, Measurements, and Data Processing
The measurements, sample preparation, and combustion were carried out in the HEKAL laboratory in Debrecen, Hungary. The description of EnvironMicadas AMS is detailed in a previous status report, Molnár et al. (Reference Molnár, Janovics, Major, Orsovszki, Gönczi, Veres and Jull2013b). The gas interface system allows us to measure the 14C/12C and 13C/12C ratio of samples even below < 10 μg carbon content. Both the MICADAS and its GIS system are described in detail in various studies and status reports (Fahrni et al. Reference Fahrni, Wacker, Synal and Szidat2013; Hoffmann et al. Reference Hoffmann, Friedrich, Kromer and Fahrni2017; Maruccio et al. Reference Maruccio, Quarta, Braione and Calcagnile2017; Tuna et al. Reference Tuna, Fagault, Bonvalot, Capano and Bard2018; Welte et al. Reference Welte, Hendriks, Wacker, Haghipour, Eglinton, Günther and Synal2018). Since the elemental analyzer (EA) is not routinely operating and the carbonate hydrolysis system (CHS) is not available at HEKAL, our study focuses on the results of tank and sealed gas ampoule samples. MICADAS Bats data reduction software was used for the evaluation of the results (Wacker et al. Reference Wacker, Christl and Synal2010b) including δ13C isotope fractionation correction.
Samples and Sample Preparation
Figure 1 shows the type and number of samples, and CO2 sample preparation methods used in this study. For the calculations, data from 88 oxalic acid 2 (OxII, NIST-SRM-4990C), 105 blank CO2, and 37 IAEA standard (C1, C2, and C7, at least 10 from each) measurements were used. Apart from simple off-line splitting from tanks (big samples), off-line hydrolysis and combustion methods were used for CO2 production at the C mass range between 10 and 100 μg C, for this study.
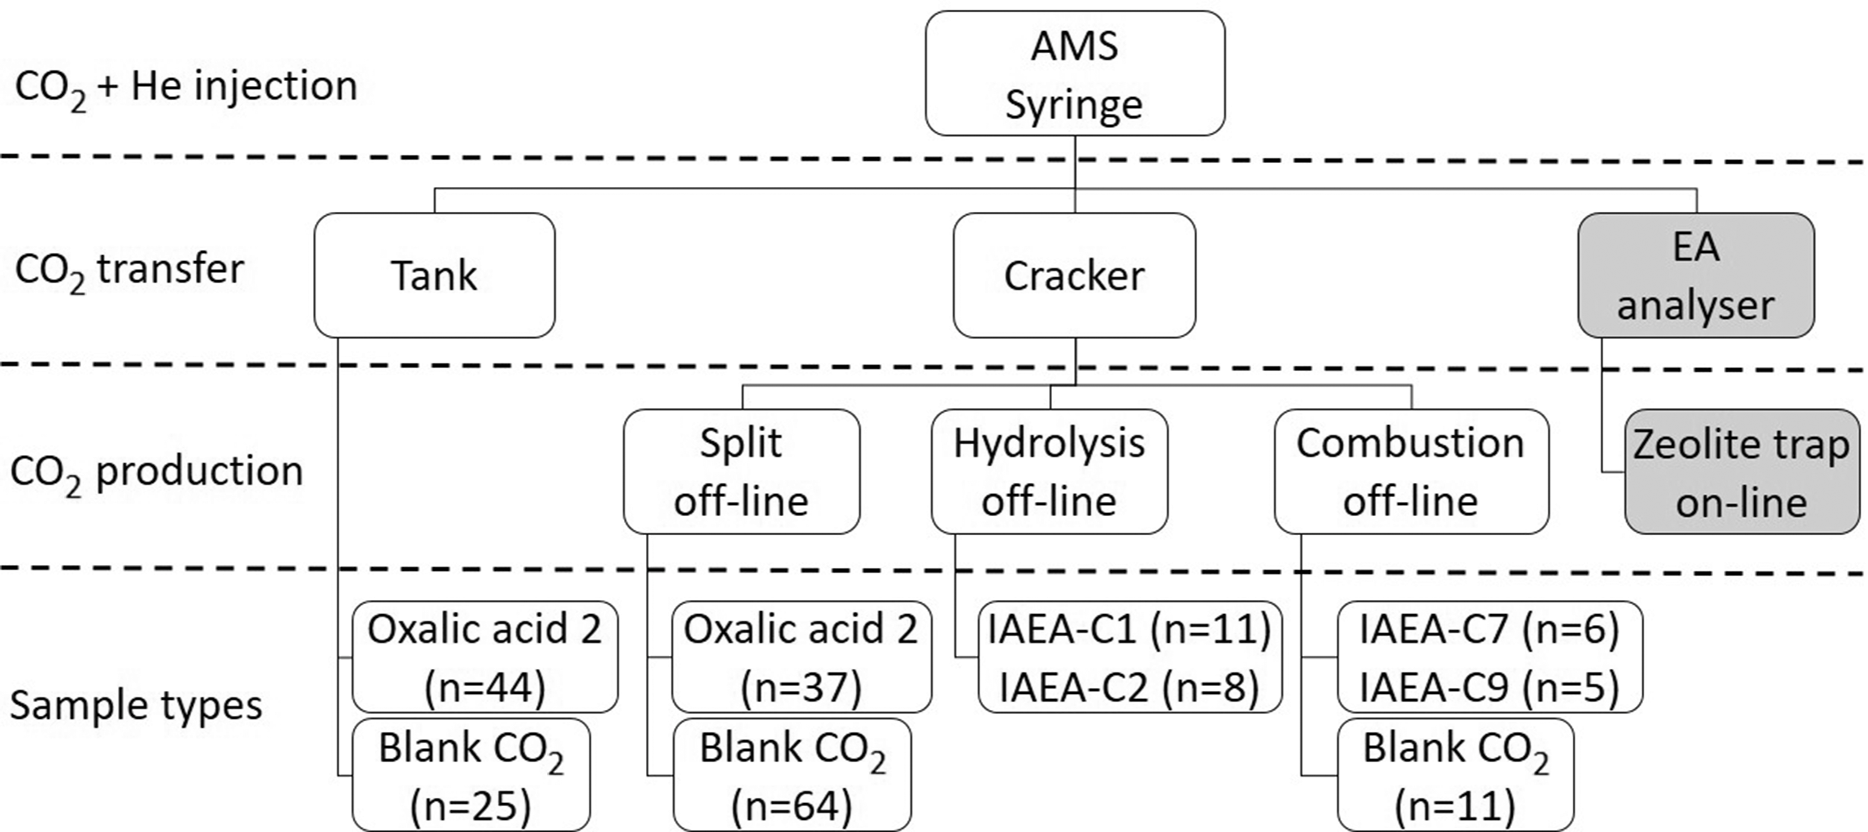
Figure 1 Flow chart and overview of sample types (with number of samples in brackets), applied off-line sample preparation methods, and modes of gas transfer into the Syringe of GIS interface for measurements discussed in this study.
Oxalic acid 2 samples were transferred in two different ways into the syringe of the AMS (Figure 1): (1) as tank samples (n=45); and (2) as cracker samples (n=43) which were split fractions (sub-samples with masses of 44, 50, 70, and 100 µg C) of a larger sample (~1 mg C).
The gas interface has a syringe, where the proper CO2 (sample) + He carrier gas mixture is produced and injected into the MICADAS ion source. In the case of our coupled GIS-MICADAS setup the ideal dilution is 5% CO2 in He carrier gas. The syringe has a variable volume, according the sample size, between 0 to 150 µg C sample capacity. Details about our GIS interface setup are published by Molnár et al. (Reference Molnár, Janovics, Major, Orsovszki, Gönczi, Veres and Jull2013b).
There are 3 possible ways to load the sample CO2 gas into the syringe, and all can be directly linked to the syringe using a multiport selector valve. Samples can be loaded from the normalization or blank tanks, where the CO2 (made in big quantity form Oxa-2 or fossil borehole CO2 gas) is already diluted to 5% by the pure He carrier gas.
For blank measurements, we used fossil CO2 gas provided by Linde Hungary Ltd. company (borehole CO2 from Répcelak, Hungary). Three types of blanks were measured (Figure 1): (1) tank blanks (n=25) were used to check background level, i.e., to control if the system is clean enough to start measuring procedural blanks, standards, and samples; (2) cracker blanks (n=69) were split fractions, i.e., sub-samples with masses of 19, 25, 44, 50, 70, and 100 µg C of a larger sample (~1 mg C); and (3) MnO2 combusted blanks (550ºC, 12 hr) (n=11) introduced also by the Cracker with C masses of 9, 20, 44, and 100 µg (Janovics et al. Reference Janovics, Futó and Molnár2018). Cracker and combusted blanks were used for correction and the latter was also used for calculation of constant contamination.
We also report the results of 14 IAEA-C1 (marble, F14C = 0.0000 ± 0.0002; Rozanski Reference Rozanski1991), 11 IAEA-C2 (travertine, F14C = 0.4114 ± 0.0003; Rozanski Reference Rozanski1991), and 12 IAEA-C7 (oxalic acid, F14C = 0.4953 ± 0.0012; Le Clercq and van der Plicht Reference Le Clercq and van der Plicht1998) standard measurements. Standards were prepared either with hydrolysis (IAEA-C1 and -C2, 1–2 mL 85% H3PO4 solution, 75ºC, 1 hr) or combustion (IAEA-C7) and were transferred into the AMS via the cracker unit (see Figure 1) (Molnár et al. Reference Molnár, Janovics, Major, Orsovszki, Gönczi, Veres and Jull2013b). Carbon masses of the standards were in the range of 9–100 µg.
Calculation of Constant Contamination
To evaluate of the degree of constant contamination, we used fossil CO2 gas prepared as combusted samples. We did these calculations as follows: first, having the measured F14C value (F14CM) and mass (mM) of blanks, and assuming that the blank samples have F14CS=0.0000, and the contaminant is only from modern source (F14CC=1.0000), we can easily calculate the mass of the contaminant (mC), by inserting Eq. (2) into Eq. (1).
 $${{\rm{F}}^{{\rm{14}}}}{{\rm{C}}_{\rm{M}}}{\rm{ = }}{{{{\rm{F}}^{{\rm{14}}}}{{\rm{C}}_{\rm{S}}}{\rm{*}}{{\rm{m}}_{\rm{S}}}{\rm{ + }}{{\rm{F}}^{{\rm{14}}}}{{\rm{C}}_{\rm{C}}}{\rm{*}}{{\rm{m}}_{\rm{C}}}} \over {{{\rm{m}}_{\rm{S}}} + {{\rm{m}}_{\rm{C}}}}}$$
and
 $${{\rm{m}}_{\rm{M}}}{\rm{ = }}{{\rm{m}}_{\rm{S}}} + {{\rm{m}}_{\rm{C}}}$$
Second, having the average mass of the contaminant, we applied a least square fit model (e.g. Hanke et al. Reference Hanke, Wacker, Haghipour, Schmidt, Eglinton and McIntyre2017; Welte et al. Reference Welte, Hendriks, Wacker, Haghipour, Eglinton, Günther and Synal2018) to control the previous calculation.
The calculation of constant contamination for IAEA-C7 was somewhat different. For this, first we subtracted the nominal value from the blank corrected value, and then we did the same procedure as mentioned above for combusted blank samples.
RESULTS AND DISCUSSION
EnvironMICADAS GIS Basic Parameters
Comparing our system with ETH (first)MICADAS, BERN MICADAS, AixMICADAS, and MAMS, it can be stated that our performance is comparable with the above-mentioned systems (see Table 1 and references below). The efficiency of the transmission is a lower due to the N2 stripper gas, but this can be improved using He as stripper gas in the accelerator (upgrade for He stripper system at Debrecen MICADAS is planned in the second half of 2019). Our maximum 12C– (μA) ion current at the low energy side (10–15 μA) is also comparable to the published data from other MICADAS systems even with our lower Cs reservoir temperature (140–150ºC). It is important to note that this temperature depends on the point of the temperature measurement and the geometry of the Cs reservoir, which can be unique in each MICADAS instrument. One of the most important parameters in the AMS gas ion source measurements is a proper background value. Our results show quite good background data with good agreement with the other laboratories’ performance. The average background is 0.0050 ± 0.0018 F14C, which is a little higher than the AixMICADAS performance (0.0028 ± 0.0018 F14C), but lower than the all the other published data shown in Table 1. Our lowest measured sample amount was 9 μgC, a bit higher than samples reported by other MICADAS laboratories (2–5 μgC). Sample size is one of the more important factors in the value of the background (Fahrni et al. Reference Fahrni, Wacker, Synal and Szidat2013; Szidat et al. Reference Szidat, Salazar, Vogel, Battaglia, Wacker, Synal and Türler2014; Hoffmann et al. Reference Hoffmann, Friedrich, Kromer and Fahrni2017; Gottschalk et al. Reference Gottschalk, Szidat, Michel, Mazaud, Salazar, Battaglia, Lippold and Jaccard2018, and Salazar 2019 [personal communication]; Tuna et al. Reference Tuna, Fagault, Bonvalot, Capano and Bard2018).
Table 1 Summary of typical gas ion source measurement parameters and settings of EnvironMICADAS and comparison with MICADAS systems at other laboratories.

1Fahrni et al. Reference Fahrni, Wacker, Synal and Szidat2013; 2Szidat et al. Reference Szidat, Salazar, Vogel, Battaglia, Wacker, Synal and Türler2014; Gottschalk et al. Reference Gottschalk, Szidat, Michel, Mazaud, Salazar, Battaglia, Lippold and Jaccard2018, and Salazar 2019 (personal communication); 3Tuna et al. Reference Tuna, Fagault, Bonvalot, Capano and Bard2018; 4Hoffmann et al. Reference Hoffmann, Friedrich, Kromer and Fahrni2017.
OxII (NIST-SRM-4990C) Results
The 88 individual OxII tank and sealed glass ampoule samples were measured with a minimum ±1.5% relative statistical error and average of 26,000 14C counts with a 15-min measurement time. The sealed glass ampoule samples were prepared in different sample sizes (44–100 μgC) in a vacuum line with a known volume to determine the amount of CO2 and hence the mass of C in the sample. This system is only used for background and OxII sample handlings from tanks, not for unknown samples, to avoid cross contamination. Both tank and sealed glass ampoule samples were used for normalization of the AMS-GIS measurements. Results of OxII standard measurements are shown in Figure 2 and listed in Table 2. From the 88 OxII measurements, we obtained an average F14C and δ13C of 1.3415 ± 0.0101 and –17.79 ± 5.34‰, respectively. For other samples, data were normalized to the consensus values (i.e., F14C =1.3407 ± 0.0005 and δ13C = –17.78 ± 0.08‰; Stuiver Reference Stuiver1983), they are in agreement with those, and were used for normalization. The relatively high δ13C scatter is possibly due to fractionation in the ion source. This process has been discussed in other publications as well (Hoffmann et al. Reference Hoffmann, Friedrich, Kromer and Fahrni2017), but it does not affect the final 14C results, because of the simultaneous 14C/12C, 13C/12C measurement and 13C correction (Stuiver and Polach Reference Stuiver and Polach1977; Mann Reference Mann1983). Table 2 shows an overview of our results for IAEA standards and blank samples. These data of the IAEA-C1, -C2, -C7 and blank samples will be discussed in more detail in later sections. Listed data are average values (except for sample masses).

Figure 2 F14C and δ13C results of OxII tank (n=45) and OxII cracker (n=43) measurements. Open symbols are tank samples, and solid symbols are cracker samples. Solid black lines show the average values, and dashed black lines mark the associated 1σ standard deviations. Dashed red lines represent the nominal values (F14C =1.3407 ± 0.0005 and δ13C = –17.78 ± 0.08‰; Stuiver Reference Stuiver1983). (Please see electronic version for color figures.)
Table 2 F14C results of OxII, IAEA standards, and blank CO2 samples, and comparison with nominal values.

Listed data are average values (except for sample masses). Given uncertainties are 1σ. 1Blank corrected. 2Memory effect corrected. 3Constant contamination corrected. Reference values of IAEA-C1 and -C2 from Rozanski (Reference Rozanski1991), IAEA-C7 from Le Clercq et al. (1998), and OxII from Stuiver (Reference Stuiver1983).
Blank CO2 Results
Tank and Cracker Blanks
To calculate the degree of memory effect (or level of cross contamination), we used the average F14C of 21 blank CO2 samples measured first, second, and third in order after OxII samples (Figure 3). The obtained memory effect is 0.34 ± 0.05% for the first blank, and 0.10 ± 0.06% for the second blank measured after a modern sample. The average F14C after correction for memory effect is 0.0058 ± 0.0022 and 0.0050 ± 0.0018 for fossil tank and cracker samples, respectively (Figures 4 and 5, Table 2). These results in conventional 14C age are in the range of 34,000–47,000 yr BP, typical for the achieved background with graphite samples in the HEKAL (Molnár et al. Reference Molnár, Janovics, Major, Orsovszki, Gönczi, Veres and Jull2013b).

Figure 3 Diagram showing the memory effect after measuring three successive blank samples (blank CO2) after a modern sample (OxII). The dark grey bar shows average F14C of 21 OxII samples, and light grey bars show average F14C of 21 blank CO2 samples (6 tank and 15 cracker blanks). Note the 2-magnitude order difference between the two x-axes (i.e., OxII and blank samples). Error bars show 1σ standard deviation.

Figure 4 F14C results of blank CO2 tank samples (n=25). Open symbols are measured values, and solid symbols are values after memory effect correction. Solid black line shows the average F14C (0.0058 ± 0.0022), and dashed black lines mark the associated 1σ standard deviation.

Figure 5 F14C results of blank CO2 cracker samples (n=69). Open symbols are measured values, and solid symbols are values after memory effect correction. Solid black line shows the average F14C (0.0050 ± 0.0018), and dashed black lines mark the associated 1σ standard deviation.
The blank value can be corrected by the memory effect (Figure 4), but without this correction, our results are still comparable with other GIS performance as mentioned in Table 1 (Szidat et al. Reference Szidat, Salazar, Vogel, Battaglia, Wacker, Synal and Türler2014; Hoffmann et al. Reference Hoffmann, Friedrich, Kromer and Fahrni2017; Gottschalk et al. Reference Gottschalk, Szidat, Michel, Mazaud, Salazar, Battaglia, Lippold and Jaccard2018; Tuna et al. Reference Tuna, Fagault, Bonvalot, Capano and Bard2018). The blank tank samples have slightly higher F14C values, probably because the tank samples are generally measured at the beginning of the GIS measurement campaign, or alternatively due to a small leakage at the tank or fitting problems around the connections or accumulated cross-contamination effects in the capillary and gas handling system. These small differences cannot greatly affect the final F14C results, but have to be taken into account (Hoffmann et al. Reference Hoffmann, Friedrich, Kromer and Fahrni2017).
Figure 5 shows the F14C values as a function of sample mass. The most commonly measured glass ampoule samples used the cracker in the GIS are the 50 and 100 µgC samples, because the mean size of the measured unknown samples in HEKAL is between these values. The difference between the different sample masses is small but variable. The best achievable blank strongly depends on the condition of the Cs sputtering ion source. It is recognizable that GIS measurements increase the stress on the ion source because they apply more ionized Cs to the ion source box, which can contaminate the system and worsen the background signal in the long run.
Combusted Blanks
For fossil CO2 blanks prepared by combustion, we calculated a constant contamination of 0.57 ± 0.09 µg C. The validity of this value was also confirmed by the least square fit method (reduced chi square = 0.91). This value is comparable with a coupled GIS+EA system as mentioned in Tuna et al. (Reference Tuna, Fagault, Bonvalot, Capano and Bard2018). In that paper, the coupled AGE+CHS system was reported to have 1.74 ± 0.42 µgC constant contamination. Thanks to the low volume of our system, we can keep the constant contamination as a lower level. The resulting average corrected F14C is 0.0000 ± 0.0029 (Figure 6 and Table 2).

Figure 6 F14C results and constant contamination model of combusted blank samples (n=11). Open symbols mark the measured values, and solid symbols represent the constant contamination corrected values (F14C=0.0000 ± 0.0029). The solid black line shows the best fit and dashed black lines mark the associated 1σ standard deviation. The red line shows the reference value (F14C=0.0000). Error bars mark 1σ uncertainty.
IAEA Standards
IAEA standards (C1, C2, and C7) were used as internal standards and treated as unknowns in our measurements, therefore they were not used for normalization. IAEA-C1 and -C2 standards were prepared by off-line hydrolysis, and since the average F14C results of 0.0029 ± 0.0020 and 0.4105 ± 0.0049, respectively (Table 2), are in good agreement with the nominal values (Figures 7 and 8; 0.0000 ± 0.0002 and 0.4114 ± 0.0003; Rozanski Reference Rozanski1991), we assume that this type of sample preparation does not introduce any significant contamination.

Figure 7 F14C results of IAEA-C1 samples (n=14). Open symbols represent blank corrected values, and solid symbols show blank and memory-effect corrected values. Solid black line shows the average F14C (0.0029 ± 0.0020) and dashed black lines mark the associated 1σ standard deviation. The red line represents the reference value (F14C=0.0000 ± 0.0002; Rozanski Reference Rozanski1991). Error bars mark 1σ uncertainty.

Figure 8 F14C results of IAEA-C2 samples (n=11). Open symbols mark blank corrected values. Solid black line shows average F14C (0.4105 ± 0.0049) and dashed black lines mark the associated 1σ standard deviation. Dashed red line represents the reference value (F14C=0.4114 ± 0.0003; Rozanski Reference Rozanski1991). Error bars mark 1σ uncertainty.
Figure 7 shows that the disagreement between the nominal and measured, corrected values appear to be independent of the mass of the sample, at least between 20 and 70 µg. As the IAEA-C1 is a blank standard for AMS measurements, the 0.0029 ± 0.0020 F14C value indicates quite good agreement and implies that the off-line hydrolysis does not add high levels contamination to the prepared samples. The agreement in the case of the IAEA-C2 samples is quite convincing (Figure 8).
IAEA-C7 standards were prepared by combustion, and it was necessary to correct the F14C values for constant contamination (Figure 9), as was previously discussed for combusted blank samples (see above). IAEA-C7 standards appeared to have a contamination of 0.29 ± 0.28 µg C (reduced chi square = 0.38), which is less than for combusted blanks (0.57 ± 0.09 µg), but they are in agreement within 1σ uncertainty. After correction for constant contamination (and memory effect), an average F14C of 0.4957 ± 0.0116 agreed well with the nominal value of 0.4953 ± 0.0012 (Le Clercq and van der Plicht Reference Le Clercq and van der Plicht1998).

Figure 9 F14C results of IAEA-C7 samples (n=12). Open symbols show data which were corrected for blank, memory effect and constant contamination, while solid symbols mark values which were corrected only for blank and constant contamination. Solid black line shows average F14C (0.4957 ± 0.0116) and dashed black lines mark the associated 1σ standard deviation. The red line marks the reference value (F14C=0.4953 ± 0.0012; Le Clerq and van der Plicht Reference Le Clercq and van der Plicht1998). Error bars mark 1σ uncertainty.
CONCLUSION
The Gas Interface System (GIS) at the Hertelendi Laboratory of Environmental Studies (HEKAL), Hungarian Academy of Sciences, Debrecen has been operating successfully since 2013. The system is one of the first GIS equipment that has successfully been applied for 14C measurements from CO2, originally developed by the ETHZ. After more than 500 gas target measurements, we can conclude that our system has high stability and reproducibility. This conclusion can be confirmed by the comparison of other laboratories’ performance. Both the blank, OxII and IAEA standard measurements demonstrate the reliability of the gas target measurements at the HEKAL. This reliability is achievable even below 20 μgC. The investigation of memory effects shows a low but visible cross-contamination based on measurements of OxII and a series of 3 consecutive blank sample measurements. The level of the cross contamination is 0.34 ± 0.05% for the first blank, and 0.10 ± 0.06% for the second blank measured after the OxII standard. For samples greater than or equal to 10 μgC relative errors of 6% could be achieved. Relative error is defined as absolute error (1 sigma) of fM result divided by the actual fM value. It is about +/– 6% (six percent) in the case of very small (10–20 ug C sized CO2 samples). The 12C ion current at the low energy side is between 10–15 μA with 13 ± 7 min average measurement time and about 300 counts per microgram C for OxII. The applied CO2 in He mixing ratio was 5%. The blank is comparable with other MICADAS GIS systems, that is 0.0050 ± 0.0018 F14C or a range 34,000–47,000 radiocarbon years BP, which is feasible for dating both of archeological and environmental samples. In the future, we plan to attach the gas-ion source inlet to elemental and organic carbon measurements (EC and OC) with a coupled Sunset ECOC analyzer-GIS system and introduction of EA-GIS measurements. This will extend our capabilities to use the gas ion source for environmental studies.
ACKNOWLEDGMENTS
We would like to thank Sönke Szidat and Gary Salazar from the University of Bern for providing us information on the actual performance and measurement conditions of the MICADAS at LARA Laboratory (University of Bern). This research was supported by the European Union and the State of Hungary, co-financed by the European Regional Development Fund in project GINOP-2.3.2-15-2016- 00009 “ICER”. This work was carried out in the frame of the János Bolyai Research Scholarship (Mihály Molnár) of the Hungarian Academy of Sciences.


