


INTRODUCTION
In the modern world, fossil fuels are essential for the global economy, having recognized importance in the production of several derivative products, among which polymer materials, gasoline and diesel oil stand out. However, the steps from extraction and processing to the subsequent use, in fact, of fossil fuels—in addition to oil spill accidents—have an important impact on the environment and on natural resources, including water resource quality. The connections between water and energy have been studied recently, with increasing recognition of how closely they are connected. Water is used, in many forms and quantities, at each stage of the extraction and processing of fossil fuels (Ptacek et al. Reference Ptacek, Price, Smith, Logsdon and McCandless2004). Water resources (surface and groundwater) can be contaminated by solid and liquid waste generated in the extraction processes, such as dissolved salts, trace metals, hydrocarbons, and natural radionuclides (NORM—naturally occurring radioactive materials), creating challenges for remediation actions and for management and storage of waste. Impact on the environment and natural resources are topics of a global discussion on sustainability and protection of planet resources. Water quality is essential for life. Clean water, sanitation, and life below water are identified as important goals to achieve in the United Nations sustainable development goals, which is a universal call to action for protection of the planet and improvement of life (UN-SGD 2019).
In the concern of CO2 emissions and their environmental consequences, it has become extremely important to distinguish fossil emissions from non-fossil emissions—products of biogenic origin that assimilate CO2 from the atmosphere during their lifetimes. To distinguish these sources and determine the biogenic fraction, several methods have been developed using different approaches and technologies (Quarta et al. Reference Quarta, Calcagnile, Giffoni, Braione and D’Elia2013). The most common methods for determining the biogenic fraction are the selective dissolution method, the balance method, and the 14C method (Staber et al. Reference Staber, Flamme and Feltner2008). The analysis using the radiocarbon (14C) method is recognized as the most efficient way of identifying the biogenic fraction and, consequently, can be applied with a high degree of reliability in distinguishing contamination by fossil and non-fossil fuels (Quarta et al. Reference Quarta, Calcagnile, Giffoni, Braione and D’Elia2013). This biogenic content can be determined by analyzing the 14C by accelerator mass spectrometry (14C-AMS), according to procedures specified in the ASTM D6866 standard.
In addition to the 14C analysis, another method of assessing the contamination of water by fossil fuels consists of determining the concentration of hydrocarbons present in water. Petroleum has thousands of different compounds, forming a very complex combination, the main components of which are hydrocarbons that correspond to approximately 97% of the total composition of oil (NRC 1985). Smaller elements, such as nitrogen, sulfur and oxygen make up approximately the remaining 3% (NRC 1985) and may also contain trace minerals and metals such as nickel, vanadium, and chromium (NRC 2003). In petroleum, the main classes of hydrocarbons present are that of saturated hydrocarbons, comprising n-alkanes, branched alkanes and cycloalkanes, and that of aromatic hydrocarbons. Among these compounds, n-alkanes are the predominant ones, containing chains of carbon that normally range from 1 to 40 carbon atoms.
A well-established strategy for the remediation and monitoring of environmental pollution caused by the excessive release of nutrients and other chemicals in water bodies is based on the use of algae tanks. Currently, algae is a raw material for supplying the cosmetics, personal hygiene, food (human and animal) markets, and it is even used in biomass production—the most recent and growing sector (Brasil and Garcia Reference Brasil and Garcia2016); but algae are mainly recognized for having an important role in the purification of natural water and have been attracting the interest of several scientists for their ability to absorb contaminants quite efficiently (Han et al. Reference Han, Zhang and Yan2000; Olguin Reference Olguin2003).
The aim of the present work was to evaluate, through 14C-AMS biogenic fraction determination and n-alkane quantification techniques, the algae exposition to different levels of contamination with fossil fuels (kerosene and diesel) in an indoor controlled experiment.
MATERIALS AND METHODS
Location of Collected Specimens
Specimens of green algae or sea lettuce, Ulva fasciata (Delile 1813) were used in the experiment. The algae and local marine water were collected in September 2019 from Boa Viagem Beach (22°54'33.0"S 43°07'50.0"W), Niterói, RJ—Brazil (Figure 1a). This beach is located in the Guanabara Bay, a semi-closed coastal ecosystem (Amador Reference Amador1980) with a total area of 346 km2, in the metropolitan region of Rio de Janeiro city. The algae were collected by hand with the help of a knife from their base of adhesion to the rock (Figure 1b).

Figure 1 Algae collection site: (A) location map; (B) Ulva fasciata in situ.
Experimental Technique
The samples were transported to the laboratory and transferred directly to three different recipients of 1 L. About 500 mL of local marine water was added to each flask. Total weight of collected algae was 45 g, samples size length varying between 3.5 cm and 5.5 cm. Each recipient was filled with 15 g of algae. One recipient was the control group with algae and no contaminants. In the other two recipients, algae were exposed to an ascending series (5 mL, 10 mL, and 15 mL) of kerosene and diesel contaminants, thus resulting in concentrations (v/v) of 1%, 2%, and 3% for pollutant additions, respectively. The flasks were placed in an orbital shaker in order to simulate intertidal movement, and algae were exposed for 1 hr for each concentration value.
Sample Preparation and Determination of Radiocarbon Biogenic Fraction
Algae control and contaminated samples in different exposition doses were freeze-dried and placed inside prebaked quartz tubes containing silver powder and cupric oxide. All samples were combusted at 900ºC for 3 hr in a muffle oven. The gas was purified by means of dry ice/ethanol traps in a stainless-steel graphitization line (Macario et al. Reference Macario, Gomes, Anjos, Carvalho, Linares, Alves, Oliveira, Castro, Chanca, Silveira and Pessenda2013). For graphitization we used the zinc/titanium hydride method with iron catalyst (Xu et al. Reference Xu, Trumbore, Zheng, Southon, McDuffee, Luttgen and Liu2007). Individual torch sealed tubes were heated for 7 hr in a muffle oven at 550ºC. Graphitized samples were pressed in individual cathodes and placed in the cathodes wheel of the SNICS ion source and measured in the 250 kV Single Stage Accelerator Mass System (SSAMS) of the Physics Institute. The isotopic fractionation was corrected by measuring the 13C on-line in the accelerator. Background was measured using processed graphite samples, which yielded average 14C/13C ratios of 6 × 10⁻¹³. Average machine background was 10−13 for unprocessed graphite. Accuracy was checked by measuring reference materials within the 2-σ range of consensus values. Some replicate graphitized samples were measured at the CAIS Radiocarbon AMS facility. Results of percent Modern Carbon were determined based upon “method B” of ASTM-D6866—14C activity of modern biogenic sources being defined as 105 pMC.
Sample Preparation and N-Alkanes Determination
N-alkane analysis was performed according to Wakeham and Canuel (Reference Wakeham and Canuel1988) with modifications. Dried algae samples were subjected to total extraction through ultrasonic bath treatments for 15 min at 35°C in the following order: dichloromethane 100%; dichloromethane:methanol 1:1 and then methanol 100%. After each solvent, samples were centrifuged and the supernatant collected. All supernatant was placed in a rotary evaporator to reduce the volume, then transferred to a vial with heptane, dried under nitrogen gas and identified. Afterwards, extracts were fractionated on a silica column to obtain the fraction relative to n-alkanes. The total lipid extract was resuspended with 1 mL of heptane and transferred to the top of a chromatographic column made with silica gel-filled Pasteur pipette (calcined, activated at 120°C/24 hr and deactivated with 5% distilled water) in heptane. 2.0 mL of heptane was added to obtain the fraction relative to n-alkanes. It was collected, dried in nitrogen and frozen. Samples were injected into gas chromatography equipment, GC6890N by HP Agilent Technologies, equipped with a 30-m-long HP-5 capillary column with 320 µm of internal diameter, 0.25 μm of film thickness. The injector temperature was 300°C, pressure of 4.9 psi, 1:10 split injection and detector temperature programmed to 320°C. A run of 65 min was carried out with the furnace initial temperature of 50ºC and final temperature of 320ºC with ramp of 6ºC min−1 with hydrogen as carrier gas and average velocity of 38.3 cm s−1. Calibration curves were made from 50 µg/L of 5-α cholestane standard in solutions concentrations of 0.02, 0.04, 0.06, 0.08, 0.1, and 0.2 mg/mL. Prior to extractions n-alkane recovery standards (tetracosane) were added. Response factor for n-alkanes presented a mean of 90.9% and was not considered in calculations. The detection limit was 0.011 ng/mL and the quantification limit was 0.036 ng/mL.
RESULTS AND DISCUSSION
As can be seen in Table 1 the algae control group biogenic fraction was approximately 100%, indicating mainly modern carbon in their composition as expected. Algae exposed to 5 mL, 10 mL, and 15 mL of kerosene have shown biogenic fractions of 96.7%, 95.6%, and 53.6%, respectively, indicating accumulated fossil contamination. Meanwhile, algae contaminated with 5 mL, 10 mL, and 15 mL of diesel have shown more representative signal of fossil contamination in biogenic fraction 99.1%, 67.6%, and 35.2%, respectively. Samples of the contaminants were also prepared for radiocarbon analysis. Unfortunately, diesel replicates were not measured because there was not enough gas to be converted to graphite.
Table 1 pMC values (percent of Modern Carbon) with margin of error and biogenic fraction for algae samples where C1, C2, and C3 are uncontaminated algae samples.

Nevertheless, the collected site does not have studies of actual pMC. For this reason, three control samples were measured and we considered the actual value for pMC 105.
Depending on the quality of the graphite produced during the graphitization process of samples, if it is agglomerated or with high hardness, the beam extraction efficiency can be compromised impacting uncertainties, as one can observe for algae exposed to 10 mL of diesel. However, contamination was easily evaluated with radiocarbon technique and n-alkanes method helped to obtain results of bioaccumulation according to the dose of contaminants as follows.
The analysis of the concentrations of n-alkanes in ng.g−1 is shown in Figures 2–5. Algae control samples (Figure 2) presented a predominance of n-C19, as expected for micro and macro algae. The algae control group was not submitted to a depuration time after the collection and n-alkanes bi-modal results showed a signal of previous in situ fossil contamination.

Figure 2 Algae control (n=3) n-alkanes distribution.

Figure 3 Diesel, kerosene, and algae n-alkanes signatures and their relative abundance (%).

Figure 4 n-alkanes concentration (ng/g) in the algae material with kerosene (A) and diesel (B) contamination.

Figure 5 n-Alkane concentrations (ng/g) measured in the algae control and algae after contamination experiment (bars) and relative abundance (%) (diamonds).
In Figure 3 it is possible to observe the relative abundance of n-alkane compounds in the algae control and in the oils samples shows the usual signature of petroleum products, where there is no preference for even or odd n-alkanes and also the bi-modal distribution for algae control samples. Since it was not possible to obtain n-alkanes through liquid extraction for the used kerosene the signature data shown in Figure 3 for this contaminant was obtained from Mcllroy et al. (Reference McIlroy, Smith and McGuffin2018).
In Figure 4 it is possible to observe the results for algae with kerosene (A) and diesel (B) in ascending series 5 mL, 10 mL, and 15 mL of contaminant.
Comparing the results in Figure 4, it is possible to observe that the higher doses of contaminants derived from oil, the greater the concentration of hydrocarbons present in algae. The highest concentration is 150.3 ng.g−1 for n-C27 in the algae exposed to 15 mL of kerosene. Even if the n-alkanes results for kerosene have shown a typical pattern of fossil hydrocarbons (Peters and Moldowan Reference Peters and Moldowan1993) the n-C27 predominance indicates a mixture of oils with different geochemical aspects that does not obey the distribution shown in Figure 3. The kerosene used in the experiment was commercial, hydrated and probably a mixture of oils from a petrogenic source (Celino et al. Reference Celino, Veiga, Triguis and Queiroz2008). An enhancement of hydrocarbons n-C16 to n-C27 as the dose of diesel also increases. The maximum concentration is 6139.5 ng.g−1 for n-C18 in algae contaminated with 15 mL of diesel.
Since the n-alkanes concentration results had different ranges for algae control, kerosene and diesel contamination, it is possible to observe in Figure 5 the relative abundance (%) in each case and also the total alkane concentration (ng.g−1).
A better way to confirm petrogenic contamination in algae using n-alkanes is the relationship between the concentrations of compounds with odd/even numbers of carbon using the Carbon Preference Index (CPI) (Allan and Douglas Reference Allan and Douglas1977). Table 2 shows the CPI and the total n-alkanes concentration (sum) for each sample.
Table 2 Total concentration alkanes (µg.g−1) and CPI for each algae sample and diesel.

* CPI = Σ (C23-C31)odd + Σ (C25-C33)odd/2 Σ (C24-C32)even.
A CPI value near 1 usually indicates anthropic contamination by fossil fuels in all samples, which in this case includes algae control samples (Pendoley Reference Pendoley1992). As one can see in Figure 2 there is a peak in n-C28 that was not expected in natural environments, indicating traces of anthropic contamination in the collection site. As mentioned before the collection site is located in the Guanabara Bay in the metropolitan region of Rio de Janeiro city, an environment subject to anthropic influences including ships circulation and oil platform maintenance for this reason some oil contamination traces could be present. Figure 6 shows graphically the n-alkanes total concentration and CPI.
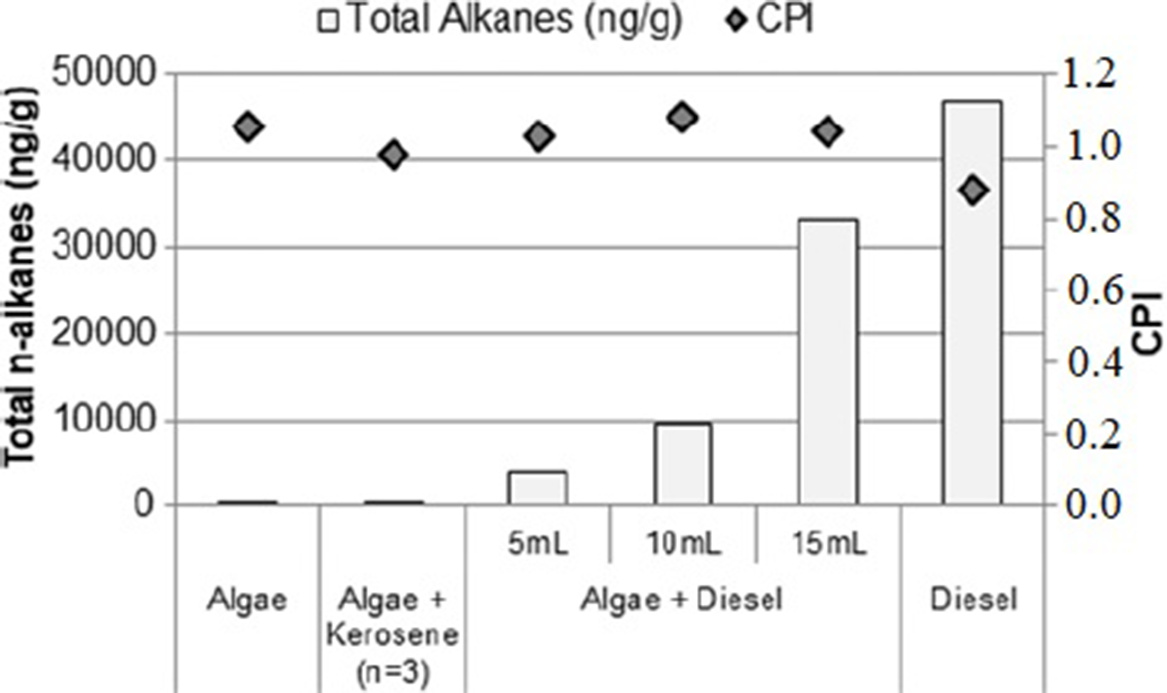
Figure 6 Σ n-alkanes (bars) and carbon preference index—CPI (diamonds).
In terms of comparison, studies have already reported the total concentration of n-alkanes (in ng.g−1) in some locations in Brazil and in the world, such as Sepetiba Bay/RJ with values between 0.27 and 2.67 (Carreira et al. Reference Carreira, Ribeiro, Silva and Farias2009), Guanabara Bay/RJ with 0.91 to 6.51 (Hamacher Reference Hamacher1996), Santos/SP with 1.08 to 4.29 (Nishigima et al. Reference Nishigima, Weber and Bícego2001) and Black Sea with 0.1 to 3.4 (Readman et al. Reference Readman, Fillmann, Tolosa, Bartocci, Villeneuve, Cattini and Mee2002).
CONCLUSIONS
In the present work, a methodology was developed to assess the contamination of water bodies by fossil fuels derived from petroleum, such as diesel and kerosene, using algae to uptake these compounds and analyzing them by the 14C-AMS method and, as a complement, by n-alkanes determination method. The biogenic fraction results showed that the method was able to identify fossil fuel presence in different contaminant doses using a simple and fast pre-established protocol. Algae control samples have shown a bi-modal pattern for n-alkane analysis and biogenic fraction around 100% indicating the presence of trace fossil contaminants at the collection site. Both techniques confirmed the incorporation of kerosene and diesel and its accumulation following the increasing doses of the contaminants as expected.
Comparing the results obtained for the same dose of kerosene and diesel, one can observe that the biogenic fractions are substantially different, and the difference is probably due to the fact that the kerosene oil used as contaminant shown a small amount of water, as observed during n-alkanes sample preparation and the hydrocarbon distribution indicates that it was not a pure sample and could be a mixture of oils from petrogenic sources. The analysis using gas chromatography to quantify n-alkanes proved to be a great method in addition to the 14C-AMS analysis. These two methods combined, therefore, proved to be efficient to achieve the proposed objectives, implementing an effective technique for identifying the presence of fossil material in aquatic ecosystems, which allows decision-making about bioremediation, especially in the case of acute accidents of contamination.
ACKNOWLEDGMENTS
The authors would like to thank Brazilian financial agencies CNPq (Grant 426338/2018-9 to Carla Carvalho; Grant 307771/2017-2 to Kita Macario), FAPERJ (Grant E-26/202.714/2018 to Carla Carvalho; Grant E-26/110.138/2014 and E26/203.019/2016 to Kita Macario), Projeto CLIMATE-PRINT-UFF (Grant 88887.310301/2018-00), and INCT-FNA (464898/2014-5) for their support.


