


INTRODUCTION
The 14C/12C ratio in the atmospheric CO2 is affected by both natural and anthropogenic sources and sinks. The dilution of atmospheric radiocarbon (14C) may occur by natural fossil emissions such as volcanic gases, but mainly induced by burning of fossil fuels, and this can be estimated using the formula devised by Suess (Suess Reference Suess1955; Rakowski Reference Rakowski2011; Capano et al. Reference Capano, Marzaioli, Sirignano, Altieri, Lubritto, D’Onofrio and Terrasi2010; Major et al. Reference Major, Haszpra, Rinyu, Futó, Bihari, Hammer and Molnár2018). Major anthropogenic fossil CO2 sources are traditional fossil-fueled power plants, industrial facilities, cement production and road traffic. Conversely, beyond the natural generation by cosmic rays, the enrichment of atmospheric 14C can be due to contemporary nuclear facilities and nuclear bomb testing, which resulted in the atmospheric 14C bomb-peak in 1963 (Nydal and Lövseth Reference Nydal and Lövseth1983). During this period, the natural 14C level doubled, and increased from 100 percent modern carbon (pMC) to approximately 200 pMC (Buzinny Reference Buzinny2006; Graven et al. Reference Graven2015). The 14C level has now declined and is close to the pre-bomb level (Levin et al. Reference Levin, Kromer and Hammer2013).
There are many possible methods which are available for the monitoring and estimation of the carbon isotopic ratio of the atmospheric CO2 (Kuc Reference Kuc1986; Veres et al. Reference Veres, Hertelendi, Uchrin, Csaba, Barnabás, Ormai, Volent and Futó1995; Pawelczyk and Pazdur Reference Pawelczyk and Pazdur2004; Molnár et al. Reference Molnár, Bujtás, Svingor, Futó and Svetlík2007). The most sophisticated way of long-term monitoring is instrumental sampling, where a representative sample can be collected for a specific period of time, using calibrated electronic devices and high purity chemicals. On the other hand, plants can also collect the CO2 from the air by photosynthesis. Thanks to this biochemical process, we can conduct cost-effective observations over a wide area during the growing season of plants (Levin et al. Reference Levin, Kromer, Schoch-Fischer, Bruns, Münnich, Berdau, Vogel and Münnich1985; Alessio et al. Reference Alessio, Anselmi, Conforto, Improta, Manes and Manfra2002; Quarta et al. Reference Quarta, Rizzo, D’elia and Calcagnile2007; Janovics et al. Reference Janovics, Kern, Güttler, Wacker, Barnabás and Molnár2013; Xi et al. Reference Xi, Ding, Fu, Zhou and Liu2013; Zhou et al Reference Zhou, Wu, Huo, Xiong, Cheng, Lu and Niu2014). CO2 fixation by photosynthesis provides a way to estimate the proportion of CO2 from magmatic activity (Shore and Cook Reference Shore and Cook1995; Cook et al. Reference Cook, Hainswort, Sorey, Evans and Southon2001), natural and urban CO2 emissions (Baydoun et al. Reference Baydoun, Samad, Nsouli and Younes2015), as well as traffic-derived fossil CO2 emissions (Druffel and Griffin Reference Druffel and Griffin1995; Levin and Hesshaimer Reference Levin and Hesshaimer2000; Varga et al. Reference Varga, Major, Janovics, Kurucz, Veres, Jull, Péter and Molnár2018). Deciduous plants are primarily used for the biomonitoring of 14C, because the vegetation period of these plants is better defined than the growing season of evergreen species, where the CO2 collection and storage cannot easily be determined. Using 14C measurements, numerous studies have investigated the fossil carbon load of rural and urban areas to determine the local Suess effect at local to regional scales. These studies generally used deciduous plant leaves, specifically Ginkgo biloba L., Zea mays L., Agropyron repens (L.) Gould, Ficus sp., Setaria viridis (L.) P. Beauv. samples and past studies have shown a low but detectable 14C dilution close to densely populated areas (Hsueh et al. Reference Hsueh, Krakauer, Randerson, Xu, Trumbore and Southon2007; Riley et al. Reference Riley, Hsueh, Randerson, Fischer, Hatch, Pataki, Wang and Goulden2008; Zhou et al. Reference Zhou, Wu, Huo, Xiong, Cheng, Lu and Niu2014; Park et al. Reference Park, Hong, Xu, Park, Sung, Sung, Lee, Nakanishi and Park2015; Ndeye et al. Reference Ndeye, Sène, Diop and Saliège2017).
The aim of our study was to determine the Suess effect on the scale of a medium-sized European city (Debrecen, Hungary) and determine the rate of fossil fuel-derived carbon in the vegetation collected in urban areas of different characteristics, such as the downtown, suburbs and a local forested background area. This study mainly focuses on roadsides and crossroads to estimate the traffic-derived carbon component in the vegetation. Plant samples were investigated in many aspects in Debrecen already (Simon et al. Reference Simon, Baranyai, Braun, Cserháti, Fábián and Tóthmérész2014; Molnár et al. Reference Molnár, Tóthmérész, Szabó and Simon2018), but not for 14C, although the atmospheric CO2 is continouously monitored at one sampling point in Debrecen since 2008 (Molnár et al. Reference Molnár, Haszpra, Svingor, Major and Svetlík2010a, Molnár et al. Reference Molnár, Major, Haszpra, Svetlik, Svingor and Veres2010b).
METHODS
Sampling Sites and Plant Samples
Debrecen is the second largest city of Hungary with approximately 200,000 inhabitants. The city is the cultural, industrial, educational center of Hajdú-Bihar county in the Hungarian Northern Great Plain region and is located close the M3-M35 motorway. For this reason, both local and transit traffic are high thus a high fossil carbon load can be expected. During our sampling campaign, in total, 69 tree (woody plant species) and grass (herbaceous species, with exception of three species belonging to family Poaceae) leaf sample pairs at 35 different sampling points were collected throughout the city (Table 1, Figure 1) in order to examine the fossil carbon load in the different districts. Most of the sampled herbaceous species are therophyte. A few taxa are perennial, however, their buds are protected during the unfavorable seasons under a thin soil layer (hemicrypto-geophyte life form) in temperate climate (Convolvulus arvensis, Cynodon dactylon, Lolium perenne, Poa angustifolia) (Király Reference Király2009). Thus, the leaves of these herbaceous species are not evergreen. The samples were collected as close to the nearest road as possible, the grass samples were picked off at ground level (typicaly at 0–1-m distance from the edge of the roads) and the tree leaf samples at head height (~180 cm) typically at 0–2-m horizontal distance from the edge of the roads. A minimum 3 pieces of tree and grass leaves were collected at each sampling point. Plant species were identified based on Király (Reference Király2009). For comparison, we classified the different types of areas inside and around the city as follows: 1: crossroad in suburb; 2: edge of downtown; 3: busy crossroad; 4: botanical garden; 5: forested area in suburb; 6: downtown; 7: suburb; 8: Great Forest Debrecen.
Table 1 Sampled plant species and location of sampling in the city.*
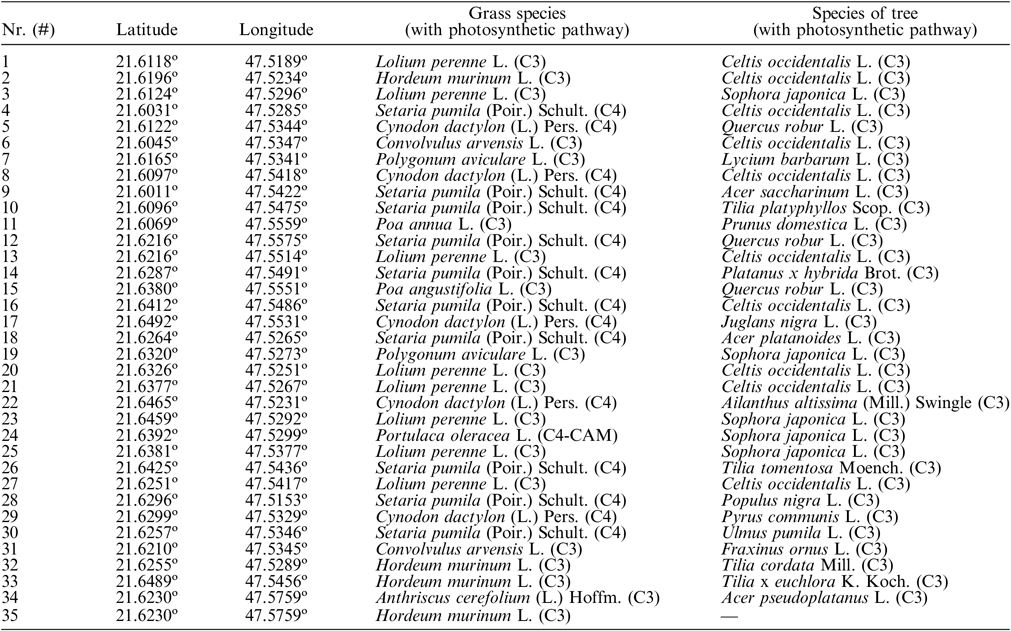
* The sampling points are shown in Figure 1.
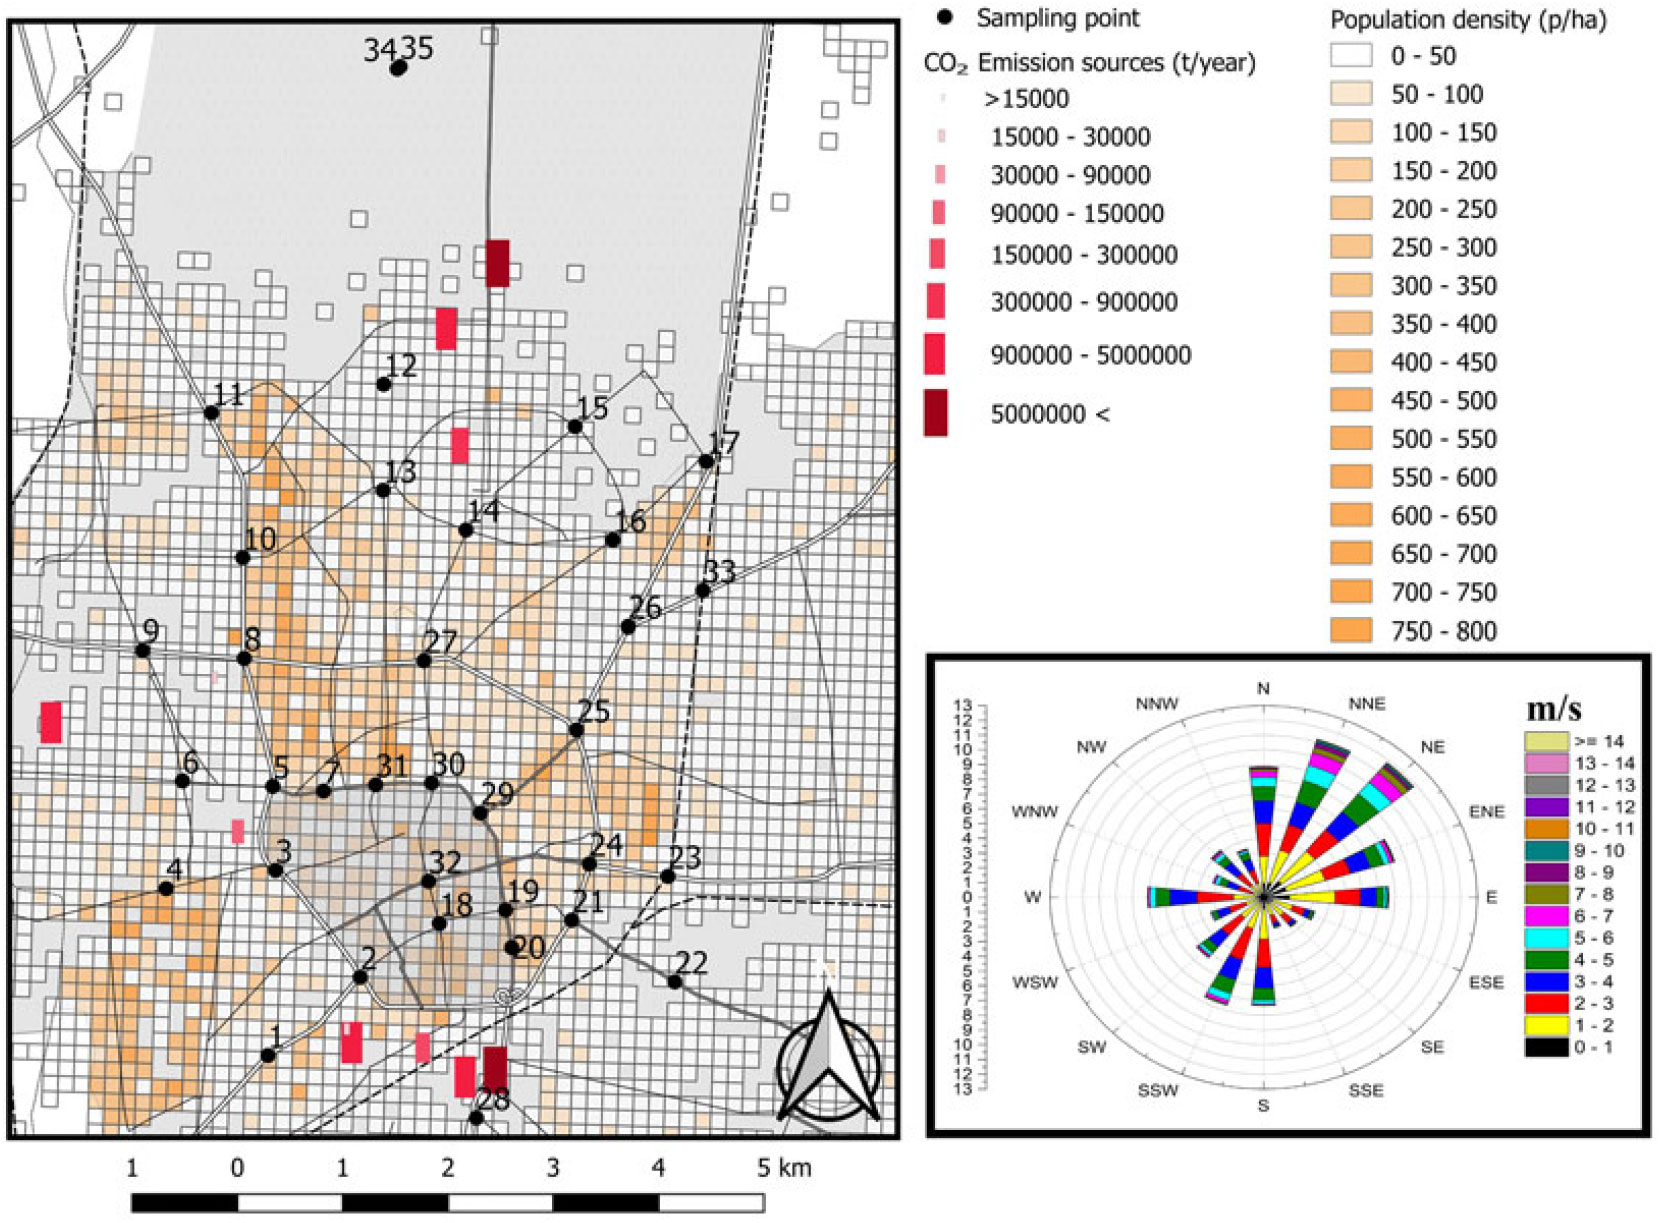
Figure 1 Location of sampling points with the population density, CO2 emission sources and wind rose of Debrecen during the studied growing season (March–September 2017).
In addition, 13 samples were collected close to each other in the courtyard of the Hertelendi Laboratory (Table 2) within a 50-m circle around a 14CO2 atmopsheric monitoring station (47.5427N, 21.6237E, 3 m a.g.l), where the local urban atmospheric CO2 has been sampled since 2008 (Molnár et al. Reference Molnár, Haszpra, Svingor, Major and Svetlík2010a). This backyard is a minimum of 50 m away from busy roads and intensive industrial activity (Molnár et al. Reference Molnár, Major, Haszpra, Svetlik, Svingor and Veres2010b; Major et al. Reference Major, Furu, Haszpra, Kertész and Molnár2015). In this way, it is possible to compare the 14C signals in plants during the vegetation period (March–September) to each other and to the local atmospheric 14CO2 data taken as background. For a more complete description of the sampling area, wind speed and direction data were also collected at an agrometeorological station, 7 km NW of downtown Debrecen.
Table 2 Sampled plant species and location of sampling in the courtyard of HEKAL Laboratory.

* Evergreen samples.
Sample Preparation and Measurement
The plant-derived samples were kept frozen until preparation. Before sample preparation, the leaves were cut into small pieces and homogenized. The standard Acid-Base-Acid sample preparation method (Southon and Magana Reference Southon and Magana2010) was used for purification of the plant material, then the samples were dried in heating block at 50°C. The purified and dried samples were combusted in sealed tubes at 550ºC for 12 hr, using MnO2 as an oxidant (Janovics et al. Reference Janovics, Futó and Molnár2018) to convert carbon in the organic material to CO2. The generated CO2 gas was extracted and purified from other contaminants and H2O in a dedicated vacuum line. The pure CO2 gas was subsequently transferred into glass tubes (with Zn, TiH catalysts and iron powder) sealed by flame and converted to graphite following the sealed tube graphitisation method (Rinyu et al. Reference Rinyu, Molnár, Major, Nagy, Veres, Kimák, Wacker and Synal2013). Finally, the graphite samples were pressed in to aluminium targets for the EnvironMicadas AMS measurements to determine the carbon isotopic composition (Molnár et al. Reference Molnár, Janovics, Major, Orsovszki, Gönczi, Veres, Leonard, Castle, Lange, Wacker, Hajdas and Jull2013). For data evaluation, “Bats” data reduction software was used (Wacker et al. 2010). For the data evaluation and calculations, percent Modern Carbon (pMC) unit was used (Stenström et al. Reference Stenström, Skog, Georgiadou, Grenberg and Johansson2011). The fossil carbon ratio of different samples was determined by the following equation (after Quarta et al. Reference Quarta, Rizzo, D’elia and Calcagnile2007):
 $${\rm{Fossil\; carbon\;ratio}}\;\left( {\rm{\% }} \right) = \left( {{{{R_B} - {R_S}} \over {{R_B}}}} \right) \times 100 = \left( {1 - {{pM{C_S}} \over {pM{C_B}}}} \right) \times 100$$
Where RB is the 14C/12C ratio of (local urban) background sample (atmospheric CO2 from March to September), RS is the is the 14C/12C ratio of the plant sample and consequently: pMCB is the percent Modern Carbon of local urban background sample (atmospheric CO2 from March to September), pMCS is the percent Modern Carbon of the plant sample.
RESULTS AND DISCUSSION
Background Atmospheric 14CO2 Results in the City
Our urban atmospheric 14C data in Debrecen shows quite good agreement with that of Hegyhátsál (10 m sampling elevation) regional background station in Western Hungary (46.95N, 16.65E, 248 m a.s.l) (Table 3). At the Hegyhátsál station, only a slightly diluted 14C ratio can be observed in the growing season, relative to that continental background stations such as Jungfraujoch or Schauinsland (Levin et al. Reference Levin, Kromer, Schoch-Fischer, Bruns, Münnich, Berdau, Vogel and Münnich1985; Major et al. Reference Major, Haszpra, Rinyu, Futó, Bihari, Hammer and Molnár2018). Consequently, the local atmospheric 14C sampling station in Debrecen (the courtyard of HEKAL) represents an adequate base level to determine the relative local fossil carbon load at the 35 different sampling points in the city.
Table 3 Monthly average atmospheric CO2 14C data at Debrecen city and the rural (Hegyhátsál) monitoring stations in the growing season of 2017.

Urban Vegetation Results
The relative fossil carbon content (%) was calculated from the measured pMC data of the local atmospheric CO2 background during the growing season (March–September) and urban vegetation (Table 4). The fossil carbon content for all the samples show diverse results with a wide range from –1.9% to 9.6%. It is a narrower range in the case of tree leaves alone (from –1.2% to 4.7%) around a relatively low average fossil carbon load (0.9 ± 1.2%, n = 35). However in grass samples, the average fossil carbon content is 2.5 ± 2.5% (n = 35) ranging from –1.9% to 9.6% (Figure 3). Examining the sample pairs, there is a correlation between the tree leaf and grass leaf sample pairs (Figure 3) regarding their observed fossil carbon ratio, that can be used to confirm the identification of potentially fossil-loaded area. The results obtained of Celtis occidentalis (C3 Tree), Setaria pumila (C4 Grass) and Lolium perenne (C3 Grass) plants show that the fossil-fuel derived carbon is not affected by different photosynthesis routes but the sample location relative to the road and local emission sources (Figures 2 and 3, Table 4).
Table 4 14C results and calculated fossil carbon ratio in the grass and leaf samples studied.


Figure 2 Fossil carbon content of different species and photosynthetic pathway. Solid blue curves are the histogram of the fossil carbon content of different species, dashed lines are the mean fossil carbon ratio of different photosynthesis pathway groups, the grey band around 0 % fossil carbon content is the error of the measurement.

Figure 3 Correlation between the fossil carbon ratio of tree and grass leaf sample pairs. The grey bar represents the uncertainity the AMS measurement and fossil carbon content calculation. The box-plot chart represents distribution of these data.
Removing some outliers, particularly the samples Nr. 12 and 28, the correlation between the sample pairs is relatively strong (R2 = 0.4403, with the outliers the R2 = 0.1653), and suggest that the tree leaves have just about 25% of fossil carbon content compared to their corresponding grass sample pairs. This shows how rapidly the traffic induced CO2 emission can be diluted as a function of distance from the road. A simple explanation can be that the specimens of grass species grows closer to the roads, and therefore to vehicle exhaust (Figure 3 and Table 4). Since the trees are situated further from the roads, there is enough time for the fossil CO2 to mix with ambient CO2. The relatively rapid mixing and dilution of traffic-derived CO2 are clearly demonstrated by the results from the courtyard of our institute (Table 5). This area is located inside the city but the sampling points are at least 50 m from busy roads and have generally lower fossil carbon ratios relative to atmospheric CO2 (average for grasses: 0.6 ± 0.9% (n = 6), for trees: –0.5 ± 0.6% (n = 6)). These data show that the samples from the yard are in a good agreement with the local atmospheric CO2 14C content, that is, the local vegetation can adequately represent the atmospheric carbon isotopic composition of local atmospheric CO2.
Table 5 Samples at the backyard of Atomki.

As discussed above, the fossil carbon content is within a narrow range (from –1.9 ± 0.6% to 9.6 ± 0.7%), but sometimes it can be a negative value. A negative fossil carbon load relative to the local background can be explained by biomass and wood burning as carbon sources, which have been affected by the elevated 14C level of the last five decades. Due to the bomb 14C, the biomass that has grown since the 1950s, has slightly higher specific 14C activity than the modern atmospheric CO2 of the respective years. This effect has already been observed and described in other studies dealing with 14C measurements of carbonaceous aerosols (Heal et al. Reference Heal, Naysmith, Cook, Xu, Duran and Harrison2011; Major et al. Reference Major, Furu, Haszpra, Kertész and Molnár2015). In the case of sampling points no. 1 and 33 in the suburbs, where the wood burning is a factor, the results show –1.9 ± 0.6% and –1.4 ± 0.7% in grass leaves and –0.5 ± 0.6% and –0.8 ± 0.7% fossil carbon content in tree leaves (Figure 1 and Table 4). This may be amplified by the soil respiration in forested areas, where the soil biological activity and litter decomposition can contribute to an enriched 14C signal (Trumbore Reference Trumbore2000) or essentially no fossil carbon content. We suggest this is the case for sampling points no. 15 and 17, where the fossil carbon content in tree leaves is –1.2 ± 0.5% and –0.9 ± 0.5% in our study. The most 14C depleted area is not in the downtown, thanks to the many pedestrian streets and limited traffic in the center of Debrecen city. The average fossil carbon content in the downtown is only 1.0 ± 1.0 and 0.4 ± 0.8% in the grass and tree leaf samples, respectively. The samples collected by busy crossroads and at the edge of the central area show the highest fossil carbon ratio, where the average fossil carbon content in the grass samples is 3.8 ± 2.4%, and the highest fossil contribution was 9.6 ± 0.7% in a crossroad at the edge of the downtown, at sampling point no. 5. For these areas, the fossil contribution in five cases of 21 grass samples exceeded 5%, and the value was higher than 2% in four cases. The average fossil contributions in tree leaves at the busy crossroads and the edge of the downtown were 1.5 ± 1.3% and 1.3 ± 0.5%, respectively.
In other districts, there are some outlier samples that can be explained by local conditions. The tree leaf sample no. 12 in the botanical garden has a higher fossil carbon content of 3.0 ± 0.5%. This sampling point is located in the botanical garden of the University of Debrecen, far from busy crossroads, but close to the power plant of the Clinical Center of Debrecen, see Figure 1. The situation for sampling point no. 28 is complex, because it is located by a busy crossroads and also close to the Debrecen electrical power plant. The fossil carbon content is higher in the tree leaf sample (4.7 ± 0.7%) than in the grass (2.7 ± 0.6%). In these two cases (sampling points 12 and 28), the atmospheric CO2 emissions of the power plants are high enough to increase fossil carbon content of nearby tree leaves to similar levels as in the vicinity of busy crossroads. Besides the sources discussed, many other factors can influence the fossil carbon content of the local atmospheric CO2 such as the design of the city. As the Figure 1 and Table 4 shows, densely populated areas have higher fossil carbon content. Traffic jams occur more frequently at these areas, which result in more concentrated fossil CO2 emission. Moreover, high residential buildings and long block of flats can creat a local barrier to mixing and refreshing of the air, by blocking the path of prevailing winds. Around these densely populated areas where the local and transit traffic also high, such as in the case of the 5,7,8,10,11,21 sampling points, these properties can amplify each other and create good conditions for the 14C depletion by the increased fossil CO2 emissions from traffic (Figure 1).
CONCLUSION
Eighty-two plant samples from 36 different locations were measured in the region of Debrecen, Hungary. In our study, the fossil load of plants deriveing from different type of urban areas, such as downtown, suburban areas and forests were investigated. The base reference level for fossil carbon load calculations given by the local atmospheric 14CO2 information. The results from the courtyard of HEKAL show there is no clear difference compared to the 14CO2 results of the local sampling station located here, consequently there is no significant fossil carbon contribution in this area during the vegetation period. Fossil carbon ratios were calculated for all samples and show a wide range of fossil and modern carbon load (from –1.9% to 9.6%). It is a narrower range in the case of tree leaves alone around a relatively low average fossil carbon load (0.9 ± 1.2%, n = 35). However in grass leaf samples, the average fossil carbon content is 2.5 ± 2.5% (n = 35). Our data show a relatively strong correlation between the grass leaf-tree leaf sample pairs and suggest that the tree leaves have just about 25% of fossil carbon content compared to their corresponding grass-sample pairs, in average. This might be an indication of how rapidly the traffic induced CO2 emission can be diluted as a function of distance from the road. There are observable and higher fossil carbon load in local scale at the busy crossroads, as high as 9.6 ± 0.7% at ground level and 4.7 ± 0.7% at the height of tree leaves. In contrast, there is a clearly visible modern, post-bomb carbon emission from wood burning or soil CO2 emission and litter decomposition in the suburbs, which can result in an apparently small negative fossil carbon load. Our study shows that the decidious tree and grass samples can easily applied for monitoring the 14C level and fossil carbon load. This approach could be a reliable and relatively cheap method to monitor the local atmospheric 14C level in CO2 not just for close to nuclear facilities, but the vicinity of fossil loaded areas. Our results highlight the importance of collecting samples from the local vegetation as a record of local fossil-fuel and modern-carbon contributions to the CO2 load.
ACKNOWLEDGMENTS
The research was supported by the European Union and the State of Hungary, co-financed by the European Regional Development Fund in the project of GINOP-2.3.2-15-2016-00009 “ICER.”


