


INTRODUCTION
Radiocarbon (14C) ages are converted into calendar ages by reference to the appropriate calibration curves; in general the IntCal13 calibration (Reimer et al. Reference Reimer, Bard, Bayliss, Beck, Blackwell, Bronk Ramsey, Buck, Edwards, Friedrich, Grootes, Guilderson, Haflidason, Hajdas, Hatté, Heaton, Hogg, Hughen, Kaiser, Kromer, Manning, Niu, Reimer, Richards, Scott, Southon, Turney and van der Plicht2013) is used for the Northern Hemisphere and SHCal13 (Hogg et al. 2013) for the Southern Hemisphere. While these calibration curves have recently been revised utilizing the latest accelerator mass spectrometry (AMS) 14C measurement data, they still mainly depend on 14C ages of tree rings obtained from a limited number of regions. However, the measurement precision of AMS 14C has continued to improve, and the regional variation of atmospheric 14C concentration, that is, the age offset from a given calibration curve, is an active area of discussion (i.e. Manning et al. Reference Manning, Kromer, Kuniholm and Newton2001; Hua et al. Reference Hua, Barbetti, Zoppi, Fink, Watanasak and Jacobsen2004; Dee et al. Reference Dee, Brock, Harris, Bronk Ramsey, Shortland, Higham and Rowland2010; Kromer et al. Reference Kromer, Manning, Friedrich, Talamo and Trano2010).
In the Japanese archipelago, a possible deviation in the 2nd century AD has already been pointed out (Sakamoto et al. Reference Sakamoto, Imamura, van der Plicht, Mitsutani and Sahara2003). Nakamura et al. (Reference Nakamura, Masuda, Miyake, Nagaya and Yoshimitsu2013) measured 14C ages of annual tree rings of Japanese cedar grown on Yaku-shima Island and a sample from the wood members of the Murou-ji Temple spanning the past two millennia, and concluded that the ages of these samples were between those given by IntCal and SHCal in some instances, indicating possible influence of air masses from the Southern Hemisphere. Japanese cedar from Yaku-shima Island, called Yaku-sugi, is preferred for 14C dating to investigate solar activity (Miyahara et al. Reference Miyahara, Masuda, Muraki, Uemura, Kato, Toyoizumi, Furuzawa, Nakamura, Kitagawa and Matsumoto2004) or cosmic-ray events (Miyake et al. Reference Miyake, Nagaya, Masuda and Nakamura2012) because of the large number of tree rings typical of this species. However, more tree rings from a variety of locations are required to better characterize regional variation of atmospheric 14C concentration, since Yaku-shima Island is located in the southern area of the Japanese archipelago surrounded by ocean.
In addition, calibration curve fine structure should be considered when conducting 14C wiggle matching. In the case of dating research on historical wooden buildings in conjunction with 14C dating and architectural history (i.e. Nakao et al. Reference Nakao, Sakamoto and Imamura2014), tree-ring sampling for 14C wiggle matching is often limited to the small number of total tree rings available in wood objects. The cultural value of the historic building also limits the wood samples that can be obtained for analysis; only a limited number of small 14C samples can be obtained from inconspicuous parts of the wood members. When 14C wiggle matching against a calibration curve does not work properly, one should take into account not only measurement uncertainty but also regional offsets as well as the fine structure of the calibration curve itself. To explore this issue, we collected samples of Japanese trees from the late middle ages to the early modern period (AD 1400s to 1800s) from various regions and dated them with AMS 14C dating on all samples.
SAMPLES AND MEASUREMENTS
Five samples of middle to early modern tree rings were obtained. Among them, four were members of middle ages to early modern wooden historical buildings, while the fifth was from a shrine forest (Table 1). Locations of the buildings that were the sources of samples used in this study are shown in Figure 1, although the provenance of the wood used in each structure is unknown except for STSAB-1.
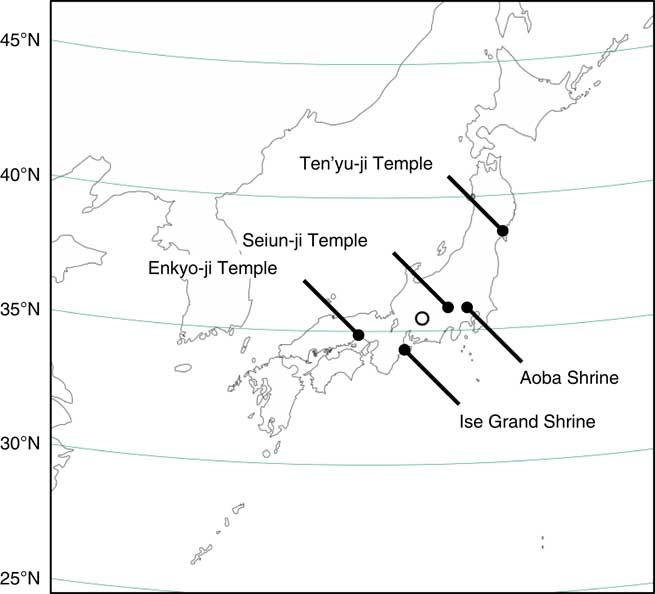
Figure 1 Locations of samples and buildings. Open circle indicates the estimated provenance of the pagoda pillar from the Aoba-jinja Shrine.
Table 1 List of Japanese trees for AMS-14C measurement.

Dendrochronological age determination of STSAB-1 was carried out by coauthor Hakozaki by comparison to the master chronological dataset for Japanese cypress of Kiso, central Honshu Island, suggesting its provenance as well. On the other hand, dendrochronological analysis of sample MEISJ-1 was not successful. Although MEISJ-1 fell over during Typhoon Melor of AD 2009, it had previously been damaged by Typhoon Vera of AD 1959 and is supposed to have a few missing rings. In addition, no master dataset is presently available for either Japanese zelkova or southern Japanese hemlock.
Nakatsuka found good correlation of the oxygen stable isotope ratio (δ18O) of cellulose for Japanese tree rings with relative humidity, which is a proxy for summer precipitation (Nakatsuka et al. Reference Nakatsuka, Sano, Xu, Kimura and Mitsutani2014). This correlation does not depend on the tree species and the patterns of its annual change are similar for different regions in the Japanese archipelago. Accumulation of δ18O data for Japanese tree rings of known age is ongoing, and a master chronological dataset of δ18O for trees of central Honshu Island is in development.
Cellulose extraction from tree rings was carried out in accordance with Kagawa et al. (Reference Kagawa, Sano, Nakatsuka, Ikeda and Kubo2014). Wood was cut into blocks of <2 cm in width and <10 cm in length and sliced into a plate 1 mm thick by a low-speed precision wheel saw of boron nitride. After ultrasonic cleaning using acetone and a 2:1 v/v chloroform-methanol solvent mixture, each tree-ring plate was slipped between PTFE perforated sheets and stitched up by PTFE (HGHEK-2 and MEISJ-1, italicized in Table 1) or cotton string. The sample was put into a test tube and bleached four times (1 hr each time) with a solution of sodium chlorite and concentrated HCl at 70°C. Hemicellulose was removed using a 17.5 wt% NaOH solution (1 hr, three times at 80°C). After neutralization, the sample was vacuum-freeze dried. Bleached annual tree rings were separated under a microscope and stored in glass tubes.
Annual tree-ring cellulose was divided into aliquots of about 0.1–0.3 mg and wrapped in 7 mm×7 mm silver foil square for δ18O measurement by elemental analyzer-isotope ratio mass spectrometry (EA-IRMS), which was performed in the laboratory of the Research Institute for Humanity and Nature. Figure 2 is illustrates how tree-ring age was established by matching patterns of δ18O in a tree with a master chronology.
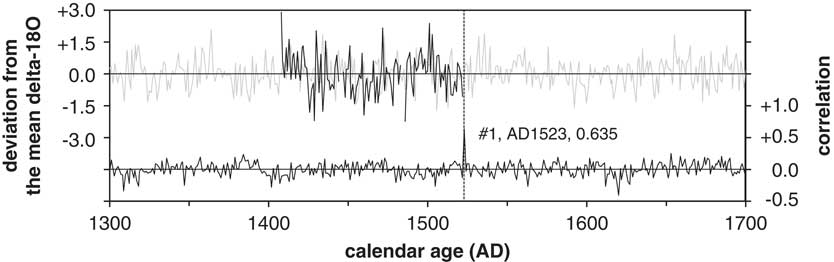
Figure 2 Age determination of HGHEK-2 by δ18O of cellulose. The deviation from the mean value (upper solid line) was compared to that of accumulated data from central Japan (upper gray line), and the correlation is shown below with a maximum value (r=0.653) when the outermost ring (#1) is AD1523.
RADIOCARBON ANALYSES
Sub-milligram quantities of cellulose from five successive individual tree rings of HGHEK-2 were combined into one sample, and their graphitization and AMS 14C measurements were performed by the Tono Geoscience Center of the Japan Atomic Energy Agency (JAEA). Five tree rings of YNKSU-2 were combined into one sample, and their graphitization and AMS 14C measurements were performed by the Institute of Accelerator Analysis Ltd., Japan (IAA). Graphitization and AMS-14C dating of MGTYJ-1 and SASTB-1 for groups of three successive tree rings were also conducted by IAA.
AMS 14C measurements of MEISJ-1 were carried out in several batches. At first, annual tree rings from AD1545 to 1610 were graphitized and measured by the Yamagata University high sensitivity accelerator center, Japan (YU-AMS). Subsequently AMS 14C measurement of the 5-yr ring groups was performed by IAA for AD 1535–1954, which enabled a more accurate redetermination of tree-ring ages presented previously (Sakamoto et al. Reference Sakamoto, Nakao and Nakatsuka2015). Additional qAMS 14C measurement of the 3-yr ring groups was performed by Beta Analytic Inc. for AD 1668–1700. Another tree-ring cross-section was obtained from the butt end of MEISJ-1, bleached, and analyzed using AMS-14C including graphitization by the YU-AMS. Rings were combined into 5-yr groups at ca. AD 1600 and rings were combined into 3-yr groups for the period at ca. AD 1700.
RESULTS AND DISCUSSION
The tabulated tree-ring 14C data of this study are presented in the supplemental material. Younger and older 14C age anomalies caused by modern and dead carbon were not observed in the data, leading us to conclude that any contamination from the cotton and PTFE stitches was minor.
The HGHEK-2 sample covered the period from AD 1408–1522. The results are shown in Figure 3, along with the ±1σ range of the IntCal13 calibration curve and original datasets cited from http://intcal.qub.ac.uk/intcal13. Although the data mainly fall along the IntCal13 curve, slight fluctuations can be seen around AD 1450, as well as a small offset around AD 1500.

Figure 3 Relation between 14C age of HGHEK-2 (open squares with measurement error of 1σ), IntCal13 (gray lines of 1σ uncertainty), and the original datasets of IntCal13 (small gray filled circles with measured years and 1σ error).
The YNKSU-2 sample covered the period from AD 1493–1682. The results are shown in Figure 4 in the same manner as Figure 3. The offset around AD 1500 seems to be in common with HGHEK-2, while the rest of the period aligns with IntCal13.

Figure 4 Relation between 14C age of YNKSU-2 (open square with measurement error of 1σ), IntCal13 (gray lines of 1σ uncertainty), and the original datasets of IntCal13 (small gray filled circles with measured years and 1σ error).
Figure 5 shows the 14C ages of 5-yr groups of tree rings from MEISJ-1 with known age (large open squares) and those of annual tree rings (error bars only), compared to IntCal13 and its source data. Systematic offsets from IntCal13 seem to be found in both annual and 5-yr data for the latter half of 16th century although little offset can be found for YNKSU-2. In addition, there are fluctuations in the late 17th century to 19th century. In this period 14C wiggle matching of wood samples from middle to early modern houses often does not work well (Sakamoto et al. Reference Sakamoto, Nakao and Imamura2013); however, their 14C ages agree well with this fluctuation rather than IntCal13.
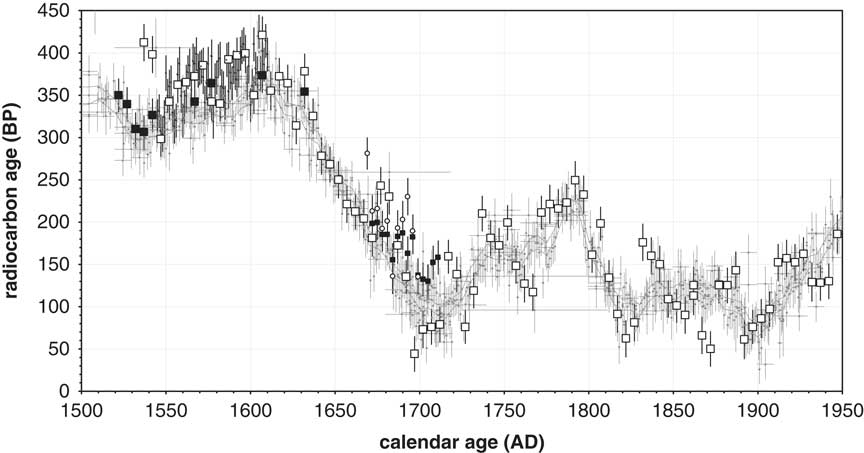
Figure 5 Compilation of 14C age data for MEISJ-1 (open and solid squares or circles with measurement error of 1σ) in relation to IntCal13 (gray lines of 1σ uncertainty), and original datasets of IntCal13 (small gray filled circles with measured years and 1σ error). The symbol size of MEISJ-1 corresponds to its number of ring groups.
Thus far, fluctuation has been hard to reproduce. Although 14C ages reported by YU-AMS (solid large squares in Figure 5) seem to distribute between previous results and IntCal13 within error (disregarding two outlier points prior to AD 1550), 14C ages reported by Beta Analytic Inc. (open small circles in Figure 5) and YU-AMS (open small squares in Figure 5) almost coincide with each other and seem not to follow the 14C ages reported by IAA.
Determination of tree-ring age of MGTYJ-1 using the δ18O dataset of central Honshu island was not successful; AD 1739 was the most plausible age for the outermost ring but the correlation was poor. From spring to summer, cold and humid northeasterly winds from the Pacific Ocean typically blow onto the coastal areas of the northeast Japanese archipelago. This affects the oxygen isotopic ratios in the cellulose of growing trees, and their annual patterns do not match well with those of the central Japanese archipelago. Thus, another δ18O dataset with known tree-ring age obtained from the same prefecture of MGTYJ-1 was applied, and confirmed that the outermost ring was AD 1739 (Tsushima, personal communication). Figure 6 shows the 14C ages of three-year ring groups when the outermost tree ring was AD 1739. Fluctuation similar to that of MEISJ-1 measured by IAA can be found around AD 1700. It is remarkable that the source data of IntCal13 also show wider dispersion in this period, suggesting the inhomogeneity of atmospheric 14C concentration.
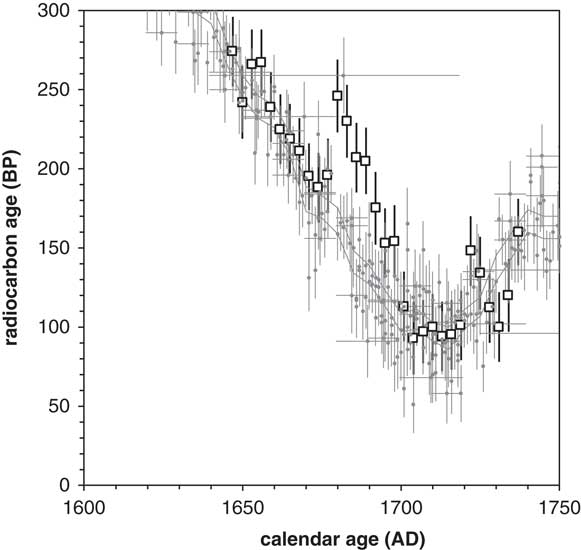
Figure 6 Relation between 14C age of MGTYJ-1 (open square with measurement error of 1σ), IntCal13 (gray lines of 1σ uncertainty), and original datasets of IntCal13 (small gray filled circles with measured years and 1σ error).
Table 2 is the comparison of 14C age offsets between IntCal13 and different AMS laboratories and samples for the overlapping period. Considering that the offset of SHCal13 from IntCal13 is +40±11 (AD 1670–1700, n=7), during this period at least, 14C ages of Japanese tree rings seem to be affected by Southern Hemispheric air masses introduced by East Asian monsoons as Hua et al. (Reference Hua, Barbetti, Zoppi, Fink, Watanasak and Jacobsen2004) and Nakamura et al. (Reference Nakamura, Masuda, Miyake, Nagaya and Yoshimitsu2013) have discussed.
Table 2 14C age offsets from IntCal13 for the overlapping period.

Although tree rings in the period AD 1671–1936 can all be identified by dendrochronology, tree rings of AD 1781–1900 were selected from SASTB-1 to confirm the fluctuation that appeared in MEISJ-1 during the 19th century. The results are shown in Figure 7 in the same manner as prior figures. The data of MEISJ-1 fall roughly above those of IntCal13, although the patterns of fluctuations seem to match.
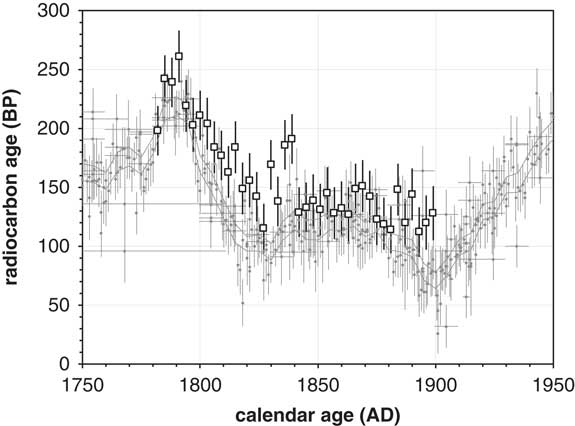
Figure 7 Relation between 14C age of STSAB-1 (open squares with measurement error of 1σ), IntCal13 (gray lines of 1σ uncertainty), and original datasets of IntCal13 (small gray filled circles with measured years and 1σ error).
These 14C ages of the tree rings discussed above are comparable to those obtained for AD 1410–1860 by Nakamura et al. (Reference Nakamura, Masuda, Miyake, Nagaya and Yoshimitsu2013), who concluded that the data were between IntCal and SHCal. Although some outliers might exist suggesting sample contamination, our results seem to follow the original datasets of IntCal13 within measurement error.
The deviation of measured 14C age of tree rings from IntCal13 can be calculated by the following formula:
 $$\Delta Z{\equals}{{T\left( t \right)_{{sample}} {\minus}T\left( t \right)_{{IntCal13}} } \over {\sqrt {\sigma \left( t \right)_{{sample}} ^{2} {\plus}\sigma \left( t \right)_{{IntCal13}} ^{2} } }}$$
where ΔZ is the normalized difference, T sample and T IntCal13 are respectively the 14C ages of the tree-ring sample, and the corresponding linearly interpolated IntCal13 for a center age of the tree-ring group t, and σ sample and σ IntCal13 are their respective uncertainties. The ΔZ values are calculated from the individual dataset of each sample except MEISJ-1, for which only IAA data are used. Each ΔZ histogram is plotted in Figure 8 along with a dashed line of the best fit to a normal distribution by the method of least squares and a solid line showing a standard normal distribution (μ=0, σ=1).
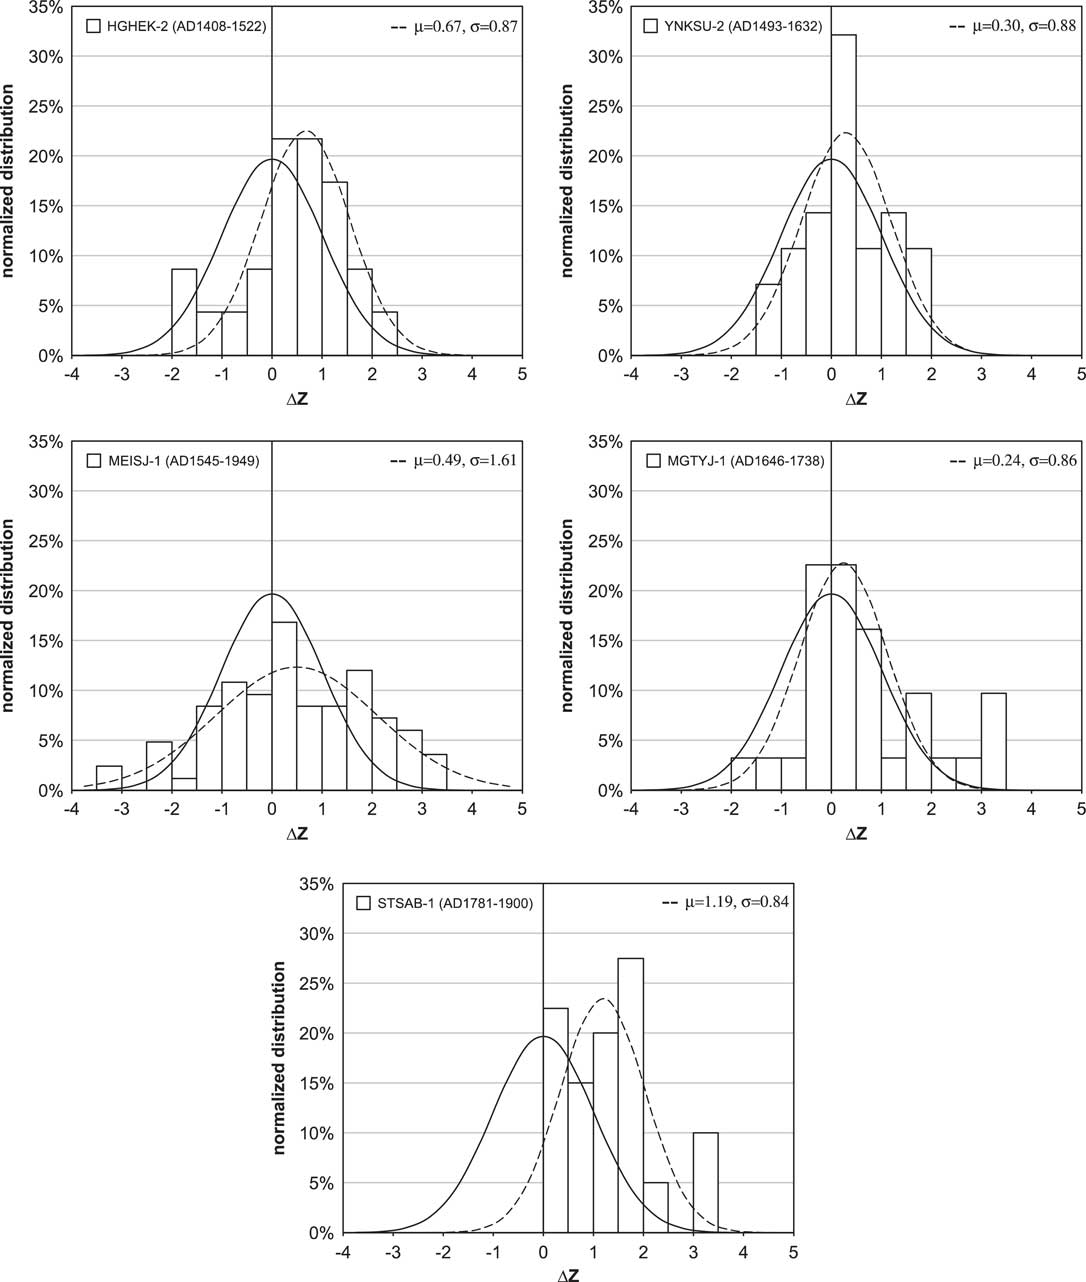
Figure 8 Distribution of normalized differences (ΔZ) between 14C ages of each tree ring and IntCal13. Dashed lines show the best fit to a normal distribution and solid lines show a standard normal distribution.
One of the possible causal factors for regional offsets of 14C age from IntCal13 calibration curve is the input of air masses with different 14C concentrations, such as from the southern to northern hemispheres, or perhaps less likely, introduction of 14C-concentrated air from the high latitude stratosphere. The range of HGHEK-2 (AD1408-1522) is included in the period of the Spörer sunspot minimum (AD 1416–1534) (Stuiver and Quay Reference Stuiver and Quay1980). The results fit well to IntCal13 mainly during low solar activity, and the shift in ΔZ distribution represents the offset from the plateau of IntCal13 corresponding to the latter half of the period. On the other hand, the ΔZ distribution of YNKSU-2 (AD 1493–1632) is close to a standard normal distribution, indicating that there are no biases in the measurement and little regional offset for this sample along the plateau of the 16th century AD.
The 14C ages of MEISJ-1 (AD1545-1949, excluding three data points from AD 1435 and after AD 1950) show high variability. Kromer et al. (Reference Kromer, Manning, Kuniholm, Newton, Spurk and Levin2001) suggested an enhanced seasonal 14CO2 cycle during periods of deep solar minima. The 14C age fluctuation of Japanese tree rings during the latter half of the 17th century AD, presumably affected by southern hemispheric air masses as mentioned above, might be enhanced during the period of Maunder sunspot minimum (AD1645-1715) (Eddy 1976).
Figure 9 shows the differential 14C ages of STSAB-1 (AD1781-1900) and MEISJ-1 from IntCal13. Although the ΔZ values of STSAB-1 tend to be more positive than those of MEISJ-1, (which may be due to contamination effects), their 14C ages show similar behavior in some periods. These results are not sufficient to determine the regional variation of 14C ages of Japanese tree rings, and we are preparing additional 14C measurements of these annual tree rings.
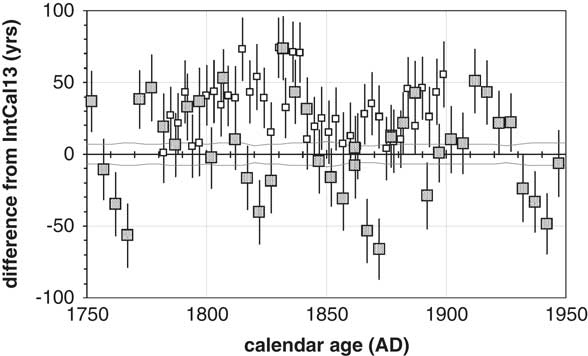
Figure 9 Differential 14C ages of STSAB-1 (open squares with measurement error of 1σ), MEISJ-1 (hatched squares with measurement error of 1σ) and IntCal13 (gray lines of 1σ uncertainty).
CONCLUSIONS
AMS 14C measurement of middle to early-modern Japanese tree rings was carried out to investigate the fine structure in the calibration curve for the Japanese archipelago at that time. From the 15th century to the middle of the 17th century, 14C ages of Japanese tree rings followed IntCal13 within measurement error, although some data slightly exceeded the calibration curve during the 16th century AD. On the other hand, possible fluctuations during the latter half of the 17th century to the early the 18th century AD were observed in different tree samples. Although these fluctuations do not seem to be clearly reproduced in additional measurements, anomalous divergence from IntCal13 might be plausible, suggesting the inhomogeneity of atmospheric 14C concentration. In the 19th century AD, patterns in the fluctuation of 14C ages of samples MEISJ-1 and STSAB-1 seem to be similar despite their uncertainties but did not exactly match each other. Accurate and high-resolution 14C dating of tree rings is required to achieve effective 14C wiggle matching as well as to understand the effect of regional variations on the calibration curve.
ACKNOWLEDGMENTS
We would like to thank the Forestry Office of Ise Grand Shrine (MEISJ-1), Mr. Kiyohito Segawa (MGTYJ-1), and Mr. Hideo Iida (STSAB-1) for their sample provision, and the owners of each temple and shrine for their cooperation. The Japanese Association for Conservation of Architectural Monuments (JACAM) and the responsible builder agency supported us in the investigation (HGHEK-2, YNKSU-2). Dr. Masaki Sano and Dr. Zhen Li of the Research Institute for Humanity and Nature (RIHN) helped with δ18O measurement, and Prof. Fuyuki Tokanai of Yamagata University with AMS 14C measurement. HGHEK-2 was measured under the Shared Use Program of JAEA Facilities. Anonymous reviewers and editors also gave us useful comments on this manuscript.
This work was one of the results of the Collaborative Research Program of the National Museum of Japanese History and the RIHN Research Project of the Ecohistory Program (H-05). JSPS Grant in Aid (#23300325, #25282075) also supported our research.
SUPPLEMENTARY MATERIALS
For supplementary materials referred to in this article, please visit https://doi.org/10.1017/RDC.2017.133


