


INTRODUCTION
As an important archive of Quaternary climatic changes, aeolian deposits are a product of aridification (Liu Reference Liu1985; Guo et al. Reference Guo, Ruddiman, Hao, Wu, Qiao, Zhu, Wei, Yuan and Liu2002; Frechen Reference Frechen2011; Meszner et al. Reference Meszner, Kreutzer, Fuchs and Faust2013; Yang et al. Reference Yang, Mason, Zhang, Lu, Ji, Chen and Liu2017; Zhao et al. Reference Zhao, William, Williams, Long and Ji2018; Li et al. Reference Li, Han, Lu, Chen, Li, Yuan, Zhou, Jiang and Lv2018; Lu et al. Reference Lu, Wang, Wang, Chang, Zhang, Xu, Zhang, Wei, Zhang, Yi, Zhang, Feng, Wang, Wang and Han2019). To date, most research has focused mainly on the aeolian deposits in arid and semi-arid areas in northwest China as well as valuable insights into past climate change (e.g. An et al. Reference An, Kutzbach, Prell and Porter2001; Lu et al. Reference Lu, Wang and Li2010; Meng et al. Reference Meng, Liu, Balsam, Li, He, Chen and Ji2015, Reference Meng, Liu, Wang, Balasm, Chen and Ji2018; Yang et al. Reference Yang, Ding, Li, Wang, Jiang and Huang2015; Sun et al. Reference Sun, Liu, Liu, Deng, Brian, Windley and Fu2017; Da et al. Reference Da, Zhang, Li, Meng and Ji2019; Sun et al. Reference Sun, Yan, Nie, Li, Shi, Qiang, Chang and An2019a) and paleo-dust activity (Chen et al. Reference Chen, Li, Yang, Rao, Lu, William, Sun and Ji2007; Zhang et al. Reference Zhang, Lu, Stevens, Feng, Fu, Geng and Wang2018; Meng et al. Reference Meng, Liu, Zhao, He, Chen and Ji2019; Sun et al. Reference Sun, Yin, Crucifix, Clemens, Araya-Melo, Liu, Qiang, Liu, Zhao, Liang, Chen, Li, Zhang, Dong, Li, Zhou, Berger and An2019b). There has been increasing interest beyond the arid and semi-arid region (e.g. Liu et al. Reference Liu, Wu, Li and Zhang1997; Hao et al. Reference Hao, Guo, Qiao, Xu and Oldfield2010; Qiao et al. Reference Qiao, Hao, Peng, Wang, Li and Liu2011; Jia et al. Reference Jia, Lai, Zhang, Peng, Zhang and Zhang2012; Han et al. Reference Han, Li, Yi, Stevens, Chen, Wang and Lu2015; Li et al. Reference Li, Han, Lu, Chen, Li, Yuan, Zhou, Jiang and Lv2018; Wang et al. Reference Wang, Lu, Zhang, Wu, Hou, Fu and Geng2018; Han et al. Reference Han, Hao, Qiao, Wang, Peng, Li, Gao, Fu, Xu and Gu2019). Although the middle Yangtze River Basin (YRB) is located in a subtropical humid region, aeolian deposits are widely distributed in this area. Those deposits (including aeolian sands and loess) blanket some beaches of the YRB (Yang Reference Yang1985; Figure 1). The aeolian units consist of gray-yellow sands and they are usually sandwiched by several thin-bedded lacustrine mud layers and/or sandy silt (Liu et al. Reference Liu, Wu, Li and Zhang1997; Jia et al. Reference Jia, Lai, Zhang, Peng, Zhang and Zhang2012). Colloquially known as “sand hills”, these sand deposits are mainly distributed on the south bank of the Yangtze River, with an altitude of about 40–100 m. These units were previously believed to be fluvial in origin (Wang et al. Reference Wang, Zhu and Zheng1985). Evidence of chronology, geomorphology, and sedimentology from the sand hills indicated that they were mainly transported by winds from the proximal river and/or lake beds (Yang Reference Yang1985; Liu et al. Reference Liu, Wu, Li and Zhang1997).

Figure 1 (a) Map showing the distribution of loess and sandy deserts in China. (b) Distribution of sand hills and loess in the middle YRB. Triangles denote the location of sections HG-C, TP, and D-D transect.
There have been numerous studies on the age of sand hills in the middle reaches of the Yangtze River. However, the results obtained using different dating methods are significantly different. For example, the radiocarbon (14C) ages of sand hills indicated that they were formed since ~30 ka BP (Yang Reference Yang1985; Liu et al. Reference Liu, Wu, Li and Zhang1997; Zhuang et al. Reference Zhuang, Jia, Ma, Hu, Zhang and Wu2007). Thermoluminescence (TL) ages have shown that the sand hills formed before ~55 ka and after ~25 ka, corresponding to marine isotope stages (MIS) 4 and 2, respectively (Wu et al. Reference Wu, Yang and Wang2000; Hu et al. Reference Hu, Yang, Huo and Li2006; Ren et al. Reference Ren, He and Yang2008). A large number of optically stimulated luminescence (OSL) ages obtained in recent years show that the sand hills developed since ~80 ka, equivalent to late MIS 5 (Lai et al. Reference Lai, Zhang and Chen2010; Jia et al. Reference Jia, Lai, Zhang, Peng, Zhang and Zhang2012; Han et al. Reference Han, Li, Yi, Stevens, Chen, Wang and Lu2015). This discrepancy in chronological framework often leads to ambiguous conclusions when interpreting the climatic and environmental implications of these deposits (Liu et al. Reference Liu, Wu, Li and Zhang1997; Han et al. Reference Han, Li, Yi, Stevens, Chen, Wang and Lu2015; Figure 4).
Similarly, the Xiashu loess is widely distributed in the YRB (Liu Reference Liu1985; Zhang et al. Reference Zhang, Yu, Lu, Zheng and Shi2007). The traditional point of view suggests that the Xiashu loess was mainly transported from the north of China (Liu Reference Liu1985; Xiong et al. Reference Xiong, Ding and Liu1999; Chen et al. Reference Chen, Li, Han, Yang, Wang and Yang2008). This viewpoint implied that the East Asian winter monsoon was substantially enhanced during the Last Glaciation, which transported dust form the remote areas to the lower latitudes in the YRB. However, recent studies have suggested that environmental deterioration in the YRB during the glacial periods may have been the causal factor for the formation of the Xiashu loess (Hao et al. Reference Hao, Guo, Qiao, Xu and Oldfield2010; Qiao et al. Reference Qiao, Hao, Peng, Wang, Li and Liu2011; Jia et al. Reference Jia, Lai, Zhang, Peng, Zhang and Zhang2012; Hu et al. Reference Hu, Jia, Zhang, Peng, Ling and Wang2013; Liu et al. Reference Liu, Li and Chen2014). Li et al. (Reference Li, Han, Yang and Fang2006) and Jia et al. (Reference Jia, Lai, Zhang, Peng, Zhang and Zhang2012) preliminarily discussed the possible link between sand hills and loess. They proposed that the sand hills, together with the loess, are typical units of aeolian deposits formed during glacial periods. Furthermore, based on 14C dating results, Li et al. (Reference Li, Han, Yang and Fang2006) considered that these aeolian units were formed during MIS 3 and 2. However, based on OSL ages, Jia et al. (Reference Jia, Lai, Zhang, Peng, Zhang and Zhang2012) suggested that they were deposited since late MIS 5.
To resolve this controversy, here we extract charcoal concentrates from the bulk samples of sand hills and the Xiashu loess in the Jiujiang area of the YRB for AMS14C dating. By comparing existing chronological data in this region, we discuss the age of these aeolian deposits. In addition, the relationship of aeolian sand and dust is discussed and a model for the development of aeolian deposits in the YRB is proposed.
STUDY AREA AND LITHOSTRATIGRAPHY OF AEOLIAN DEPOSITS
The study area is located in the middle reaches of the YRB, which is affected by the East Asian monsoon. The northerly wind prevails in the winter months (October to March of the following year). Mean annual temperature is 14°C and annual precipitation is 1570 mm, 80% of which occurs during the summer months (June to August; Zhuang et al. Reference Zhuang, Jia, Ma, Hu, Zhang and Wu2007). Vegetation in this area is composed mainly of mixed broadleaf evergreen and deciduous forest and species of Fagaceae are the major dominant species. The topography of study area is characterized by low lying plains and hills. The northern part of the study area is close to the Yangtze River riverway. The central part is the Poyang Lake Plain, which is a large alluvial plain mainly drained by five rivers (the Xiushui, Ganjiang, Fuhe, Xingjiang and Raohe). The Lushan mountain range runs from north to south in the northwest and a low Jiuhuashan remnant (the altitude is less than 500 m) in the northeast.
The Hongguang section C (denoted hereafter as HG-C) (116°24′E, 29°50′N) is located in Pengze County, Jiujiang City, Jiangxi Province. The section is ~30 m high, exposed due to a local construction project (Figure1b). The section consists of interbedded aeolian sand layers, lacustrine layers, and loess layers. A detailed description of this section can be found in Jia et al. (Reference Jia, Lai, Zhang, Peng, Zhang and Zhang2012). The Taipingguan section (denoted hereafter as TP) (116°25′E, 29°45′N) is ~11 km away from the HG-C section, which is located in a transitional position from the Yangtze River floodplain to the Lvgong Mountain (Figure 1b). Loess was accumulated on the slope and the adjacent hilly areas, resulting in a series of large loess ridges. The TP section is 18.6 m thick, exposed due to a local construction project. It is the thickest Xiashu loess section currently found in the YRB. The whole section can be divided into 4 layers from top to bottom, including modern soil (0–0.4 m), massive, iron-manganese coated loess (0.4~16.6 m), and reticulated yellow loess rich in iron-manganese coating (16.6~18.6 m).
SAMPLE PREPARATION AND MEASUREMENT
Charcoal concentrates were extracted for AMS 14C dating from the HG-C and TP sections. The procedures were as follows: (1) samples were dried thoroughly at room temperature and subsequently sieved to remove visible plant remains such as rootlets; (2) weigh an appropriate amount of sample, add an excess of 15% HCl to stand for 12 hr, and then rinse repeatedly with ultra-pure water until it is neutral; (3) add 7.5% NaOH solution to the sample, heated in water bath at 80°C for 10 min, let it stand for 12 hr, and then rinse with ultra-pure water to neutral reaction; (4) add an excess of 40% HF to stand for 12 hr, then rinse with ultra-pure water to neutral; (5) add 36% HCl, heated in water bath at 80°C for 10 min, stand for 12 hr, and then rinse with ultra-pure water to neutral; (6) sieve the charcoal concentrates using meshes of 10 μm opening; and (7) rinse the charcoal concentrates with 1.5% NaClO2 for 15 min, and then rinse with ultra-pure water to neutral. The charcoal concentrates were dried thoroughly in an electrical oven at 50°C and then stored airtight in small plastic vials. Extraneous matter was removed according conventional methods, including the removal of carbonates using HCl, removal of humic acids using NaOH, and the removal of silica using HF. In order to date the original carbon, NaClO2 was employed to aid in the removal organic residue. Samples were pretreated at Jiang Normal University. Samples were measured for 14C at Beta Analytic Inc. USA using the AMS facility. 14C calibration was conducted using Calib v7.0.2 (Stuiver and Reimer Reference Stuiver and Reimer1993; Reimer et al. Reference Reimer, Baillie, Baylis, Beck and Blackwell2009).
RESULTS
A total of 10 charcoal concentrates were dated for the HG-C and TP sections. Table 1 and Figure 2 list all measured and calibrated ages from the charcoal concentrates. The ages were expressed in years before present (BP) where “present” was defined as AD 1950. In the HG-C section, the sample HG-01 (19.7 m deep) was collected from the mud layer at the bottom, which yields an age of 26,670–26,285 cal BP. Above the silt layer, two layers of loess about 1.2 m thick were deposited, which were separated by a layer of sand (about 1.3 m thick). No sample was collected for AMS14C dating from those layers. Sample HG-02 (14.5 m deep) was collected from the mud layer, which yields an age of 24,480–24,180 cal BP. Above this mud layer, there is a thin loess layer of ~0.5 m thickness. Above this thin loess layer, a loose sand layer was deposited. The age at the bottom (11.6 m deep) and on the top (10.4 m deep) of the mud layer above the sand layer was 23,830–23,505 cal BP and 22,360–22,110 cal BP, respectively. The uppermost mud layer is about 2.2 m thick. Its top and bottom age was 16,860–16,690 cal BP and 21,020–20,715 cal BP, respectively.
Table 1 Radiocarbon ages of the HG-C and TP sections.

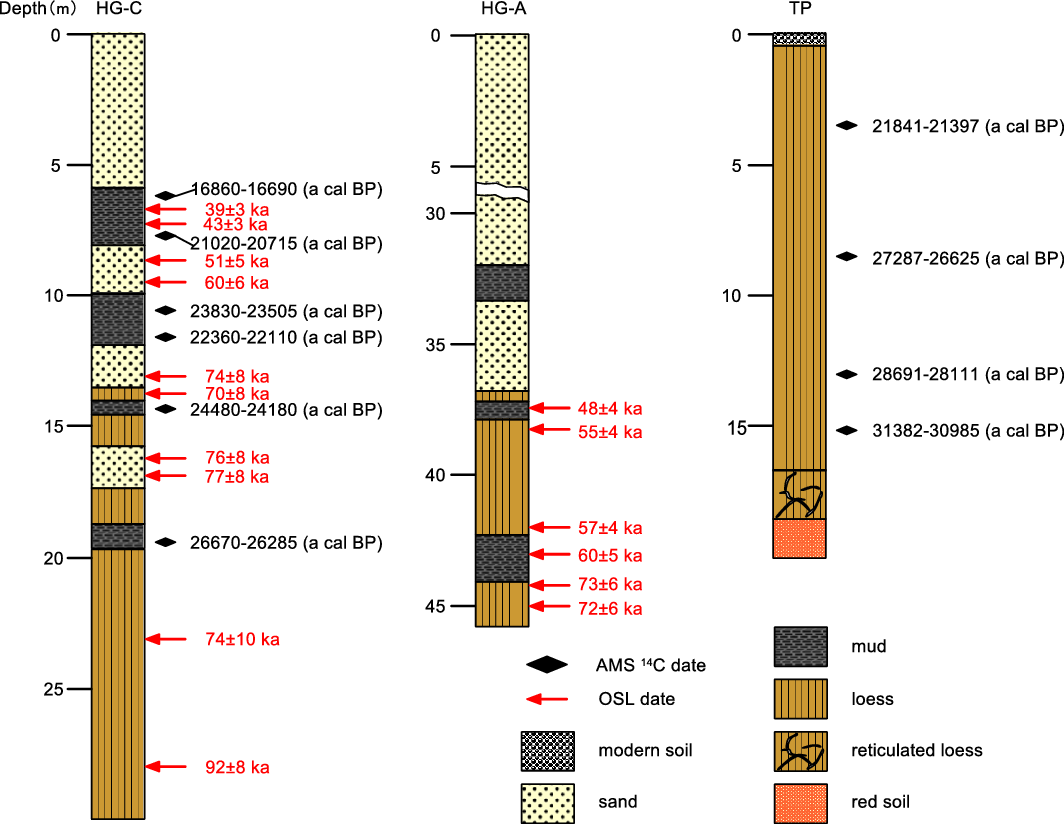
Figure 2 Lithology and ages of the HG-C, HG-A and TP section. The OSL ages of HG-A and HG-C are from Lai et al. (Reference Lai, Zhang and Chen2010) and Jia et al. (Reference Jia, Lai, Zhang, Peng, Zhang and Zhang2012), respectively.
For the TP section, this was formed in the leeward of the Hongguang sand hill. Samples TP-01, TP-02, TP-03, and TP-04 yield ages of 31,382–30,985 cal BP, 28,691–28,111 cal BP, 27,287–26,625 cal BP and 21,841–21,397 cal BP, respectively (Figure 2). The 14C ages are well ordered from the bottom to the top except for HG-04.
DISCUSSION
Age of Sand Hills in the Jiujiang Area
Up to now, a large dataset of ages has been obtained for the sand hills in the YRB. However, the results obtained by different methods are quite different. Yang (Reference Yang1985) obtained some 14C ages of buried timbers, at the bottom of the Hukou sand hill in the south Yangtze River floodway (Figure 1b). Yang (Reference Yang1985) suggested that the aeolian sand deposits started from 31,218–30,836 cal BP. The TL and bulk organic-based 14C ages from several sections between the Hukou and Hongguang sand hills along the south bank of the Yangtze River indicated that the formation of sand hills can be classified into two stages: (1) before 55 ka, and (2) after 25 ka, which correspond to MIS4 and MIS2, respectively (Liu et al. Reference Liu, Wu, Li and Zhang1997; Wu et al. Reference Wu, Yang and Wang2000). An OSL dating study carried out by Jia et al. (Reference Jia, Lai, Zhang, Peng, Zhang and Zhang2012), who examined the HG-C and HG-D sections in the Hongguang sand hill and proposed that aeolian sand activities occurred during 85–80 ka, corresponding to MIS5e. Extensive OSL dating in the Shalin sand hill, about 60 km southeast of the Hongguang sand hill and on the shore of the Poyang Lake was conducted and the results suggested that the aeolian sand deposition started before ~66 ka and ended at ~15 ka (Han et al. Reference Han, Li, Yi, Stevens, Chen, Wang and Lu2015). The sand layer at the bottom of the HG-C section is located between two mud layers, with ages of 26,670–26,285 cal BP and 24,480–24,180 cal BP, respectively. This result suggests that the aeolian sand deposition started at ~25 ka. The age of the mud layer on the top of the HG-C section is 20~16 ka, which is close to the bulk organic-based 14C age of the mud layer on the top of the Shalin and Songmen sand hills (18,553–17,635, 22,384–19,626, and 24,767–22,399 cal BP, respectively) (Figure 1) reported in earlier studies (Yang Reference Yang1985).
There is a significant difference between the OSL and AMS 14C dating results of sand hills in the YRB. For instance, our radiocarbon ages are significantly younger than the previously reported OSL ages by Jia et al. (Reference Jia, Lai, Zhang, Peng, Zhang and Zhang2012) of the same HG-C sand hill section (Figure 2). Although the OSL dating method is widely applied to various sediments (e.g. Lai et al. Reference Lai, Kaiser and Brückner2009; Stevens et al. Reference Stevens, Buylaert, Lu, Thiel, Murray, Frechen, Yi and Lin2016; Perić et al. Reference Perić, Lagerbäck Adolphi, Stevens, Gábor, Gavrilov, Zeeden, Buylaert, Schmidt, Schulte, Lu, Yi and Lehmkuhl2018; Xu et al. Reference Xu, Stevens, Yi, Mason and Lu2018), the reliability of their results should be assessed through multiple methods. Firstly, the luminescence characteristics, which can reflect bleaching situation of samples and potential luminescence contamination (Thomsen et al. Reference Thomsen, Murray and Bøtter-Jensen2005; Duller Reference Duller2008; Reimann et al. Reference Reimann, Thomsen, Jain, Murray and Frechen2012), should be analyzed in detail. The HG-C section, which consist of interbedded aeolian sand layers, lacustrine layers and loess layers, indicates complicated depositional environments (Liu et al. Reference Liu, Wu, Li and Zhang1997; Jia et al. Reference Jia, Lai, Zhang, Peng, Zhang and Zhang2012). Jia et al. (Reference Jia, Lai, Zhang, Peng, Zhang and Zhang2012) applied the same method to measure those samples with large differences in depositional environments. Unfortunately, the luminescence characteristics of those samples were not assessed in detail. For instance, the material of lacustrine layers was mainly derived from local sand land and deposited rapidly (Liu et al. Reference Liu, Wu, Li and Zhang1997; Zhuang et al. Reference Zhuang, Jia, Ma, Hu, Zhang and Wu2007). Those situations may constrain the bleaching degree by the time of deposition and the choice of grain size (Mauz et al. Reference Mauz, Baeteman, Bungenstock and Plater2010). In addition, the calculation of dose rate should seriously consider the uncertainties of the disequilibria in the uranium decay series, cosmic contribution and water content variation (Reimann et al. Reference Reimann, Tsukamoto, Naumann and Frechen2011; Long et al. Reference Long, Shen, Wang, Gao and Frechen2015; Sugisaki et al. Reference Sugisaki, Buylaert, Murray, Tada, Zheng, Wang, Saito, Chao, Li and Irino2015; Wang et al. Reference Wang, Long, Yi, Yang, Ye and Shen2015). When the dose rate of samples from HG-C section were calculated, the likelihood effects of those factors were not considered (Jia et al. Reference Jia, Lai, Zhang, Peng, Zhang and Zhang2012). For instance, the authors did not measure water content of dating samples but assumed the water content of each sample to be 10 ± 5% for dose rate calculations (Lai et al. Reference Lai, Zhang and Chen2010; Jia et al. Reference Jia, Lai, Zhang, Peng, Zhang and Zhang2012). In fact, the modern water content of sand layer, lacustrine layer and loess layer can various a lot with time (Han et al. Reference Han, Li, Yi, Stevens, Chen, Wang and Lu2015).
The robustness of OSL ages can to some extent be judged by their position in individual stratigraphic sequences in comparison. Lai et al. (Reference Lai, Zhang and Chen2010) reconstructed the chronological sequence of section HG-A (nearing the HG-C section with a thickness of ~45 m) in Hongguang sand hill using OSL dating (Figure 1b). Both sections exhibit similar lithological structure and are mainly divided into two units: sand layers and loess sequence (Figure 2). Lai et al. (Reference Lai, Zhang and Chen2010) obtained six OSL ages of the loess layer at the bottom of the sand layer. The results reveal that the loess was mainly developed at ~72–48 ka, which is much younger than ages of loess obtained by Jia et al. (Reference Jia, Lai, Zhang, Peng, Zhang and Zhang2012) (Figure 4). The work of Lai et al. (Reference Lai, Zhang and Chen2010) suggests that the deposition of aeolian sand should be later than ~48 ka if the results of ages are reliable, which is also extremely different from ages of the aeolian sand directly measured by Jia et al. (Reference Jia, Lai, Zhang, Peng, Zhang and Zhang2012). Hence, this comparison of OSL ages with individual stratigraphic sequence is, at least to some degree, powerful evidence illustrating the robustness of OSL chronology.
The AMS 14C dating of charcoals can yield reliable ages of sediments because these materials can avoid the hard-water effect (Pigati et al. Reference Pigati, McGeehin, Muhs and Bettis2013; Li et al. Reference Li, Li and Burr2014; Wang et al. Reference Wang, Zhao, Dong, Zhou, Liu and Zhang2014). Moreover, in order to date the original carbon, the younger materials (including lignin and humic acids) adhering to the charcoal particles have been removed carefully during sample preparation. Often, the 14C dates may be stratigraphically inverted due to the occasional introduction of reworked organic carbon (Zhou et al. Reference Zhou, Donahue and Jull1997; Zogning et al. Reference Zogning, Giresse, Maley and Gadel1997; Li et al. Reference Li, Wang, Li, Zhang and Zhou2012). Altogether, as revealed by the chronological data of the two sections obtained in this study, the 14C ages are not inverted from the bottom to the top, except for HG-3 and HG-4 of the HG-C section (Figure 2). This indicates that the sediments of the HG-C and the TP sections did not undergo significant reworking after the deposition. In addition, the charcoals in the sand hills may be transported from older deposits (Eckmeier et al. Reference Eckmeier, Klaas, Tegtmeier, Schmidt and Gerlach2009; Li et al. Reference Li, Wang, Li, Zhang and Zhou2012; Gao et al. Reference Gao, Long, Sheng, Yu and Yin2015), so the age of the charcoal cannot represent the deposit age of the sand hill. If the charcoal has been transported, the AMS 14C chronological sequence will generally be inconsistent with the stratigraphical order. However, the AMS 14C ages in HG-C and TP section are in order and consistently older with depth. Moreover, our ages are slightly younger than the bulk organic-based 14C ages obtained earlier in sand hills (Figure 3). Above all, we suggest that the sand hills in the YRB are mainly developed in MIS2.
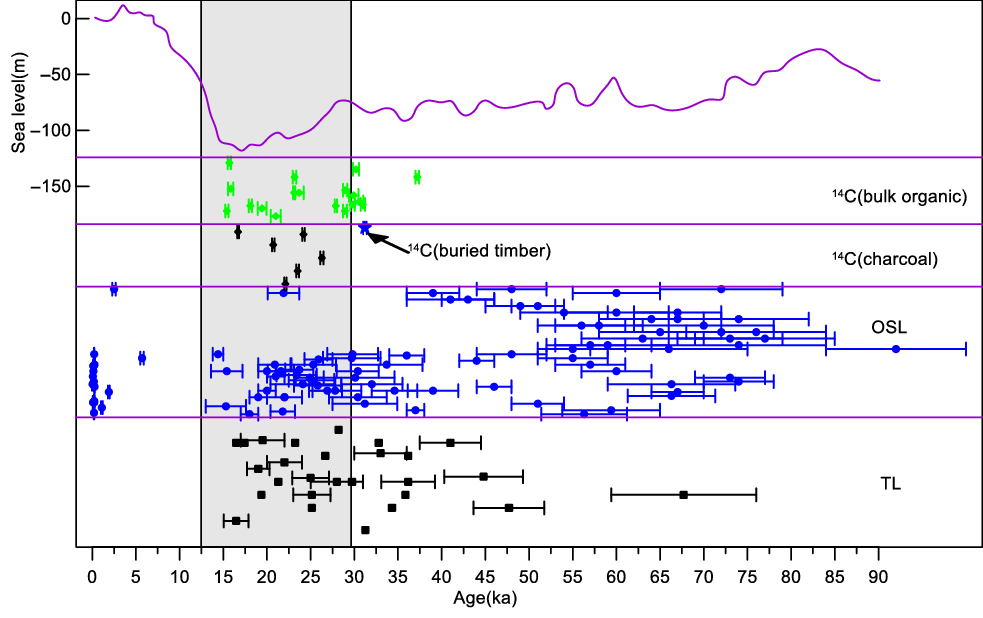
Figure 3 Timing of aeolian deposits in sand hills in the middle reaches of the Yangtze River and comparison with global sea-level changes (Dansgaard et al. Reference Dansgaard, Johnsen, Clausen, Dahl-Jensen, Gundestrup, Hammer, Hvidbeg, Steffensen, Sveinbjornsdottir, Jouzel and Bond1993). Vertical band highlights the MIS 2.
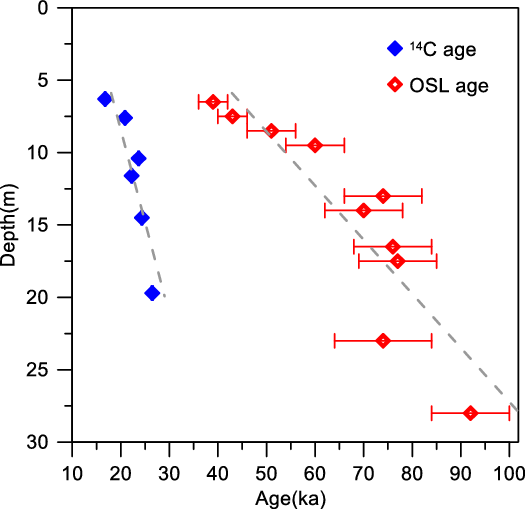
Figure 4 Comparison of luminescence and radiocarbon dating based chronological frameworks in HG-C section.
Developmental Model of the Aeolian Deposits in the YRB
Interpreting aeolian deposit records depends on accurately understanding the factors influencing the transport and spatial distribution of the deposits (Mason et al. Reference Mason, Nater, Zanner and Bell1999). Loess deposits are commonly known to be dominated by silt-sized (5–50 µm) particles (Liu Reference Liu1985; Muhs and Bettis Reference Muhs and Bettis2003). These are easily transported by wind because of finer grain composition than the dune sand. In the YRB, loess belts are proximal to sand hills (Figure 1b). Moreover, along the sand hill margin, aeolian sand is usually interbedded with loess. Those observations raise a question of whether or not the loess should be considered as a distinct sediment body or a fine-grained facies of eolian sand with a common source. To answer this question, it is necessary to pose another question firstly: are they deposited at the same age and derived from the same source? The TP section is located ~11 km south of the Pengze sand hill, and the age of the upper part at 8.50 m and 3.52 m is 27,287–26,625 cal BP and 21,841–21,397 cal BP, respectively, which is consistent with the age of the sand hill (Figure 2). This suggests that they were all deposited during MIS2.
Because the sand-sized particles are coarse, they might be deposited close to the source. The aeolian sand from the sand hills is dominated by medium and coarse-sized particles (Liu et al. Reference Liu, Wu, Li and Zhang1997; Jia et al. Reference Jia, Lai, Zhang, Peng, Zhang and Zhang2012). Mineralogical, geochemical, and geomorphological data show that the sand of the sand hill is derived from proximal flooded areas (Jia et al. Reference Jia, Lai, Zhang, Peng, Zhang and Zhang2012; Han et al. Reference Han, Li, Yi, Stevens, Chen, Wang and Lu2015). Qiao et al. (Reference Qiao, Hao, Peng, Wang, Li and Liu2011) and Jia et al. (Reference Jia, Lai, Zhang, Peng, Zhang and Zhang2012) analyzed the geochemical data of a typical Xiashu loess section in the YRB. Their results showed that the Xiashu loess and the loess in the Chinese Loess Plateau show considerably different geochemical composition. A large dataset of zircon ages showed that the Xiashu loess and the aeolian sediments of the YRB are considerably similar in the zircon U-Pb age spectra (Liu et al. Reference Liu, Li and Chen2014; Qian et al. Reference Qian, Zheng, Chen, Han, Dong and Zhang2018). Moreover, the grain-size feature of sand, sandy silt, and loess in the HG-C section were discussed by Jia et al. (Reference Jia, Lai, Zhang, Peng, Zhang and Zhang2012) in detail. As shown in Figure 5a, b, from the sand to sandy silt, then to loess deposits, the grain-size composition shows a sequential shift in the ternary diagram. Hu et al. (Reference Hu, Jia, Zhang, Peng, Ling and Wang2013) analyzed the grain-size distribution of five Xiashu loess sections along the D-D transect located at the downwind of the Hongguang sand hill (Figure 1). They found that the mean grain size of the Xiashu loess decreases as the distance from the Yangtze River channel increases. Although only five sections were studied, their results suggested a series of responses to the shift of the spatial pattern of wind activities (Figure 5c). The evidence above indicated that the Xiashu loess in the YRB has the same provenance as the sand hills. Apparently, the source should be the floodplain of the Yangtze River in the upward of the winter wind (Jia et al. Reference Jia, Lai, Zhang, Peng, Zhang and Zhang2012). Therefore, we conclude that the Xiashu loess is essentially a fine-grained facies of aeolian sand with a common source. The sand hills and the Xiashu loess represent the coarse-grained end member and the fine-grained end member of the aeolian deposit unit in the YRB along the dominant wind direction.

Figure 5 (a) Ternary diagram showing the content of clay, silt, and sand of samples from the HG-C section. (b) Grain-size distributions for typical samples from the HG-C section. (c) Mean grain size and sorting coefficient of loess as a function of distance from the south of Yangtze River along the D-D transect. Data in (a) and (b) are from Jia et al. (Reference Jia, Lai, Zhang, Peng, Zhang and Zhang2012) and data in (c) are from Hu et al. (Reference Hu, Jia, Zhang, Peng, Ling and Wang2013).
Dense vegetation and topographical obstacles play an important role in the distribution of aeolian deposits. Pye (Reference Pye1995) and Muhs and Bettis (Reference Muhs and Bettis2003) proposed several models of aeolian sediment downwind from a source. The simplest model is that there are many loess bodies in areas adjacent to the continental-scale ice sheets. In the other two models, loess is shown as a finer, downwind facies of aeolian sand, either with an intervening zone of sediment bypassing or as part of a zone of continuous deposition with a gradual fining downwind. In the last case, loess occurs downwind of the aeolian sand, but the two types of sediments have different sources and possibly even different times of deposition (Muhs and Bettis Reference Muhs and Bettis2003). The situation of the aeolian deposit unit in the YRB is in accord with that shown by Muhs and Bettis (Reference Muhs and Bettis2003). In this case, vegetation plays an important role in the distribution of the aeolian deposits. Li et al. (Reference Li, Wu, Yu, Sun and Luo2019) presented a quantitative regional vegetation reconstruction for southeastern China based on pollen records. The results demonstrated that steppe expanded into the middle reaches of the YRB during MIS2. Therefore, vegetation cover is sufficient over much of the region to trap the particles continuously in the downwind direction, with a gradual downwind fining as large particles deposit.
Local topography is an important factor controlling the distribution of aeolian deposits (Mason et al. Reference Mason, Nater, Zanner and Bell1999). In the YRB, the south side of it is a series of low hills, about 100m above the surface of the Yangtze River (Figure 1). The coarser silt and sand particles, which have higher settling velocities and are transported mainly in short-term suspension, remain concentrated in the near-surface layer of the atmosphere (Tsoar and Pye Reference Tsoar and Pye1987). Therefore, the conditions of landforms in this area became a “topographic trap” of aeolian sand. Affected by these hilly terrains, the detrital materials derived from the Yangtze River Valley were confined to these areas after having been transported by the wind. This is an important reason for the location of the sand hills here close to the south (with a range about 2 km) of the Yangtze River (Figure 1). With a smaller grain size, the silt particles can be transported higher and farther to the downwind direction of the sand hills. The southern part of the sand hills in the Jiujiang area is a low hilly region. This terrain condition, together with vegetation cover, can capture the silt particles, thereby forming loess deposits. In this case, the loess distribution reflects regional vegetation cover and local topography, which control the transport of sand from aeolian sediments source and the distributions of thick loess (Figure 6).
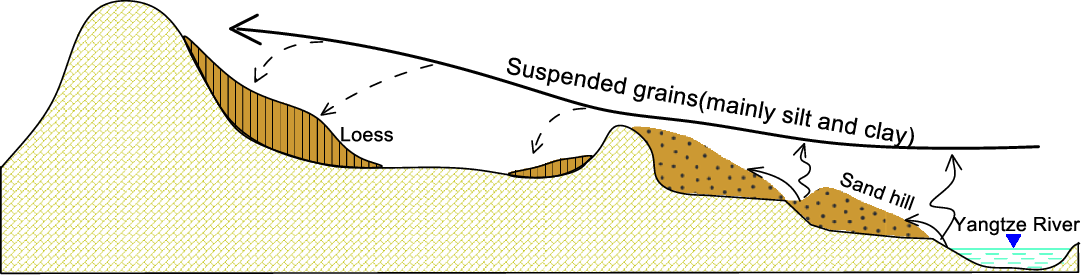
Figure 6 Model of aeolian deposit units.
CONCLUSIONS
Sand hills and loess are the two typical aeolian deposits in the YRB, which provide direct evidence for climate change in a subtropical region of China. At longer time scales, the ages obtained using different dating methods are controversial, leading to a long-standing debate regarding the history of regional aeolian activity. Our new AMS 14C results suggest that the sand hills in the YRB are mainly formed since ~25 ka BP, roughly corresponding to MIS2. At the same time, the prevalent cold climate enabled the deposition of a thick layer of loess in the downwind direction of the sand hills. The enhanced aeolian activities suggest that the climate in the YRB deteriorated substantially during the Last Glacial Maximum. The exposed detrital materials in the YRB were transported by the enhanced wind during the prolonged winter months. The coarse-grained materials were first accumulated to form sand hills, and the fine-grained materials were transported to the downwind of the sand hills to form loess. Sand hill and loess are considered to represent the two sedimentary end members of regional aeolian deposits. In this case, the topographic obstacles and dense vegetation played a role equally important in the distribution of aeolian deposits in this area.
ACKNOWLEDGMENTS
This study is supported by the National Natural Science Foundation of China (grant no. 41262007), the Collaborative Innovation Center for Major Ecological Security Issues of Jiangxi Province and Monitoring Implementation (grant no. JXS-EW-00), the Innovation Fund Designated for Graduate Students of Jiangxi Normal University (grant no. YJS2018069), the Foundation of Jiangxi Educational Committee (grant no. 8884), and the Opening Fund of Key Laboratory of Poyang Lake Wetland and Watershed Research, Ministry of Education (grant no. PK2018004).


