INTRODUCTION
Measurement of all three isotopes of carbon 12C, 13C, and 14C post acceleration is possible with newer compact radiocarbon AMS instruments, allowing for online measurement of δ13C for isotopic fractionation corrections. However, it is also known that the beam transmission of 12C through the accelerator is suppressed at higher beam currents. This effect varies depending on the instrument design. For low beam currents in the range of 30–50 μA, the online δ13C values were in good agreement with the consensus values of standards on MICADAS and HVEE tandetron instruments (Synal et al. Reference Synal, Stocker and Suter2007; Bard et al. Reference Bard, Tuna, Fagault, Bonvalot, Wacker, Fahrni and Synal2015; Calvo et al. Reference Calvo, Santos, Lopez-Gutierrez, Padilla, Garcia-Leon, Heinemeier, Schnabel and Scognamiglio2015). Since the ion sources of all the new AMS systems can produce 12C beam currents in excess of 100 μA, it is worth exploring the ranges of beam currents for each type of AMS instrument over which the online δ13C values are accurate and precise for isotopic fractionation correction of pMC data.
In an earlier article (Prasad et al. Reference Prasad, Culp and Cherkinsky2019), we discussed the stable isotope ratios from 500 kV CAMS and 250 kV SSAMS. We find that IRMS δ13C values consistently resulted in accurate pMC values for high beam currents in the range of 60–100 μA (Prasad et al. Reference Prasad, Noakes, Cherkinsky, Culp and Dvoracek2013, Reference Prasad, Cherkinsky, Culp and Dvoracek2015). It may be worth noting that in all these cases, the beam currents of standards and samples of a given sample group are in the same range. As for online δ13C values (from AMS), we find that for CAMS they closely agreed with the offline values (from IRMS). The pMC data of standards using consensus δ13C values also found to be more precise than the data using online δ13C correction. This difference however was very small for CAMS data.
Online δ13C estimation for SSAMS is a challenge as realized by many research groups (Skog Reference Skog2007; Freeman et al. Reference Freeman, Dougans, McHargue, Wilcken and Xu2008; Prasad et al. Reference Prasad, Noakes, Cherkinsky, Culp and Dvoracek2013; Linares et al. Reference Linares, Macario, Santos, Carvalho, dos Santos, Gomes, Castro, Oliveira and Alves2015). Due to 12C beam transmission suppression, the AMS δ13C values are found to be acceptable only at much lower beam currents than what the ion-source is capable of. It was also observed that IRMS δ13C values for pMC calculation worked well for high beam currents (Freeman et al. Reference Freeman, Cook, Dougans, Naysmith, Wilcken and Xu2010). The SUREC AMS facility discontinued routine injection of 12C– and found no evidence for random fractionation even at high beam currents. Skog et al. (Reference Skog, Rundgren and Skold2010) reproduced δ13C values by fitting the 13C/12C ratios to a quadratic where the measurements were performed using beam currents <30 μA. Linares et al. (Reference Linares, Macario, Santos, Carvalho, dos Santos, Gomes, Castro, Oliveira and Alves2015) also chose to limit the currents to 30 μA to be able to use online δ13C for pMC calculation. At CAIS SSAMS, higher beam currents of about 40–60 μA were used for measurements during the first few months after installation, for which the δ13C data of a few dozens of samples was compared to the IRMS data (Prasad et al. Reference Prasad, Noakes, Cherkinsky, Culp and Dvoracek2013). The 1-σ deviation from IRMS data of these samples was about 4‰. Currently, higher beam currents in the range of 70–100 μA are being used for routine analyses. In this article, we provide more recent SSAMS stable isotope data with the objective of improving online δ13C calculation.
RESULTS AND DISCUSSION
Beam Transmission of 12C and 13C
Higher transmission loss of 12C relative to 13C can result in wrong values of δ13C at high beam currents, and wrong pMC values if used in the calculation. The threshold for 12C beam saturation is observed around 80–85 μA for SSAMS and varies somewhat from one sample wheel to another sample wheel due to changes in beam parameters. But no such saturation was observed even for 110 μA on the CAMS unit. The CAMS data of AMS derived δ13C values was in very good agreement with IRMS δ13C values except for a small fraction of samples (Prasad et al. Reference Prasad, Culp and Cherkinsky2019). The histogram of differences produced a sharp gaussian curve with a 1-σ deviation of about 1.5‰ and is acceptable for online δ13C correction. SSAMS online δ13C data, however, is not suitable for correcting pMC data and needs huge improvement both in accuracy and precision. Towards that objective, data collected over a five-month period was chosen for this study.
The 12C– beam currents injected into the accelerator are typically in the range of 70–90 μA for all samples and standards on SSAMS. OXII is the primary standard and IAEA-C6 (ANU-sucrose) serves as the secondary standard. Each typical sample group consists of two OXIIs, two C6es, one processed blank, and nearly 20 unknowns. Each run corresponds to 180 sec of 14C measurement and typically 9–10 runs are performed per sample. During this study, we realized that the beam currents of C6 are in general greater than those of OXII by nearly 10–15% mainly because of larger sample size. Due to higher beam currents, C6 samples sometimes resulted in beam saturation whereas OXII data is almost free of beam saturation as seen in Figure 1(a). In the figure, each data point corresponds to a single run. Most OXII data points are clustered in the 12C– range of 70–80 μA. C6 data points are clustered in the range 75–90 μA and the slope of the band clearly changed towards saturation above 80 μA. The data points are seen all the way down to 40 μA because of sample consumption. Even though these data points for <70 μA are sparse, they very clearly prove that linearity between 12C+ and 12C– extends from 40 μA upto ∼70 μA or more. For beam currents under 80 μA, OXII and C6 data completely overlapped suggesting that the linearity can even hold for other samples. In Figure 1(b), 13C+/12C– for C6 was plotted for comparison. The 13C+ current increases linearly with the 12C– current and does not exhibit saturation. From Figure 1, it is clear that 13C+/12C– ratio is a better choice for δ13C calculation than 13C+/12C+ ratio, as previously suggested (Prasad et al. Reference Prasad, Culp and Cherkinsky2019).
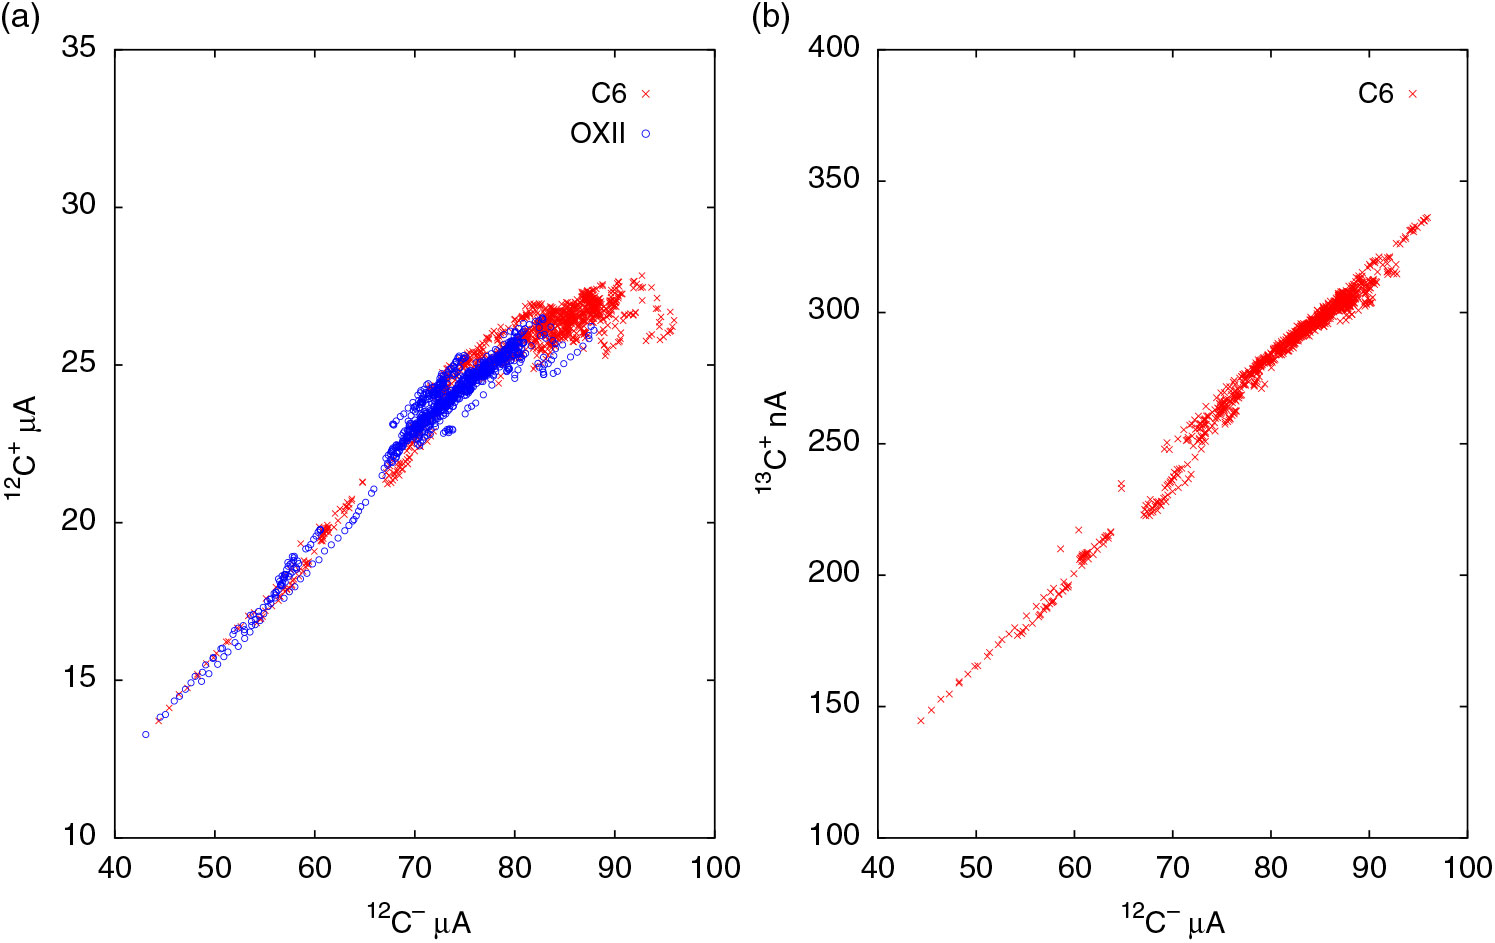
Figure 1 (a) Post acceleration 12C+ vs. pre-acceleration 12C– for OXII and C6 standards. Data points correspond to individual runs, with errors smaller than the size of the points. Beam saturation of 12C+ may be seen above 80 μA. (b) In contrast the 13C+ vs. 12C– plot is linear. Only C6 data is plotted for clarity.
From Figure 1, the linearity between 12C+ vs. 12C– extends to higher beam currents (∼70 μA) than observed by Skog (Reference Skog2007) and Linares et al. (Reference Linares, Macario, Santos, Carvalho, dos Santos, Gomes, Castro, Oliveira and Alves2015). While it is true that there are fewer points in this range, the linear relationship is clear. One reason for this discrepancy could be the argon gas stripper pressure. We reduced the argon flow rate to 0.9 sccm from the original factory setting of 1.1 sccm. This change improved the beam transmission by about 15% from about 28% to 32% for an injection current of 80 μA. Reduced gas pressure slightly elevated the background, yet we still routinely obtain the values in the range of 51 ka–54 ka. The reduction in argon pressure likely reduced the space charge effect and extended the range of beam currents over which the transmission remained linear.
Comparison of Online δ13C (AMS) and Offline δ13C (IRMS) Values
NEC’s ABC package is used for data reduction at CAIS for both AMS units. The package uses consensus δ13C values for standards by default and the pMC data consistently agreed with the nominal values. Since the consensus δ13C values are based on IRMS measurements external to AMS, the validity of offline correction can be extended to unknowns as well, a fact well known to many AMS labs. As for the online δ13C correction, it works well for CAMS, but for SSAMS, the observed saturation of 12C+ clearly rules out the possibility of online δ13C correction using 13C+/12C+ ratio. However, using 13C+/12C– ratio can substantially improve the δ13C estimation.
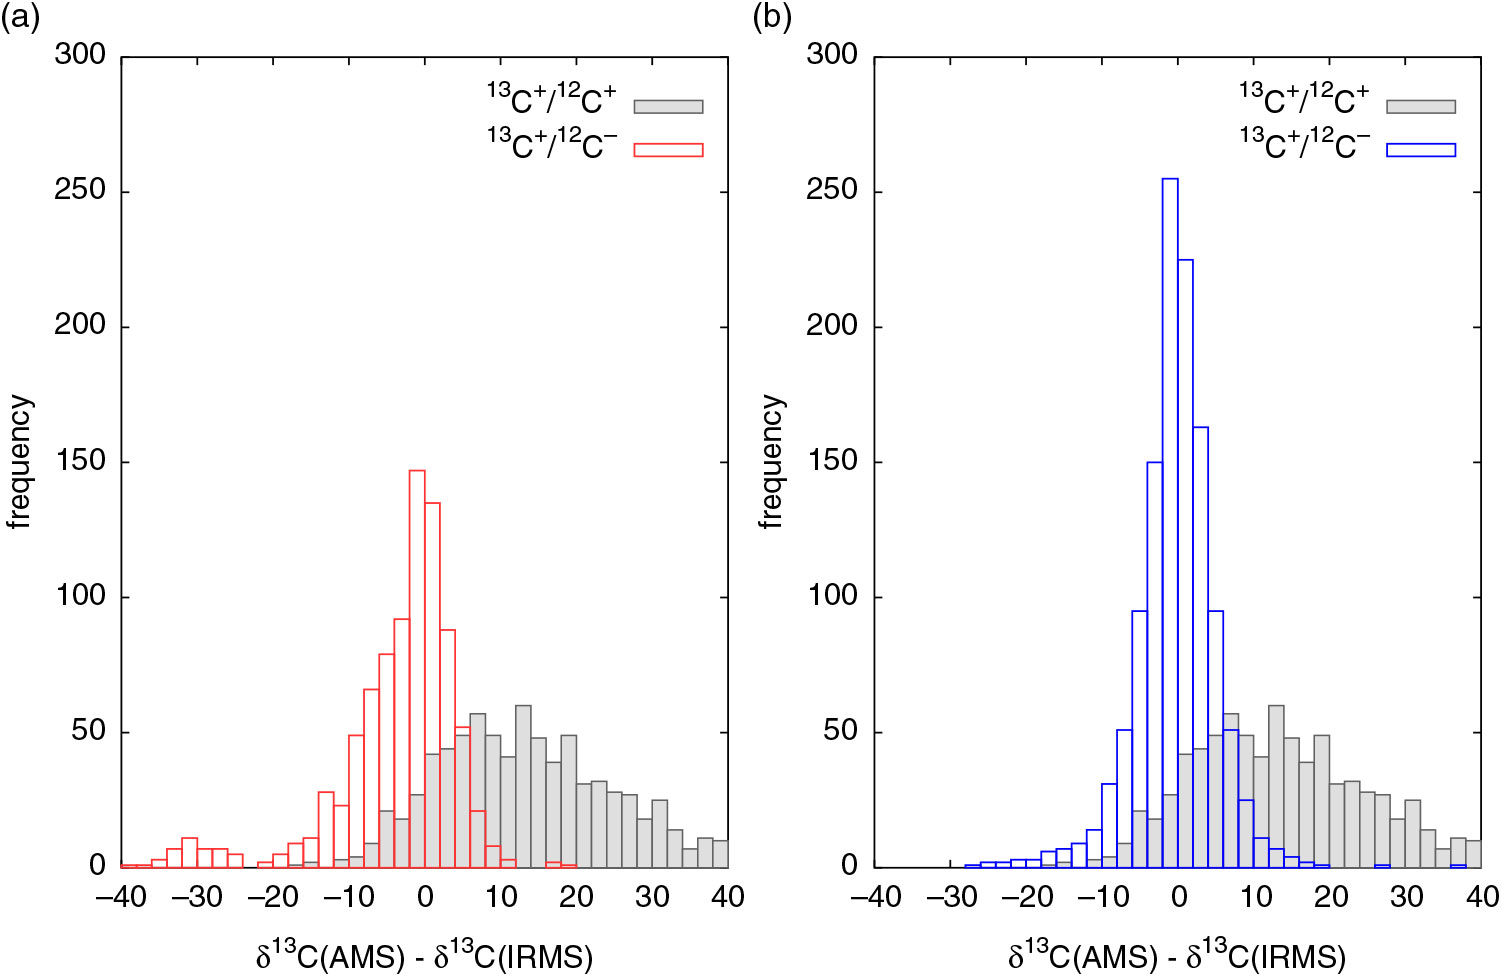
In Figure 2, over 1000 unknowns measured over a five-month period were used for comparison of online and offline δ13C data. The difference between the values are plotted as histograms. Ideally, the online δ13C data is expected to match the offline (IRMS) data and the histogram of differences should be a sharp gaussian distribution centered around zero. The plotted histogram using 13C+/12C+ ratios is spread out wide with a mean difference close to 15, which means the online δ13C values shifted more positive by about 15‰ on the average. This is a consequence of 12C+ deficit relative to 13C of the samples with respect to the normalizing standard OXII. Since we have observed that 13C+/12C– ratio shows no saturation, we have also calculated δ13C using these ratios and the histogram shows substantial improvement in the shape of the distribution as seen in Figure 2(a).

Figure 2 Difference between AMS and IRMS δ13C values plotted as histograms. (a) 13C+/12C– ratio results in better δ13C than 13C+/12C+ ratio. (b) 13C+/12C– ratio corrected for 13C+ transmission reduction results in a symmetric curve and closest agreement with IRMS values.
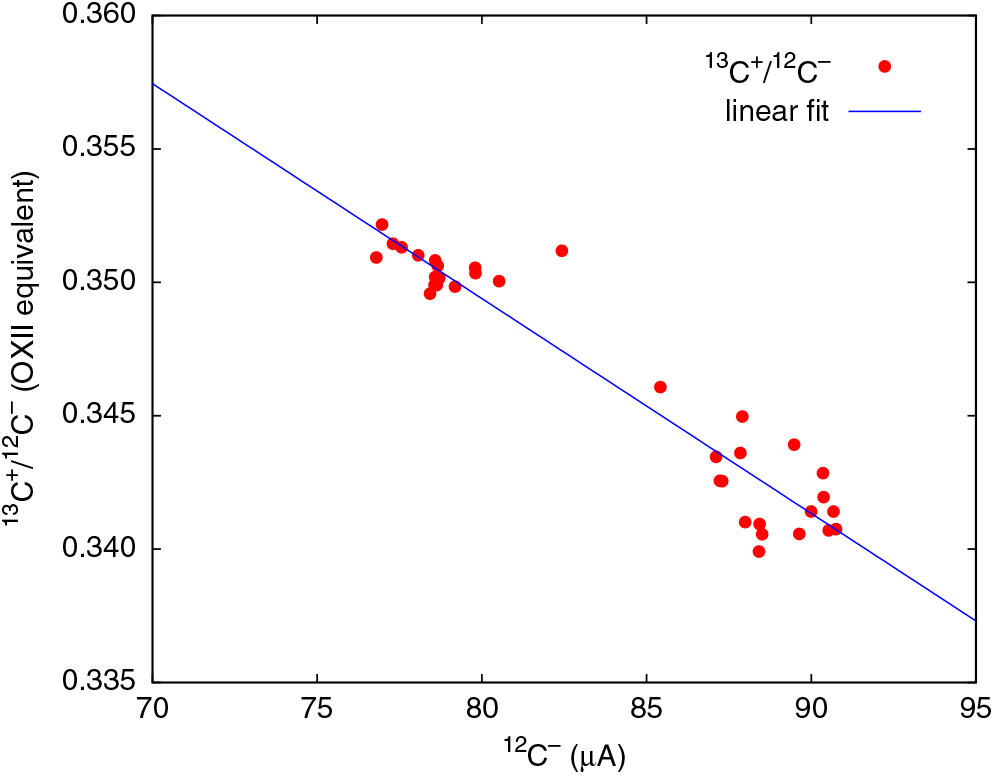
The distribution peaks at zero but is still not symmetric. For positive differences, the curve falls of rapidly and is sharper, but falls off slowly for negative differences and spreads out to high negative values. The long tail on the negative side implies that the online δ13C values are more negative than they should be. This could be a result of a reduction in 13C+ of the sample relative to the normalizing OXII when 13C+/12C– ratios are used for calculation. On analyzing the raw data, we have found that even the 13C+ beam current experiences some reduction in transmission. To correct for this loss, we need to improve the normalization procedure for δ13C calculation. For a given 13C+/12C– ratio of a sample, we need to use the 13C+/12C– ratio of the standard (OXII) corresponding to the same 12C– beam current. This can be accomplished by obtaining a regression relation for 13C+/12C– ratio of OXII over the entire range of beam currents needed for the sample group. But because OXII currents in a sample group are only limited to a portion of the range, for an accurate regression relation, we need another standard with beam currents spanning over a different range. Since C6 produced higher currents than OXII, its 13C+/12C– ratio can be used but needs to be suitably scaled to match the ratio for OXII. From the δ13C values of C6 (–10.8‰) and OXII (–17.8‰), the stable isotope ratio of C6 is 1.007 times that of OXII. With more data points contributing to the regression line, 13C+ transmission can be calculated more accurately as shown in Figure 3. If there is no transmission loss, 13C+/12C– ratio should remain the same over the chosen range of 12C– currents, but Figure 3 clearly proves that 13C+ current indeed undergoes steady loss of transmission. The same regression method was applied to every sample group to obtain a linear equation for calculation of 13C+/12C– to normalize the sample data. The resulting histogram is a symmetric gaussian centered around zero, a remarkable improvement as seen in Figure 2(b). The standard deviation of the distribution is close to 2.5‰, which seemed impossible to achieve prior to undertaking this analysis when 13C+/12C+ ratios alone were used for calculation.

Figure 3 13C+ transmission decreases with beam current. The data points correspond to a single sample group with two OXII and two C6 samples. Data for <85 μA correspond to OXII. Data points for >85 μA correspond to C6 but scaled to match the 13C+/12C– ratio of OXII.
The calculation procedure is summarized here. We may recall the equation for δ13C when the standard is other than VPDB:
 $${\delta ^{13}}{{\rm{C}}_{unk}} = \left( {{{{r_{unk}}} \over {{r_{std}}}} - 1} \right) \times 1000 + \left( {{{{r_{unk}}} \over {{r_{std}}}} \times {\delta ^{13}}{{\rm{C}}_{std}}} \right)$$
where runk and rstd are 13C/12C ratios of the unknown (sample) and standard, respectively. The method requires development of a computer code to carry out the following calculations.
1. Calculate 13C+/12C– ratios of the standard and sample (results shown in Figure 2a).
2. Correcting for 13C+ transmission variation leads to further improvement. Linear fit the 13C+/12C– data of primary standards (OXII) as a function of 12C– beam current (Figure 3). For improved accuracy, data of secondary standards (IAEA-C6 in this case) with known δ13C values can also be included in the fit calculation after properly scaling the 13C+/12C– ratio to match that of the primary standard.
3. (13C+/12C–)unk along with (13C+/12C–)std obtained from the regression relation for the same value of (12C–)unk current to be used for δ13C calculation (results shown in Figure 2b).
14C/13C Ratios
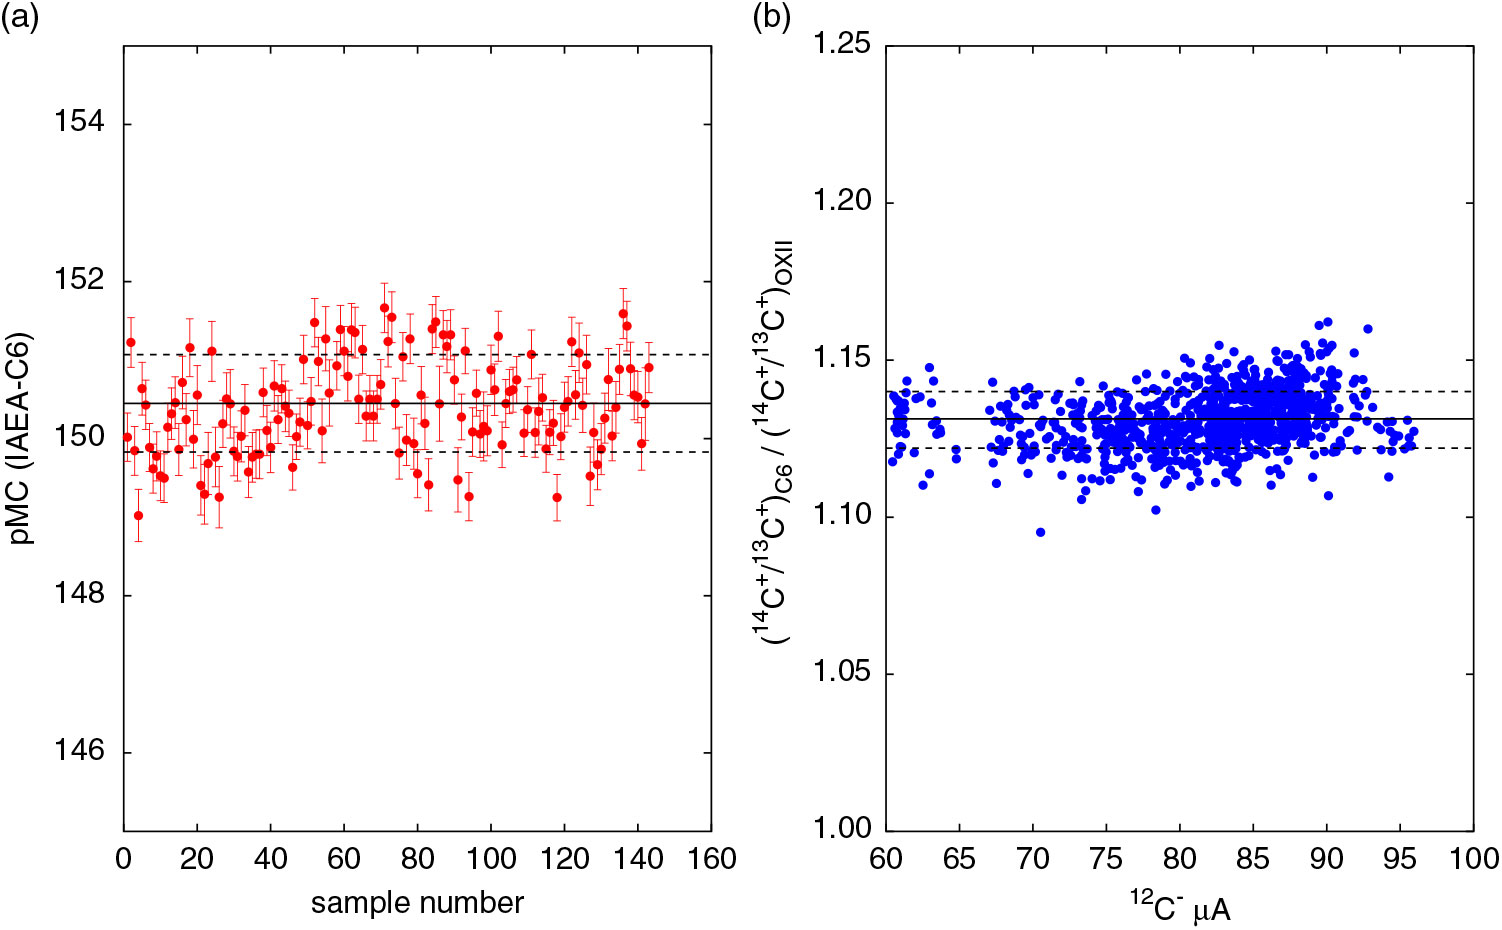
The data of Figure 3 poses a critical question: how does the decrease in 13C+ beam transmission affect the 14C+/13C+ ratios? Since the pMC data of standards using 14C+/13C+ ratios agree with the nominal values, to be consistent, even 14C+ must undergo a proportional reduction in yield at higher currents. At this point, this is only an assumption because so far, our analysis only focused on stable isotope data. Impact of 13C transmission change on pMC data needs investigation. A quick look at the 14C data of C6 however is presented in Figure 4. The pMC data of C6 are plotted in Figure 4(a), and the mean value agrees well with the nominal value of 150.6 within the measurement precision. In Figure 4(b), the normalized ratio (14C+/13C+)C6 / (14C+/ 13C+)OXII as a function of 12C– agrees well with the expected value of 1.13 which can be calculated from the nominal pMC and δ13C values of C6 and OXII. Though the data does not conclusively prove that 14C+ throughput decreases, it certainly proves that the pMC values using the 14C+/13C+ ratios were not affected due to transmission loss over the range of beam currents produced.

Figure 4 (a) pMC data of C6 calculated using δ13C = –10.8‰. The mean value 150.45 ± 0.62 of the data shown as a solid line agrees well with the nominal value of 150.6. Dashed lines show 1σ deviation from the mean value. (b) 14C+/13C+ ratio of C6 normalized to the OXII ratio does not change with the beam current. The data points correspond to individual runs, and the error bars of each point are smaller than the size of the points. The data is in exact agreement with the expected value of 1.13. Dashed lines show 1σ deviation from the mean value.
CONCLUSIONS
The beam transmission of the stable isotopes decreases with increase in beam current. In the case of 12C, beyond a certain value, post acceleration 12C beam current is found to saturate. Consequently, online δ13C estimates result in wrong pMC values. This effect is very much machine dependent and SSAMS machines are very susceptible to beam saturation.
We have provided a method to improve the δ13C values from AMS measurements for moderately high beam currents in the range of 70–90 μA for SSAMS. Two changes to online δ13C calculation resulted in great improvement to its accuracy and precision: (1) recognizing 12C– as a reliable indicator instead of 12C+ for 13C/12C ratio calculation; (2) normalizing the 13C+/12C– ratio of a sample to the corresponding ratio of the standard evaluated for the same 12C–. This improvement is significant since some SSAMS labs have either done away with online δ13C or limited the beam currents to very low values.
Since CAMS δ13C data agrees with the IRMS data while large deviations are observed in SSAMS data, it is interesting to know if this behavior is due to the low acceleration energy. It is in the interest of the radiocarbon community that online δ13C data over a wide range of beam currents from all types of AMS instruments are reported to better understand the pros and cons of online correction.