INTRODUCTION
The accelerator mass spectrometry (AMS) facility at the University of Cologne, CologneAMS, is based on a 6 MV Tandetron AMS from High Voltage Engineering Europe B.V. (HVE, The Netherlands), which was funded by the German Research Foundation (DFG) and installed at the Institute of Nuclear Physics in 2010. The AMS facility is devoted to the analysis of various cosmogenic nuclides (Dewald et al. Reference Dewald, Heinze, Jolie, Zilges, Dunai, Rethemeyer, Melles, Staubwasser, Kuczewski and Richter2013) and is run collaboratively by the Institute of Geology and Mineralogy being responsible for sample preparation and the Institute of Nuclear Physics performing the AMS analyses. About 30% of all measurements performed since 2011 are radiocarbon (14C) analyses. The laboratory performs dating service for external users from various fields including geosciences, environmental sciences, soil science, and archaeology as well as own research and methodical developments with special foci on the analysis of small samples including 14C analysis of individual lipid biomarkers and of CO2 samples.
The radiocarbon laboratory is equipped with the automated graphitization equipment system AGE-2 (Ionplus, Switzerland) and different vacuum lines for the processing of CO2 samples including purification of CO2 trapped on molecular sieve cartridges and a preparative capillary gas chromatography (pc-GC) system. Since 2015 the AMS group operates a second ion source (SO-110 B, HVE) that is coupled with the gas injection system (GIS) from Ionplus. Recently an elemental analyzer (EA3000, EuroVector, Italy) has been added to the GIS system, which is controlled by newly developed software (GICS, Stolz et al. Reference Stolz, Dewald, Heinze, Altenkirch, Hackenberg, Herb, Müller-Gatermann, Schiffer, Zitzer, Wotte, Rethemeyer and Dunai2019) for data acquisition and hardware control. Initial tests of 14C measurements performed with GIS-AMS (Stolz et al. Reference Stolz, Dewald, Altenkirch, Herb, Heinze, Schier, Feuerstein, Müller-Gatermann, Wotte, Rethemeyer and Dunai2017) and EA-GIS-AMS (Stolz et al. Reference Stolz, Dewald, Heinze, Altenkirch, Hackenberg, Herb, Müller-Gatermann, Schiffer, Zitzer, Wotte, Rethemeyer and Dunai2019) gave very promising results and were expanded by detailed test series to determine blank values and sample size limitations (Melchert et al. this issue for a detailed description). Since the establishment of the GIS, samples smaller than 200 µg C can now be directly measured as CO2 with our HVE 6 MV Tandetron AMS.
Five years after our first status report (Rethemeyer et al. Reference Rethemeyer, Fülöp, Höfle, Wacker, Heinze, Hajdas, Patt, König, Stapper and Dewald2013), we now summarize our analytical capabilities including the main modifications of the sample preparation procedures, and technical achievements since then. We also review the long-term stability of blanks and modern standards as well as different blank values for AMS analysis using the GIS and the EA-GIS coupling.
SAMPLE PREPARATION FACILITIES
Since 2011, the 14C laboratory at CologneAMS prepared a total of about 4700 unknown samples of which most samples were bulk sediments, bulk soil organic matter or soil fractions, plant macrofossils, and charcoal (Table 1). Since the development of stainless steel molecular sieve cartridges for sampling CO2 released from soils and sediments (Wotte et al. Reference Wotte, Wordell-Dietrich, Wacker, Don and Rethemeyer2017a) and optimization of handling techniques (Wotte et al. Reference Wotte, Wischhöfer, Wacker and Rethemeyer2017b), we processed an increasing number of CO2, mostly from research projects in the fields of soil science and permafrost research.
Table 1 Total number of samples per sample type prepared since 2011 in our laboratory.

Our present sample processing capabilities include different chemical pretreatment procedures required for 14C analysis of the different organic sample types and of carbonate samples. Prior to any chemical treatment, we inspect all samples under a binocular for contamination in order to select the most suitable material for dating.
Acid-Alkali-Acid Treatment (AAA) of Organic Samples
Most organic materials including sediments, charcoal, wood, and plant remains are chemically pretreated by an acid-alkali-acid (AAA) extraction to remove inorganic carbon and humic substances that may be introduced during post-depositional processes. Briefly, samples are treated with 1% HCl (1 hr, 60°C followed by ca. 10 hr, room temp.) in pre-combusted (450°C, 4 hr) centrifuge glasses followed by repeated washes of the residue with Milli-Q water (Millipore, USA) and extraction with 1% NaOH (4 hr, 60°C) yielding an alkali-soluble fraction and a non-soluble residue (humin). The humin fraction is then washed repeatedly with Milli-Q water, treated again with 1% HCl (ca. 10 hr, room temp.), rinsed with Milli-Q water, until a pH of 5 is achieved, and finally dried at 60°C. If samples dissolve completely in NaOH, i.e. have been transformed into soluble humic substances, we precipitate the humic acid fraction in the alkali solution using concentrated HCl. This fraction can give reliable ages for charcoal samples, because it is often composed of products of post-depositional diagenetic alteration in charcoal (Ascough et al. Reference Ascough, Bird, Meredith, Wood, Snape, Brock, Higham, Large and Apperley2010, Reference Ascough, Bird, Francis and Lebl2011), which are of similar age (Pessenda et al. Reference Pessenda, Gouveia and Aravena2001).
Acid Treatment (A) of Organic Samples
In some cases, we reduce the standard AAA extraction to an acid-only (A) extraction using 1% HCl (1 hr, 60°C followed by ca. 10 hr, room temp.). For carbonate-rich samples it may be the case to repeat this procedure with more concentrated HCl. The A-only extraction is frequently applied to very small or fragile plant fragments in order to avoid sample losses occurring mainly during the extraction with NaOH. In some cases A-only is also used for marine sediments (e.g. Hillenbrand et al. Reference Hillenbrand, Smith, Kuhn, Esper, Gersonde, Larter, Maher, Moreton, Shimmield and Korte2009). Another example is the preparation of soil organic matter in studies of organic carbon cycling in soils (except for dating paleosols). Here we apply only 0.5% HCl (1 hr, 60°C followed by 10 hr, room temp.) The objective is to retain fulvic and humic acids, which are essential components of the soil organic matter (Lehmann and Kleber Reference Lehmann and Kleber2015) in bulk soil samples or soil organic matter components/fractions.
Preparation of Dissolved Organic Carbon
For 14C analysis of dissolved organic carbon (DOC) in marine, lake or soil water, we first acidify the samples to pH 3–4 with HCl (if not done already in the field). The DOC samples are then freeze-dried and transferred into a tin capsule for EA-GIS-AMS analysis.
Collagen Extraction from Bones
Based on the results of a series of tests (Fülöp et al. Reference Fülöp, Heinze, John and Rethemeyer2013), we use the following extraction method for bone collagen. We included a prescreening of the collagen quality by determining the collagen yield and using elemental analysis. The whole bone should have >0.7% N and a C/N ratio of >4, the collagen content of the bone should be >1%, and the C/N ratio of collagen fraction between 2.6 and 3.9 (van Klinken Reference van Klinken1999; Brock et al. Reference Brock, Wood, Higham, Ditchfield, Bayliss and Ramsey2012). The extraction starts with the cleaning of a piece of bone (3–5 g) with Milli-Q water in an ultrasonic bath (2 × 15 min) and, if necessary, with a sequence of organic solvents including hexane, dichloromethane, and methanol using either Soxhlet or ultrasonic extraction depending on the consistence of the sample. The dried samples are decalcified with 1 M HCl (>3 hr, room temp.), humic substances are removed by adding Milli-Q water whereby the pH is increased to about 3 while the sample is placed in an agitating water bath (24 hr, 60°C). Samples are finally converted into gelatin by hot filtration (60°C) through glass fiber filters followed by freeze-drying. If the collagen quality indicators of the bone or its collagen fraction are not in the typical ranges indicating contamination derived from soil/sediment components (e.g. humic and fulvic acids, proteins, nitrates) or from the degradation of the collagen fraction, we apply ultrafiltration of the collagen fraction. The separation of the larger collagen peptides from possible smaller contaminants (e.g. humic and fulvic acids) is achieved with Sartorius Vivaspin® 15 ultra-filters, with a molecular cutoff value of 30 kDa. The ultra-filters are cleaned prior to usage with Milli-Q water (1 hr, 70°C in an ultrasonic bath), and then centrifuged with Milli-Q water (3x 2300 rpm, 5 min) followed by sonication in 0.01 M HCl for 15 min and centrifugation with Milli-Q water (3x 2300 rpm, 5 min). For the ultrafiltration itself, the collagen fraction is centrifuged (2500 rpm, 15 min) and the collagen peptides are recovered from the top of the solution in the vial and freeze-dried.
Carbonate Pretreatment
For carbonate analysis we use a hydrolysis system, which has been modified after the set up described in Wacker et al. (Reference Wacker, Fülöp, Hajdas, Molnár and Rethemeyer2013), in which carbonates are hydrolyzed and then the CO2 is transferred to the AGE-2 for graphitization. The hydrolysis system consists of a PAL HTC9-xt (CTC Analytics, Switzerland), the PAL headspace injection tool (HS 1000, CTC Analytics, Switzerland), and a heating block in which up to 21 12-mL Labco® vials can be placed. Prior to analysis, carbonate samples are washed in Milli-Q water in an ultrasonic bath. Then the sample surface is leached using 10–15 mL 1 M H2SO4 for 2–10 min depending on the sample size. After washing and drying (at least 4 hr, 60°C), the sample is pulverized and transferred to pre-cleaned (dichloromethane rinse, combustion at 450°C) Labco® vials. They are subsequently sealed with septum caps and flushed with He (grade 4.6, 99.996% purity) for 12 min at 100 mL/min to remove atmospheric CO2 from the headspace. In order to convert the carbonate into CO2, 0.5 mL 99% ortho-H3PO4 is added and the vials are heated (6 hr, 75°C). The evolving sample CO2 is flushed with He (60 mL/min, 2 min) to the AGE-2 system while water is retained on a phosphorous pentoxide trap.
Processing of CO2 Samples Using Molecular Sieve Cartridges
We use stainless steel molecular sieve cartridges (MSC) filled zeolite type 13X (Wotte et al. Reference Wotte, Wordell-Dietrich, Wacker, Don and Rethemeyer2017a) for CO2 sampling in the field, e.g. using respiration chambers or depth samplers (Wotte et al. Reference Wotte, Wischhöfer, Wacker and Rethemeyer2017b). The CO2 trapped on the zeolite is release by heating the MSC, which is attached to a vacuum rig, within 15 min to 500°C while flushing with He (grade 4.6, 99.996% purity) at 40 mL min−1 over a water trap (dry ice-ethanol, ca. –80°C) and a liquid nitrogen trap for CO2 collection in glass tubes as described in detail by Wotte et al. (Reference Wotte, Wischhöfer, Wacker and Rethemeyer2017b).
Compound-Specific 14C Analysis
We isolate individual lipids (e.g. n-alkanes or n-alkanoic acids) from sediments or soils with a pc-GC device as described in Eglinton et al. (Reference Eglinton, Aluwihare, Bauer, Druffel and McNichol1996). In brief, isolation of individual lipids is achieved by repetitive injection on our pc-GC system (Rethemeyer et al. Reference Rethemeyer, Fülöp, Höfle, Wacker, Heinze, Hajdas, Patt, König, Stapper and Dewald2013) that collects individual compounds based on their specific retention time. The trapping of individual compounds is achieved by condensation of these in glass traps attached to the preparative fraction collector (Gerstel, Germany). The isolated material is then recovered with 1 mL dichloromethane (HPLC grade) and transferred to quartz ampoules for 14C analysis as gas samples. Finally, the solvent is removed by evaporation. The blank levels of this laborious isolation procedure have been monitored with GC standards of known modern and (close to) fossil 14C concentration (Rethemeyer et al. Reference Rethemeyer, Fülöp, Höfle, Wacker, Heinze, Hajdas, Patt, König, Stapper and Dewald2013). We routinely determine the extent of extraneous modern and fossil C for each sample set processed with pc-GC and accordingly correct the 14C contents of the samples.
Preparation for Gas 14C Analysis
For GIS-AMS analysis, samples are prepared by sealed tube combustion. Briefly, samples are weighed into pre-combusted (900°C, 4 hr) quartz glass tubes together with pre-combusted copper oxide (msample:mCuO = 1:60; Santos and Xu Reference Santos and Xu2017) and silver wool (5 mg) to bind sulfur. The tubes are evacuated and flame sealed using a vacuum rig with a turbo-molecular pump (HiCube 80 Eco, Pfeiffer Vacuum, Germany) and combusted (900°C, 4 hr). The CO2 evolved is cryogenically purified on a vacuum line and transferred into 4 mm glass ampoules fitting into the GIS system. For EA-GIS-AMS analysis, samples are combusted either in tin boats (4 × 4 × 11 mm) or capsules (0.05 mL), which are previously solvent cleaned in the same way as the tin vessels for the AGE-2 system.
Graphitization
AMS graphite cathodes are produced in our laboratory with an AGE-2 system (Ionplus, Switzerland) coupled with an elemental analyzer (VarioMicroCube, Elementar, Germany) for sample combustion (Wacker et al. Reference Wacker, Němec and Bourquin2010; Rethemeyer et al. Reference Rethemeyer, Fülöp, Höfle, Wacker, Heinze, Hajdas, Patt, König, Stapper and Dewald2013). Depending on sample material and size, different tin containers are used in which the samples are combusted in the EA. For most samples we use tin boats with a size of 4 × 4 × 11 mm (H × W × L). If larger sample volumes are required, we use larger tin boats (8 × 8 × 5 mm) all manufactured by Elementar (Germany). Liquid samples are transferred into tin capsules (0.05 mL, Elementar, Germany) and dried therein. To remove contamination on the tin foil, we routinely clean all tin vessels with organic solvents. The washing includes two rinses with acetone (≥99.9%, supra trace), followed by three rinses with dichloromethane (HPLC grade; Rethemeyer et al. Reference Rethemeyer, Fülöp, Höfle, Wacker, Heinze, Hajdas, Patt, König, Stapper and Dewald2013). After combustion in the EA, the CO2 sample gas is converted to graphite in the reactors of the AGE using hydrogen over iron (Fe) as catalyst (Alfa-Aesar, iron powder, spherical, <10 micron). The Fe powder is usually weighed into the pre-combusted reactor vials of the AGE-2, evacuated and conditioned at the same day.
RESULTS AND DISCUSSION
Optimization of Graphitization Procedure
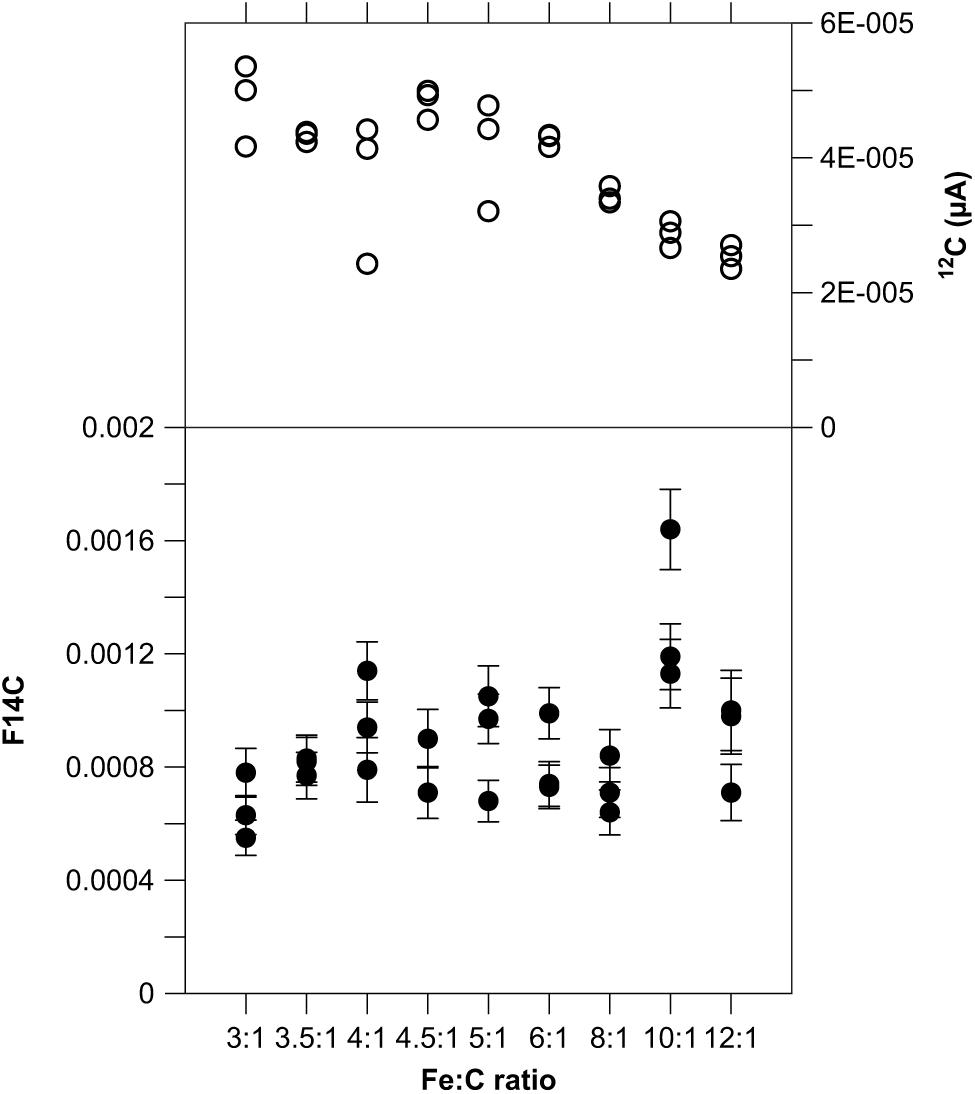
So far, we kept the amount of catalyst constant at 4 mg because most samples contain about 1 mg C, i.e. at a Fe:C ratio of 4:1. However, frequently samples are smaller than expected, therefore we tested the dependency of the Fe:C ratio on the background using 14C-free blank material with 1 mg C, which were graphitized in triplicates with various amounts of Fe as catalyst ranging from 3 to 12 mg Fe (Figure 1). The 14C concentrations do not vary significantly except for the samples with a Fe:C ratio of 10:1, where the F14C values are slightly higher. We observe a slight decline of the ion current once the ratio exceeds values of 8:1 in correspondence with Santos et al. (Reference Santos, Moore, Southon, Griffin, Hinger and Zhang2007a, Reference Santos, Southon, Griffin, Beaupre and Druffel2007b), who also recommend not reducing the amount of catalyst for smaller sample sizes, because of more stable beam currents with Fe:C ≥5. Lower amounts of catalyst (Fe:C <4) also do not affect the C yield and quality during the graphitization process (Němec et al. Reference Němec, Wacker and Gäggeler2010). Overall, the results demonstrate that it is not necessary to very accurately weigh the Fe powder because it has a minor effect on data quality.
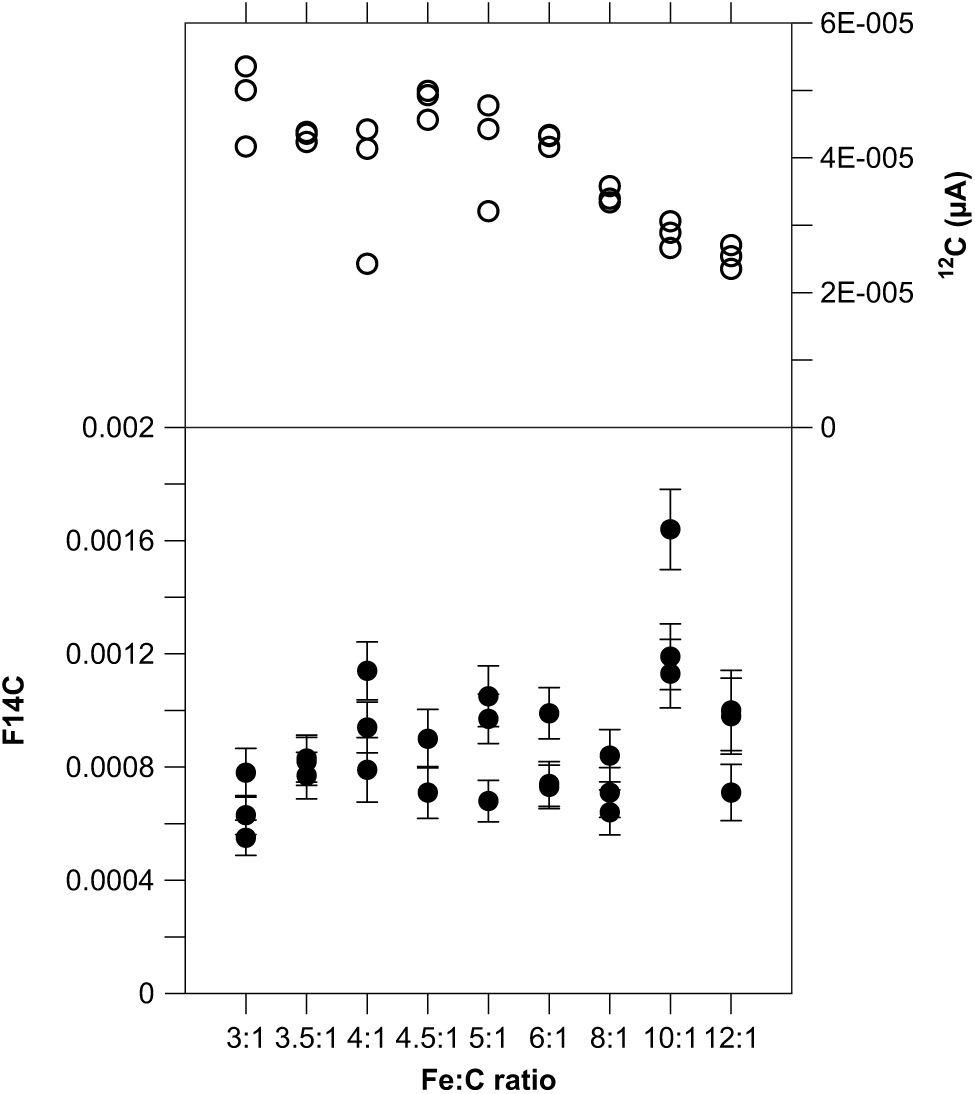
Figure 1 Blank values (black circles) and 12C beam current (open circles) versus Fe:C ratio generated with 14C-free coal (POC#3; 1 mg C) graphitized with various amounts of Fe as catalyst (3–12 mg Fe).
Long-Term Monitoring of Standard Blanks and Oxalic Acids of Graphite Samples
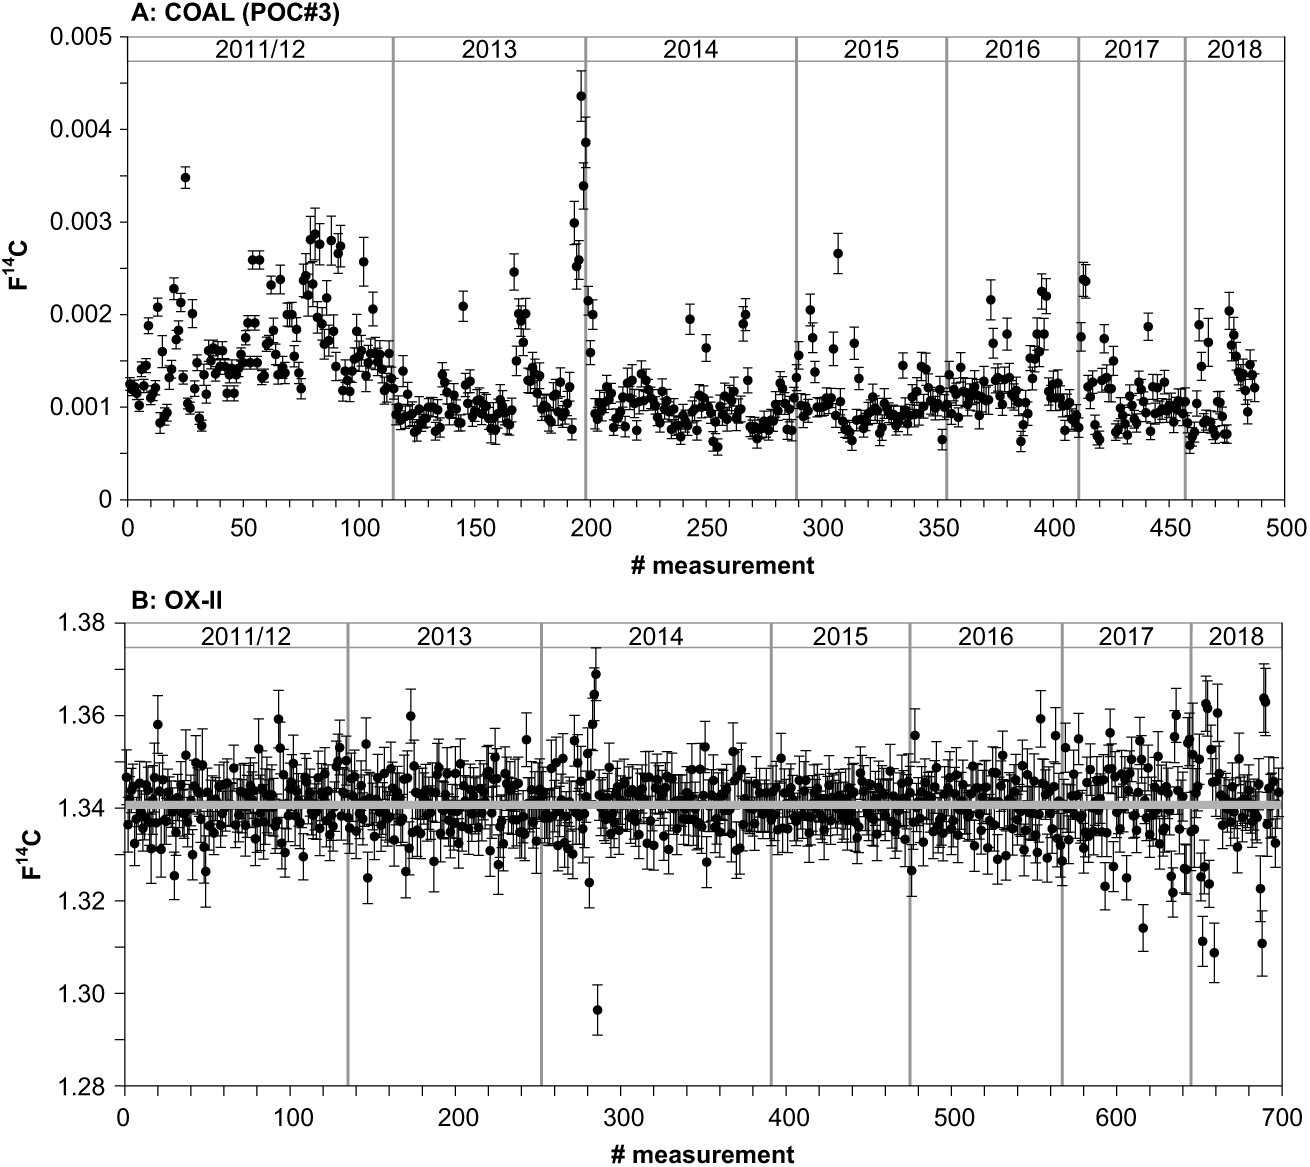
Figure 2 shows the long-term variability of our normal-sized (650–1000 µg C) process blank, coal (Pocahontas POC#3, Argonne Premium Coal, USA), and the oxalic acid standard (OX-II, NIST SRM 4990C; nominal value: 1.3407 F14C) in tin boats (4 × 4 × 11 mm) since 2011. We do not use the long-term blank for correction our results but the average of the blanks (3–4) processed with each sample set (usually 12–14) analyzed during one AMS 14C measurement slot to best account for blank contribution. The average 14C concentration of this seven-years blank (excluding 6 outliers at the end of 2013 that were due to a dirty ion source) is 0.0012 ± 0.0004 F14C corresponding to 54,305 ± 2581 yr BP (n = 484; mean size 989 ± 44 µg C; Figure 2a). The monitoring of these standards allows to immediately identify issues with either the graphite production or the AMS measurement itself and to analyze the accuracy and precision (Beverly et al. Reference Beverly, Beaumont, Tauz, Ormsby, von Reden, Santos and Southon2010).
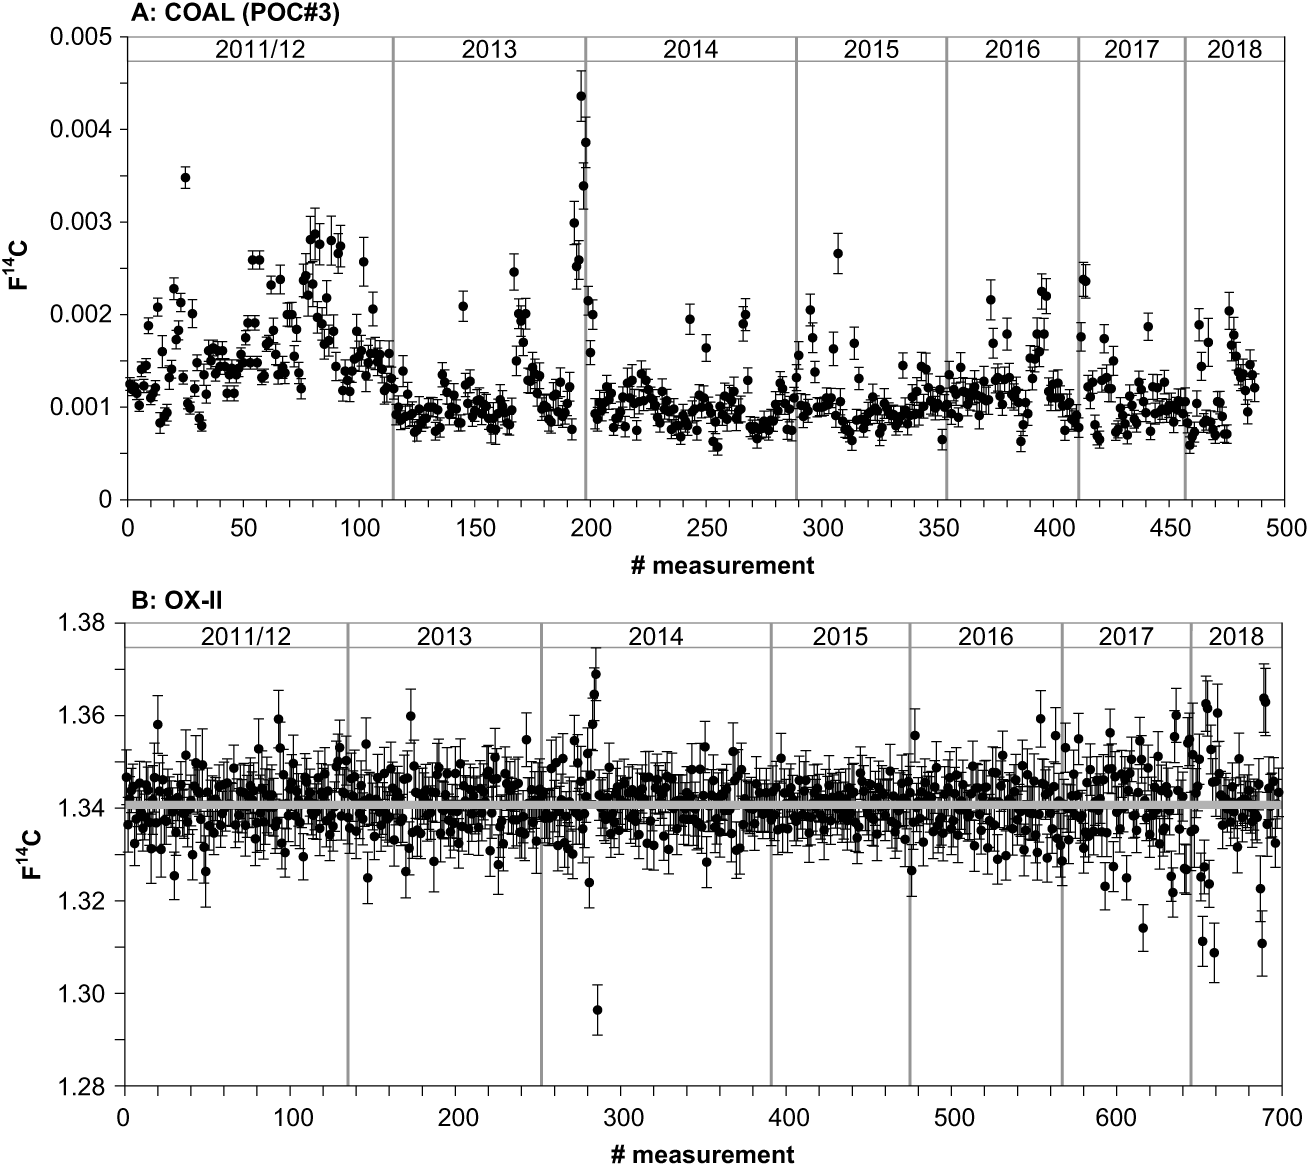
Figure 2 (A) Blank levels (in F14C) based on measurements of normal-sized 14C-free coal (POC#3, 650–1000 µg C) graphitized and analyzed since 2011. Results shown are not blank corrected. (B) Results for normal-sized oxalic acid (OX-II) standards (650–1000 µg C) measured since the installation of the laboratory in 2011 are given with blank subtraction.
Additionally, depending on the sample size and sample type, we use different tin containers for combustion and prepare size-matched blanks in the containers used for the samples in order to accordingly correct for any contamination resulting from the tin foil or from sample handling and processing. Samples with extremely low organic carbon contents often require the combustion of very large volumes that do not fit into the normal sized tin boats (4 × 4 × 11 mm). Such samples are combusted in larger tin boats (8 × 8 × 15 mm), which have a slightly higher blank (650–1000 µg C) of an average 0.0016 ± 0.0004 F14C (n = 145; 51,982 ± 1843 yr BP) for normal sized (650–1000 µg C) samples. Liquid samples are routinely combusted in tin capsules (0.05 mL) that yield average blank values for POC#3 of 0.0017 ± 0.0005 F14C (51,639 ± 2224 14C yr BP, n = 19).
A total of 698 oxalic acid standards were measured during the last seven years with a mean sample size of 994 ± 21 µg C and an average F14C value of 1.3408 ± 0.068 corresponding to an overall precision of 0.5% for modern material (Figure 2b).
Blank Values for Small Samples
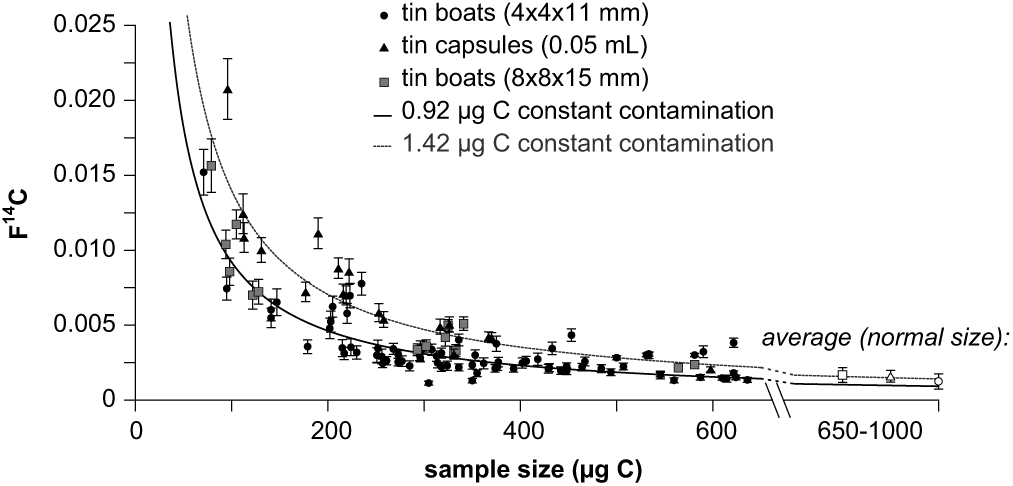
Depending on the sample size we routinely adjust the size of the blank material in order to accordingly correct for background. Figure 3 shows the size dependency of the graphitization blanks for different tin vessels used for EA combustion. The smaller the sample size, the more they are affected by a contamination and its uncertainty. For small sample sizes ranging from 250–650 µg C we still have a reasonable blank of 0.0025 ± 0.0007 F14C (48,441 ± 2396 yr BP, n = 64) for our standard tin boats and of 0.0030 ± 0.0014 F14C (47,763 ± 4545 yr BP, n = 12) for the tin capsules. The larger tin boats have a higher blank of on average 0.0043 ± 0.0012 F14C (44,202 ± 2619 yr BP, n = 9), which can most probably be attributed to impurities of the tin vessel itself, which cannot be removed by solvent washing. We applied the model of constant contamination by fitting the data set of these small blanks with the Monte-Carlo approach. For the tin capsules and smaller tin boats we determined an addition of 0.92 ± 0.05 µg C, while the constant contamination for the larger tin boats is slightly higher (1.42 ± 0.08 µg C).

Figure 3 14C concentrations of blank material (coal, POC#3) versus sample size using different tin vessels for EA combustion (circles: tin boats 4 × 4 × 11 mm; squares: tin boats 8 × 8 × 15 mm; triangles: tin capsules 0.05 mL). The curves are based on the model of contamination corresponding to 0.92 µg C modern contamination (usual tin boats and capsules, black line) and 1.42 µg C modern contamination (larger tin boats).
Blanks and Standards of Gas Targets
Blank values and sample size limitations of GIS-AMS and EA-GIS-AMS analysis are discussed in detail elsewhere (Melchert et al. Reference Melchert, Stolz, Dewald, Gierga, Wischhöfer and Rethemeyersubmitted to this issue; Stolz et al. Reference Stolz, Dewald, Altenkirch, Herb, Heinze, Schier, Feuerstein, Müller-Gatermann, Wotte, Rethemeyer and Dunai2017, Reference Stolz, Dewald, Heinze, Altenkirch, Hackenberg, Herb, Müller-Gatermann, Schiffer, Zitzer, Wotte, Rethemeyer and Dunai2019). In summary, both gas injection systems have very similar blank values corresponding to the addition of a constant contamination of about 0.27 ± 0.05 µg C for GIS-AMS and 0.27 ± 0.02 µg C for EA-GIS-AMS introduced during sample processing, combustion, and analysis.
Blank of Molecular Sieve Cartridges
The contamination of CO2 samples, which are processed with the MSC, by modern C and fossil C is less than 3 μg C and 2 μg C, respectively. The process blank for the entire CO2 sampling and purification procedure including CO2 sampling with respiration chambers or depth samplers is ∼0.004 F14C (44,000 yr BP) and ∼0.003 F14C (47,000 yr BP), respectively, for sample sizes in the range of 5000 to 7000 µg C. If CO2 samples sizes are large enough yielding >500 µg C, the CO2 on the MSC can also be released into the AGE for its conversion to graphite, which produces very low blank values of about 0.0028 ± 0.0002 F14C (47,000 yr BP). Further details are given in Wotte et al. (Reference Wotte, Wordell-Dietrich, Wacker, Don and Rethemeyer2017a, Reference Wotte, Wischhöfer, Wacker and Rethemeyer2017b).
Compound-Specific Blank
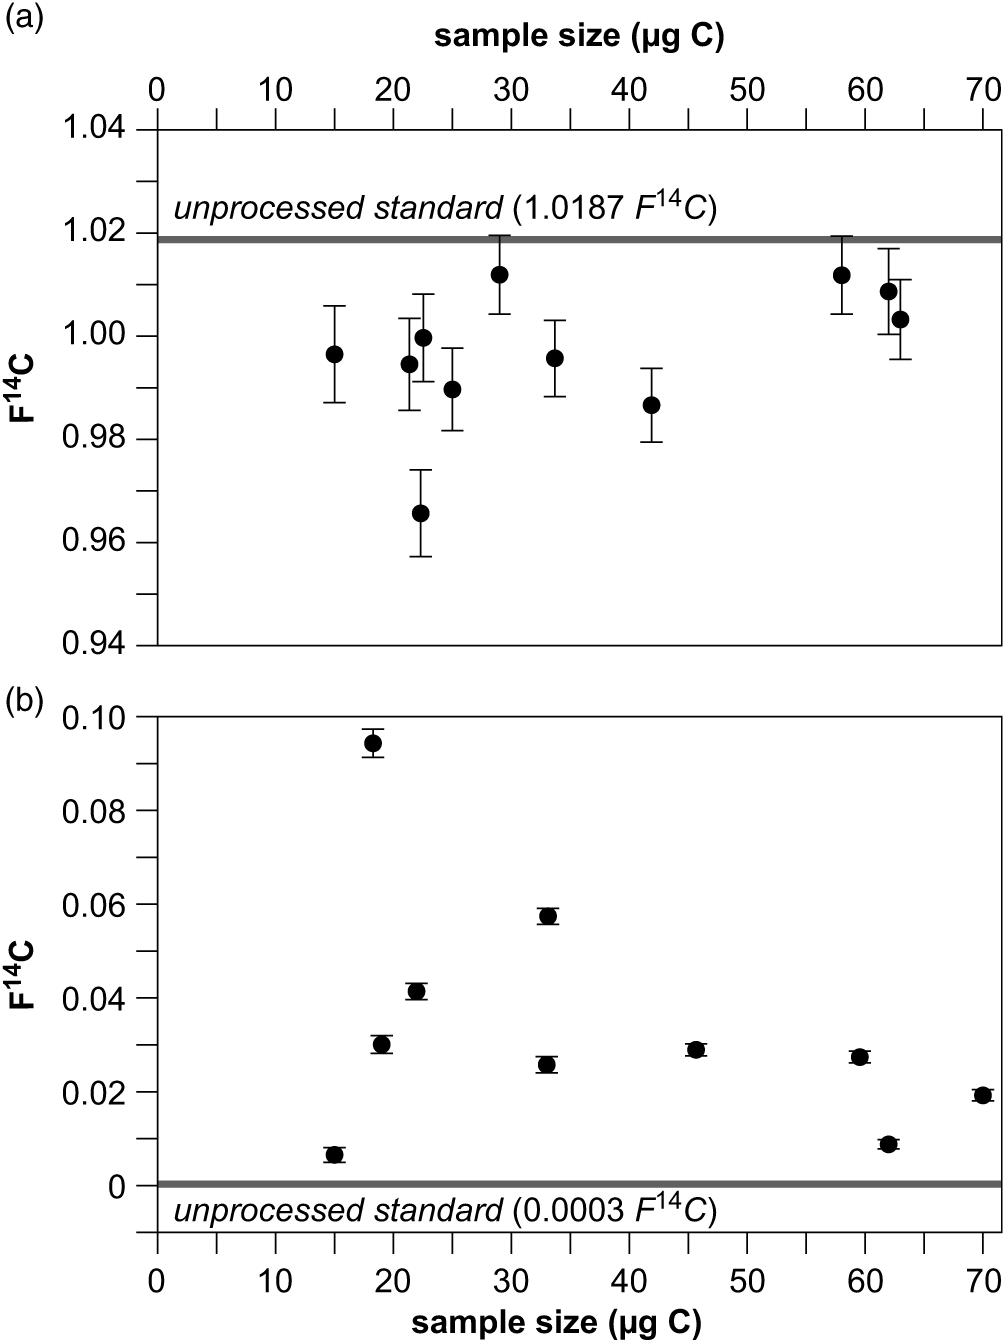
We continuously monitored the contamination added during the isolation procedure of individual lipids using pc-GC and the subsequent handling for GIS-AMS preparation. The entire procedure introduces on average 1.1 ± 0.6 µg C (n = 11) modern contamination (F14C = 1), which was identified using a 14C-free standard, and on average 0.7 ± 0.4 µg C (n = 10) of 14C-free contamination (F14C = 0) identified with a modern standard. In total, 1.8 ± 0.7 µg C with 0.61 ± 0.41 F14C is added to each sample during the entire isolation procedure, which is comparable to blank levels for pc-GC reported from other laboratories (e.g. Galy and Eglinton Reference Galy and Eglinton2011; Douglas et al. Reference Douglas, Pagani, Eglinton, Brenner, Hodell, Curtis, Ma and Breckenridge2014; Gierga et al. Reference Gierga, Hajdas, van Raden, Gilli, Wacker, Sturm, Bernasconi and Smittenberg2016). However, we also identified some distinct outlier with contamination levels of up to 4.6 µg C of only modern or only dead contamination. These values result form exceptional circumstances (e.g. cross contamination or individual mistakes). The 14C concentrations for the isolated modern and 14C-free standards versus their size in comparison with the 14C contents of the respective unprocessed standards are shown in Figure 4. The given data set does not show a clear trend of a constant contamination like for the small graphite samples (Figure 3). This might be due to the fact that the individual data points were collected over a long period of over 5 years, while the laboratory equipment changed and different persons treated the samples. We also do not see a relationship between the number of injections, i.e. the duration of sample collection, into the pc-GC and the amount of contamination added to the sample as observed by others (Ziolkowski and Druffel Reference Ziolkowski and Druffel2009). Therefore, we are correcting the 14C concentrations of the isolated samples for a blank contribution that has been individually determined with each sample set.

Figure 4 14C contents of a modern (a) and fossil (b) standard isolated with pc-GC versus sample size with 2-sigma uncertainty. The solid line represents the 14C content of the unprocessed standard.
In order to reduce the amount of contamination, we tested the influence of different methods of solvent removal after the isolation procedure to the addition of extraneous C to the samples. First, dichloromethane was removed from the isolated lipids in the quartz ampoules by using a stream of N2. During this procedure 2.6 ± 0.3 µg C of modern and 1.0 ± 0.3 µg C (both n = 2) of fossil contamination was added to the samples. The N2 used in the lab was only technical grade, but an additional gas filtration unit promised to significantly enhance the purity of the gases, which was obviously not the case. Therefore, solvent removal was established to be routinely performed using rotary evaporation, as contamination levels were significantly lower. With this technique we identified a fossil contamination of 0.4 ± 0.3 µg C (n = 2), while the modern contribution was negligible (0.03 ± 0.05 µg C, n = 2). Our laboratory recently moved into a new building with a supply of high purity N2 (grade 5.0, 99.999% purity) that most probably will lower blank values, which is currently being tested.
SIRI
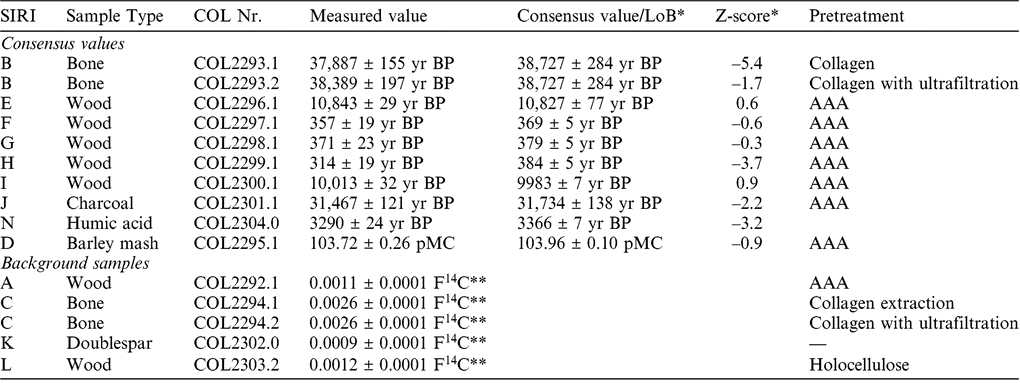
To assure the quality of the sample handling and graphitization procedure we participated in the Sixth International Radiocarbon Inter-comparison (SIRI). In 2013, we prepared and analyzed a suite of commonly dated materials (wood, bone, charcoal, humic acid, barley mash) with 14C contents ranging from modern values to background (Scott et al. Reference Scott, Naysmith and Cook2017). The results from our laboratory in comparison with the published consensus values (Scott et al. Reference Scott, Naysmith and Cook2017) are given in Table 2. Most of the results are in good agreement with the consensus values, which is reflected by Z-scores < ±2. Surprisingly, the bone sample SIRI B gave better (slightly older) values applying additionally ultrafiltration, even though the collagen quality was good according to the criteria given above. We also reported slightly younger values for SIRI H (wood), J (charcoal) and N (humic acid), which is reflected in negative Z-scores < –2. As a result of this, we are currently further investigating our pretreatment protocols with special regard to the addition of modern contamination. It has to be noted that the preparation of this SIRI sample set was carried out in 2013, when we just have started to routinely prepare samples for AMS measurements. Since then we continuously evaluated and improved our laboratory protocols, especially since we moved into a new laboratory at the end of 2017.
Table 2 Results for reference materials from the SIRI inter-comparison.
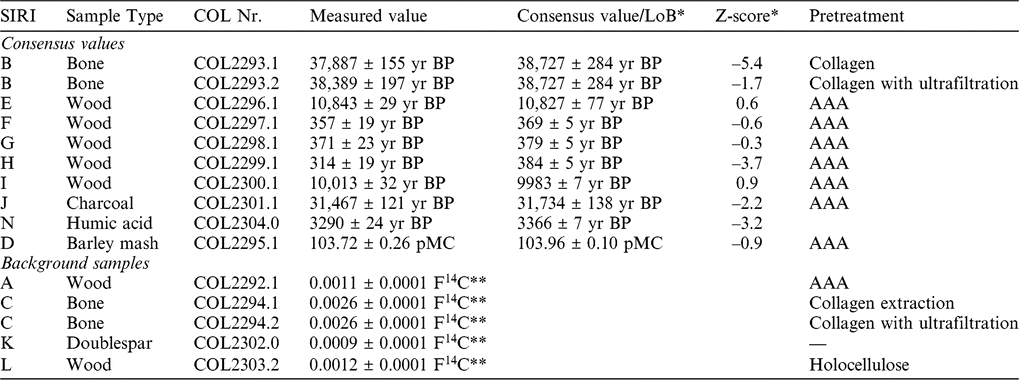
* Scott et al. (Reference Scott, Naysmith and Cook2017).
** Measured F14C, no blank correction.
ACKNOWLEDGMENTS
We thank Lana John, Ulrike Patt, and Daniela Warok for their careful and reliable sample preparation, which was assisted by our student helpers Reaz Hossain, Elisabeth Krewer, Vera Schmitt, Johanna Steffestun. Bianca Stapper, and Sandra Jivcov supported the CSRA analytical work. This work was financially supported by German Science Foundation (DFG) within CRC 806 and CRC 1211. CSRA work by Sonja Berg was supported by a Postdoc Grant from the University of Cologne.


