INTRODUCTION
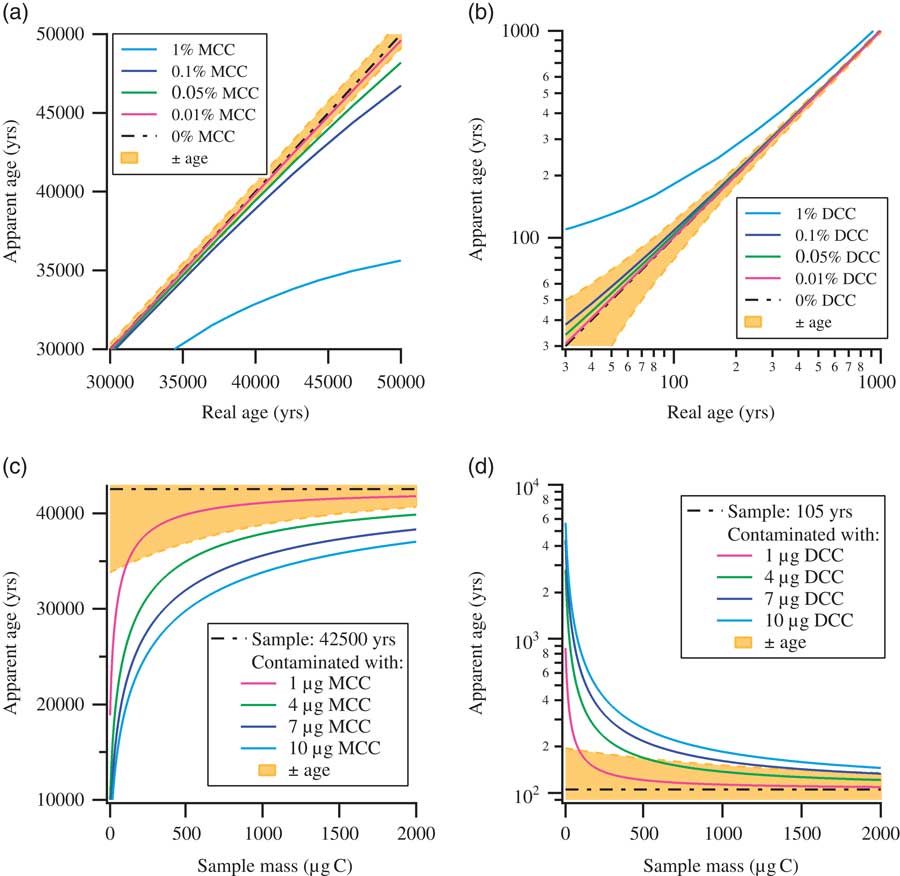
Contamination is generally a serious concern for any high-sensitivity measurement technique, and this is certainly the case for radiocarbon detection by accelerator mass spectrometry (AMS). For 14C measurements by AMS, the samples are, mostly after pretreatment, combusted to CO2, which is then reduced to graphite. The produced solid graphite samples are then pressed in sample holders (“targets” or “cathodes”) and are subsequently measured in the AMS by sputtering the surface with Cs ions. The released C– ions are then used for the actual measurement. Due to the number of steps involved, from sample preparation to measurement, utmost care and attention is required to reduce the contamination accumulated over the whole process. For larger samples (1–2 mg C), with near-contemporary 14C concentrations, contaminations accumulated after careful preparation may be barely discernible. On the contrary, for background materials and small(er) samples (1–200 µg C), measurements can be seriously affected by the inevitable contaminants accumulated during the preparation steps (Kirner et al. Reference Kirner, Taylor and Southon1995; Brown and Southon Reference Brown and Southon1997; Santos et al. Reference Santos, Southon, Griffin, Beaupre and Druffel2007; de Rooij et al. Reference de Rooij, van der Plicht and Meijer2010). This is one of the reasons why 14C dating beyond 50,000 yr is so challenging. The “age,” that is the 14C content, of the contaminating material matters: by the very nature of the 14C dating technique, contamination of (sub)-modern samples by old carbon (e.g. from synthetic chemicals used in the preparation steps) only dilutes the sample, and the effects stay marginal. Contamination of old samples by modern carbon (e.g. atmospheric CO2 from the laboratory), on the other hand, can have massive impact. These effects are summarized in Figure 1, which shows the influence of modern carbon contamination (MCC, 14C activity=100 pMC: percent Modern Carbon) and dead carbon contamination (DCC, 0 pMC) on age determination. As shown in Figure 1a, MCC affects the age determination of older samples close to background, whereas DCC affects near-contemporary samples, as shown in Figure 1b. Contamination of a background (42,500 yr old) and a near-contemporary (105 yr old) sample with a fixed mass of modern or dead contaminants (1, 4, 7, and 10 µg C) with respect to a change in sample size is shown in Figures 1c and d. The uncertainties in age determination, shown with shaded background, are the typical uncertainties at the Groningen AMS facility, based on many years of operation. Thus, Figure 1 aims to illustrate that the contamination arising solely from DCC affects a very narrow range of sample age, i.e. near contemporary, whereas contamination arising solely from MCC affects a far-wider range of sample age especially near background. In reality, of course, the contamination is a combination of both MCC and DCC, where the extent of contamination from each component may vary depending on the precautionary measures adopted with the sample preparation. Although understanding the source and mechanism of contamination through DCC is important, it is of less concern for near-background measurements. In this article, we concentrate on near-background samples, and thus performed experiments to understand the possible sources of MCC.

Figure 1 Plots illustrating the impact of modern carbon contamination (MCC) and dead carbon contamination (DCC) on age determination: (a) impact of MCC on age determination; (b) impact of DCC on age determination (for clarity shown with log-log axes); (c) impact of MCC on age determination of a background sample (42,500 yr) with respect to sample size; (d) impact of DCC on age determination of a near-contemporary sample (105 yr) with respect to sample size. Typical uncertainties in age determination as performed in Groningen are shown with shaded background. Modern carbon contaminations have the largest effects on samples containing close to background levels of 14C and on very small samples.
When performing an AMS measurement, a sample is measured for a substantial time period to reduce the measurement uncertainties. Depending on the type of ion source in use, it is either sputtered at a single position or at multiple positions on the target. At the Centre for Isotope Research (CIO), Groningen, we perform measurements at eight different positions on the target. A measurement at each position is performed for 30 s, before moving to the next position. Such a 30-s measurement is referred to as a “block.” Each position on the target is measured 10 times, thus producing a total of 80 blocks with a total measurement time of 40 min.
During the measurements of very old samples and background material, the initial measurements always yield higher 14C counts that eventually decline, after a few blocks of measurements, to lower and stable values. The higher values during the initial measurements, if not removed, invariably influence the age determination. To reduce the undesirable influence from the initial blocks, we perform a so-called “cleaning run” of eight blocks of only 10 s each, before performing the actual 80-block measurement. This cleaning run is performed for a whole “batch” of up to 58 samples, before starting the actual measurements. This means that the time between cleaning run and actual measurement varies from ~2 hr to more than 40 hr from the first to the last sample in the batch. This approach with the cleaning run step preceding the actual measurements has additional advantages apart from cleaning the surface: it provides adequate time for source stabilization and also provides a quick overview of the sample quality in the whole batch. Still, in the light of the findings of this work, we are seriously considering to change our cleaning approach.
The initial higher counts during the course of measurement indicate the presence of a carbonaceous layer with higher 14C content on top of the background sample material. We have been investigating this phenomenon for some years now and here we describe the understandings we gained over these years.
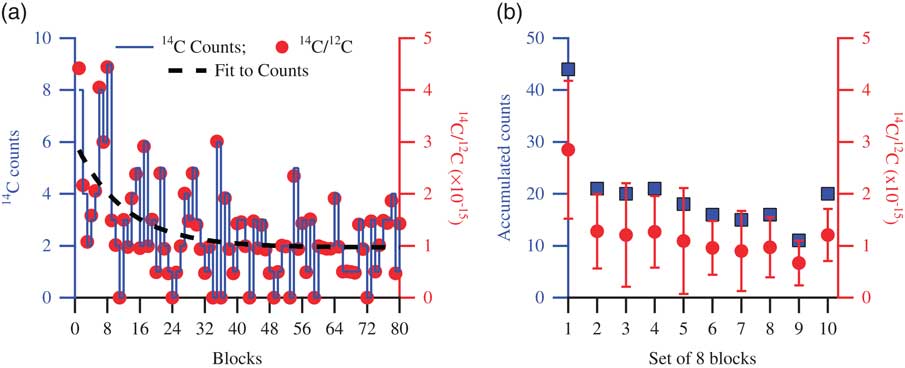
The phenomenon of surface contamination we observe is illustrated in Figure 2, which shows a typical background sample measurement. The target was pressed and left in open air for 1 day before it was measured. In Figure 2a, the 14C counts are shown with a solid line, the corresponding 14C/12C ratio with solid circles, and an exponential fit to the counts with a dashed line. In Figure 2b, the accumulated counts in the 10 consecutive sets of eight blocks (squares) and their corresponding average 14C/12C ratios (circles) are shown. Due to contaminants on the surface of the target, the count rates observed during the initial parts of the measurement are higher than later in the measurement, where the average count rate gradually decays to lower values. It appears that the contamination causing this elevated count rate generally disappears in the second–third set of eight blocks, so when each position in the target has experienced ~2 times 30 s of sputtering by the Cs ions.

Figure 2 Data showing a typical background target measurement. (a) The 14C counts are shown with a solid line, the corresponding 14C/12C with solid circles, and an exponential fit to the counts with the dashed line. (b) Counts accumulated in 10 consecutive sets of eight blocks, shown with squares, and the corresponding 14C/12C averages, shown with circles (error bars representing 1σ standard deviation). Higher counts are observed during the initial part of the measurement due to carbonaceous contaminants on the surface of the target. As the measurement proceeds, cleaner surface is exposed, indicated by the reduced number of counts representative of the background material.
In a quest to understand the source of the surface contamination that leads to these initial higher counts, several storage tests were performed. During these tests, samples were exposed to various 14C contamination sources in a controlled environment. The possible carbon-containing molecules for such a contamination from air are CO2, CH4, CO, and several other volatile organic compounds (VOC), partly already present in the atmosphere and partly from solvents used in the laboratory. CO2 is by far the largest C-containing fraction (with modern levels of 14C) in laboratory air with concentrations typically between 400–1000 ppm, depending on the number of occupants at a given time. CH4 is the second largest C-containing fraction in laboratory air (typically 2 ppm, so roughly 2 orders of magnitude lower than CO2) followed by CO (typically 0.2 ppm). Other hydrocarbons present in typical laboratory air have even smaller concentrations. Therefore, we decided to test the extent of sample contamination with samples stored in air spiked with CO2. Following these storage tests, we learned, to our surprise, that the pressed targets carried more contamination than the unpressed graphite powders. It was also revealed during these experiments that, while some storage conditions were worse than others, almost all storage conditions affected the pressed targets. The unpressed graphite powder was mostly unaffected, only storage in a 14C-enriched CO2 environment lead to a noticeable increase in the 14C activity. A detailed description of these experiments is the main subject of this paper, and they will be discussed below. Basically, we will describe the production of sample material, and its storage under varying CO2-spiked laboratory air conditions, and the effects on the count rate, both for the initial and steady-state phase of the measurement.
We learned recently that this process of surface contamination with a carbonaceous layer is not only a concern during AMS measurements, but also in the field of material sciences. In that field of research, it has been known for a long time that any clean surface (not necessarily carbon), when exposed to air, is immediately coated with a thin layer of carbonaceous material. This process even occurs under high vacuum, although at a much lower rate, where the carbonaceous contaminants are believed to have originated from the surface of the vacuum tank. This carbonaceous layer produced on the clean surface is called adventitious carbon (Barr and Seal Reference Barr and Seal1995; Miller et al. Reference Miller, Biesinger and McIntyre2002; Piao and McIntyre Reference Piao and McIntyre2002; Mangolini et al. Reference Mangolini, McClimon, Rose and Carpick2014), which will be referred to as AC hereafter. A complete understanding of the source of this persistent carbonaceous layer is highly debatable and not well understood, though several mechanisms have been proposed (Barr and Seal Reference Barr and Seal1995; Miller et al. Reference Miller, Biesinger and McIntyre2002).
SAMPLES
Background graphite samples were prepared from Rommenhöller CO2 [AGA, presently Linde gases], which serves as our laboratory background material of infinite age. The activity of the Rommenhöller CO2 is 0.15±0.04 pMC. As the Rommenhöller CO2 itself is an extremely old material, the activity level we determine is a combination of a possible residual activity of Rommenhöller CO2, and contaminating modern carbon accumulated along the preparation of this CO2 to a graphite target. Correspondingly, from long-term measurements, its spread shows the variability in that contamination.
Such background CO2 samples (~2 mg C) were “graphitized” in the routine way, that is, reduced to elemental carbon in the presence of H2 (~2.5 × partial pressure of CO2) and Fe (~2.0–2.5 mg) at 600°C (Aerts-Bijma et al. Reference Aerts-Bijma, Meijer and van der Plicht1997). For the extensive tests described here, these samples were subsequently stored under various CO2-spiked laboratory air conditions, typically for more than a week, either in the form of powder (as produced) or pressed on aluminum AMS targets. For every test, a set of five samples was prepared for each storage condition within the test. Custom-designed leak-tight containers were used to store the samples in controlled conditions, i.e. in a specific gas mixture. Samples stored in dry argon (4.6) served as a control storage condition. The control samples were placed in a dry argon atmosphere as soon as they were prepared or pressed with the least possible exposure time to laboratory air. Initial storage experiments, performed previously (under less well-defined circumstances), indicated that samples stored in an atmosphere with water vapor were contaminated the most (even in a wet, initially pure argon atmosphere, which, however, may have gotten contaminated by outside air due to leakages in the polycarbonate desiccator used for storage back then). Hence, for the storage tests, background samples were stored in humidified laboratory air spiked with CO2 samples (1–5%) with different 14C activity. The activities of the CO2 samples used to spike the laboratory air were 0.27, 50, 108, and 980 pMC. The 980-pMC CO2 was prepared in-house for intracavity optogalvanic spectroscopy (ICOGS) experiments and has been described elsewhere (Paul and Meijer Reference Paul and Meijer2015).
RESULTS
As discussed in the previous sections, the graphite samples were stored under various CO2-spiked laboratory air conditions to investigate their effect on the level of acquired contamination. Figure 3 shows the extent of contamination acquired by sets of five pressed aluminum targets stored in three different storage conditions. Five background graphite targets were pressed and were immediately stored in a dry argon atmosphere. These samples were designated as controls and are shown with open circles in the top plots. The next set of five pressed background targets were stored in humidified laboratory air spiked with 5% CO2 with activity 0.27±0.02 pMC, shown with triangles in the middle plots. Additionally, a set of another five background targets were stored in humidified laboratory air spiked with 5% 14C-enriched CO2 (~980 pMC), shown with diamonds in the bottom plots. Figure 3a shows the counts recorded during the course of measurement for each storage condition and Figure 3b shows the corresponding frequency distribution of the counts. As mentioned earlier, the surface contamination is prominently visible during the initial parts of the measurement with relatively more counts in the first ~16 blocks, which subsequently decays to fewer counts representing the bulk background material. It is quite noticeable that the targets stored in an argon atmosphere show a lower number of counts during the initial part of the measurement than those stored under the other two storage conditions. Targets stored in humidified laboratory air containing spiked CO2, depleted in 14C (resultant 14C activity ≈ 1 pMC), still showed an overall increase in the number of counts. As described in Miller et al. (Reference Miller, Biesinger and McIntyre2002), deposition of a carbonaceous layer on a clean Fe surface happens very fast. Furthermore, the carbonaceous layer thickness tends to saturate within a few minutes of exposure and prolonged storage does not significantly alter the layer thickness nor the chemical composition. This implies that significant uptake of atmospheric CO2 can already occur in the short time between the moment the samples were pressed and brought to the storage container. At the time these experiments were performed, we were unaware of the fact that the uptake process is so fast and thus requires as rapid as possible transport of the pressed material to the storage container. The five control targets were first pressed and immediately stored, but after that 10 targets were pressed sequentially, after which five targets were stored in storage condition 2 and the other five were stored in storage condition 3. This longer exposure time to laboratory air would explain why the samples stored in the depleted CO2 atmosphere still showed higher activity than the control ones. The targets stored in humidified laboratory air containing 5% enriched CO2 (980 pMC) were contaminated the most. This case shows that the contaminating carbon percolates very deep into the sample bulk: the counts numbers do not get back to the background level, not even for the last block measurement. This possibly indicates that the carbonaceous layer formation was not complete during the exposure to laboratory air and sufficient number of sites were still available for the enriched CO2 to interact with. One other feature observed in all storage experiments was that the number of blocks that would produce zero 14C counts would always decrease upon storage, again indicating the presence of contaminants in the sample matrix. The frequency distribution of the counts shows this effect, which even happens under the control storage conditions (which corroborates the occurrence of adventitious carbon, probably from wall absorption). However, a large shift in the count distribution occurs as the extent of contamination increases. Remarkably, though, a storage test performed earlier, with pressed graphite and graphite powder, with 5% CO2 (760 pMC, and about threefold enriched in the abundances of the stable isotopes) in humidified lab air only showed a gain in contamination similar to the present ones stored in 5% CO2 (0.27 pMC) in humidified lab air. The reason for this behavior is not understood; it was not investigated further since that storage test had not been performed as carefully as our new experiments, and there were even doubts at the time whether the spiked CO2 was really enriched in 14C. The newly prepared enriched CO2 (980 pMC) showed enhanced acquired contamination in all the following storage tests, as expected. A summary of all the determined 14C activities is shown in Figure 3c.
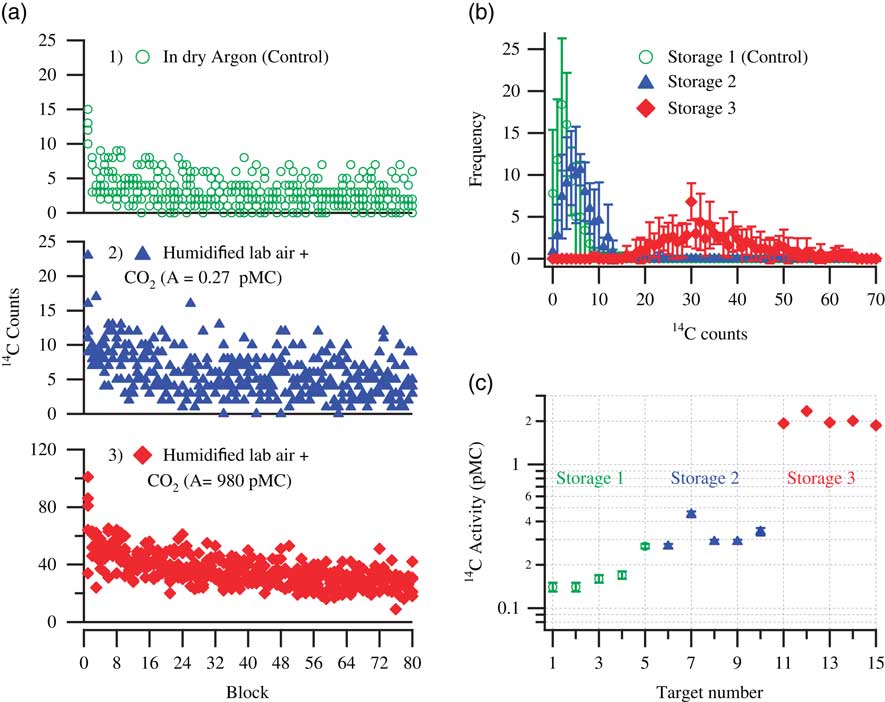
Figure 3 Storage test demonstrating the extent of acquired contamination in pressed targets on exposure to: Storage 1, dry argon; Storage 2, humidified lab air +5% CO2 (0.27±0.02 pMC); and Storage 3, humidified lab air +5% CO2 (980 pMC). (a) 14C counts (raw data) detected during measurements of five pressed targets per storage condition. (b) Average frequency distribution of the counts for five pressed targets per storage condition. (c) Calculated 14C activity (pMC) of the stored targets. For each storage condition, the results shown are the measurements of five samples that were pressed and stored for a period of 10 days before measurements were performed.
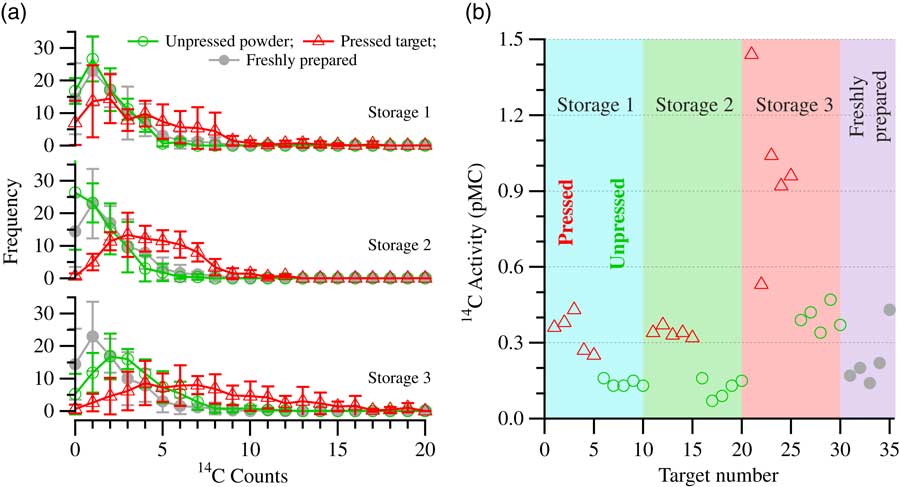
Through these (and previous) storage tests, it was also revealed, to our surprise, that the samples stored in the form of pressed graphite targets are more susceptible to contamination than the ones stored under the same conditions, but in the form of powder. As the effective exposed surface of graphite powder is much larger than that of the pressed targets, this is counterintuitive. The effect is illustrated in Figure 4a, which shows the frequency distribution of counts of samples stored in three different storage conditions. Unpressed graphite powder (×5 in each storage condition) and pressed targets (×5 in each storage condition) were stored in humidified laboratory air spiked with ~1.5% CO2 with an activity of 50, 108, and 980 pMC, respectively. The samples were stored in the test condition for a period of 10 days. For comparison, the count distribution from a set of five freshly pressed targets is also shown (the same in all three graphs). These were transferred into the AMS sample chamber immediately after they were pressed, along with the other 30 targets from the test. In Figure 4a, the stored unpressed samples are shown with open circles, pressed targets are shown with open triangles, and freshly prepared targets with solid gray circles. The pressed targets in all storage conditions acquired contamination, the extent of which depended on the type of CO2 the system was spiked with. Contamination was not visible on the graphite powder samples stored in the systems containing 50 pMC and 108 pMC CO2, while the powder samples stored in the system containing 980 pMC CO2 did show a shift in the count distribution, indicating a significant contamination take-up, but by far not as much as the pressed targets under that same storage condition. Shown in Figure 4b is the summary of all the 14C activities determined for the 35 targets. 14C activities corresponding to the pressed targets are shown with open triangles and the ones corresponding to the unpressed powder samples are shown with open circles. The freshly prepared samples are shown with filled circles.

Figure 4 (a) Frequency distribution of counts plot for storage tests with graphite in the form of powder (open circles) and pressed targets (open triangles) showing the difference in the level of acquired contamination: Storage 1, humidified lab air +1.5% CO2 (A=50 pMC); Storage 2, humidified lab air +1.5% CO2 (A=108 pMC); and Storage 3, humidified lab air +1.5% CO2 (A=980 pMC). The freshly prepared samples (gray circles) are plotted for comparison in each of the three graphs. (b) Calculated 14C activity (pMC) of the stored pressed targets (open triangles), the stored graphite powder samples (open circles), and the freshly prepared targets (filled gray circles). For each storage condition, the results shown in (a) are the averages for five pressed targets and five graphite powder samples, respectively, that were stored for a period of 10 days before measurements were performed.
DISCUSSION
In the first phase of our storage tests, we suspected the iron catalyst to be the mediator of the contamination on the samples. Since iron undergoes several different reactions during the production of graphite (Nemec et al. Reference Nemec, Wacker and Gaggeler2010), it was our hypothesis that one of the reaction products, probably an oxide of Fe that survived during the graphitization reaction, exhibited very efficient carbon sequestration from atmospheric CO2 on to the target surface. Thus, to remove any leftover iron oxides we hydrogenated the graphitization product (GP) at 600°C and observed that it partially reacted, producing methane. We then graphitized a set of 10 Rommenhöller CO2 samples, and hydrogenated five of them in an attempt to passivate the samples. These samples were then pressed and left in open air for a week. We then measured these samples and found no improvement in the level of acquired contamination. The results also showed that the reduction product, compared to the GP, was significantly depleted in 13C (δ13C from –2.2±0.5‰ to –9.3±0.7‰). We also tested the reactivity of high-purity, commercially available graphite (Alfa Aesar, 99.9995%) to hydrogenation reaction at 600°C and found that the graphite failed to react.
Thus, to understand the elemental composition of our GP, we then performed elemental analysis with energy-dispersive X-ray spectroscopy (EDXS) to examine the presence of oxygen in the samples. The results showed no evidence of oxygen in the sample. Additionally, to understand the chemical composition of the GP, we also performed powder X-ray diffraction (PXRD) measurements. Figure 5a shows the PXRD data of Fe (lowermost spectrum) and the graphitization product (GP, Fe + carbon) (middle spectrum). The scanning electron microscopic (SEM) images of the graphitization product and the iron power are shown in Figures 5b and c, respectively. These PXRD studies revealed that the carbon in our GP, commonly referred to as graphite in the 14C community, is predominantly a mixture of graphite and iron carbide (Fe3C). The spectrum also reveals that no Fe is left in its original state. For identification of peaks, the standard reference spectra of Fe3C and graphite are also shown, as circles and triangles, respectively, in the GP spectrum (Downs and Hall-Wallace Reference Downs and Hall-Wallace2003). Kim et al. (Reference Kim, Kelly, Ortalan, Browning and Clifford2010) measured the PXRD spectra of graphitization products with varying C/Fe mass ratio (1:1, 1:5, 1:10, and 1:15) at different temperatures (400, 500, 525 and 585°C) (Kim et al. Reference Kim, Kelly, Ortalan, Browning and Clifford2010). Their PXRD spectrum of the graphitization product with 1:1 (C/Fe) mass ratio, prepared at 585°C closely resembles that of the samples we prepare at 600°C (~1:1 C/Fe). It is evident from their measurements that the crystalline graphitic phase (2θ≈26.5°) only appears, at detectable levels, at temperatures >500°C with 1:1 (C/Fe) mass ratio. Since Fe3C reacts with H2 at 600°C, producing methane (Kock et al. Reference Kock, De Bokx, Boellaard, Klop and Geus1985), whereas the graphitic form of carbon remains intact, it is therefore possible to quantify the carbide phase by hydrogenation. Hence, we performed a hydrogenation reaction following the graphitization step. On completion of the graphitization reaction the reactor was evacuated and filled with ~500 mbar of hydrogen and heated to 600°C. The PXRD data of the hydrogenated product is also shown in Figure 5a (top spectrum). The result clearly shows that the iron carbide upon hydrogenation completely converts back to iron, leaving behind the unreacted graphitic carbon. The reaction product of hydrogenation, methane, was confirmed with a residual gas analyzer (Extorr XT100 RGA). Based on the amount of hydrogen consumed, it was calculated that ~12% of the total carbon must have reacted to produce methane. Since it is evident from the PXRD data that the Fe present in GP is in the form of Fe3C, we can calculate, based on the known amount of Fe added, that a maximum of ~6% of the C can be in the form of Fe3C. This means that next to graphite and Fe3C, yet another form of carbon must be present (amounting to ~6% of all C), which also reacts to produce methane during the hydrogenation reaction. The most likely candidate is filamentous carbon (Kock et al. Reference Kock, De Bokx, Boellaard, Klop and Geus1985). Although interesting by itself, we did not investigate the exact structural form of carbon in the samples further, as it was deemed unnecessary for the proposed study.
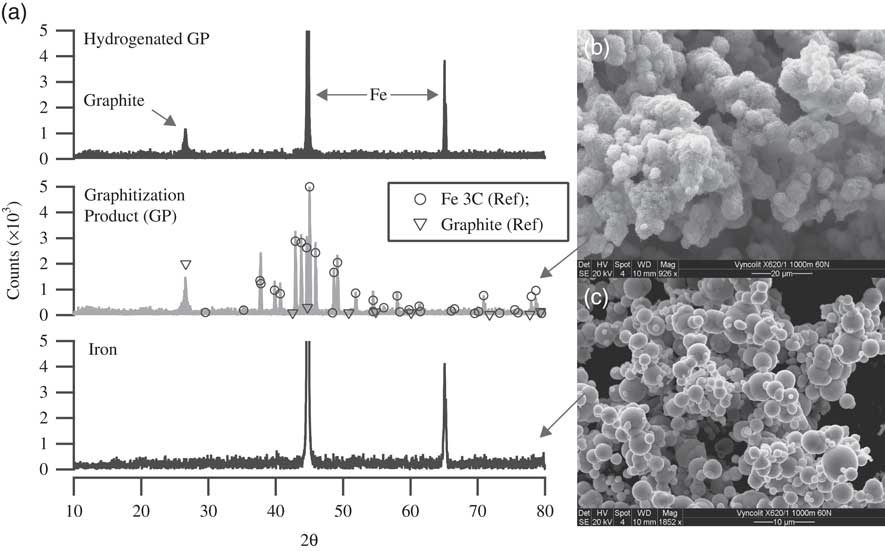
Figure 5 (a) Powder X-ray diffraction (PXRD) pattern of iron, graphitization product (GP), and GP after hydrogenation. GP primarily contains carbon in the form of graphite and iron carbide (Fe3C) as indicated by the PXRD pattern. Following hydrogenation at 600°C, Fe3C in GP is converted back to Fe, releasing methane. SEM images of (b) GP and (c) Fe powder (Alfa Aesar, 325 mesh).
As is seen in Figure 2, the first eight blocks yield an excess of ~25 counts above the mean accumulated counts from the rest of the measurement. We can thus calculate, based on the total “target surface to count detection” efficiency of our AMS instrument of ~1%, that ~0.04 µg modern carbon must have contaminated the surface in order to produce the additional counts. Similarly, as observed from the other storage experiments shown in Figure 4, targets stored in storage condition 2 have ~200 excess counts accumulated over the whole measurement when compared to the freshly prepared targets. This would correspond to ~0.35 µg C accumulated during the storage period. This accumulated carbon is not necessarily present on the surface only, but, as is clearly demonstrated in Figure 3, storage condition 3 is capable of gradually percolating inside the sample matrix, leading to an overall increase in the observed counts.
During our extensive literature review, widely around this subject, we discovered recently that the presence of a thin layer of carbonaceous material leading to surface contamination is a phenomenon well known in the field of surface science, as adventitious carbon (AC). AC accumulation occurs on all air-exposed surfaces and is almost inevitable. In the fields of material science, this layer of unwanted contaminants, including AC, on a substrate surface is generally removed by sputter-etching with argon ions, by exposing the surface to photons from a xenon excimer lamp, or by the RCA cleaning procedure (developed by Werner Kern at the Radio Corporation of America), which is a multistep, wet cleaning procedure (Kern and Puotinen Reference Kern and Puotinen1970). Unfortunately, none of these cleaning methods is practically suitable for decontaminating the target surface.
In addition to the experiments described herein, we also performed several similar storage tests with commercially available high-purity graphite rods (Alfa Aesar, 99.9995% and Nilaco, 99.9995%; 14C activity in both ~0.2 pMC) and found no significant uptake of adventitious carbon on the graphite surface. As mentioned previously and shown in Figure 5a, we did not detect any residual Fe oxides in the bulk GP (if any, their concentrations must thus be far below the detection limits). But, as shown by Miller et al. (Reference Miller, Biesinger and McIntyre2002), a clean iron surface produces, after exposure to CO2, a thin oxide layer on iron along with a carbonaceous layer mainly in the form of polymeric carbon. Also described in Miller et al. (Reference Miller, Biesinger and McIntyre2002) is an attempt to enrich the iron surface with 13C by exposure to 13CO2 (99% in 13C). This attempt failed to show any enrichment in the 13C content of the AC layer. The authors suggest that this might be caused by considerable dilution of their original pure 13C-labeled CO2 by exchange with the much larger reservoir of unlabeled CO2 adsorbed on the chamber. The results shown in this article make clear that 14C labeled CO2 can certainly contaminate a target surface, showing that CO2 present around the target surface is definitely a source of AC and probably the most important one. Since we have not performed any storage tests with hydrocarbons (e.g. methane containing varying levels of 14C), we cannot comment on the efficiency and the extent of contamination of those substances. As their concentrations are many orders of magnitudes smaller, it would be highly surprising if they would play a role at all. Likewise, the concentration of VOCs in a laboratory may be higher than in outside air due to the use of solvents, but it would still be far below the abundance of CO2.
We also investigated the possible nature of the attachment of AC on the target surface. It is certainly possible that the initial extra counts observed during the measurements could arise from loosely adsorbed contaminants, which upon sputtering gradually escape and produce the additional counts. Thus, to differentiate between loosely adsorbed contaminants and chemisorbed contaminants, we heated (80°C) a set of five contaminated targets under vacuum for 4 hr. The samples were left in vacuum for approximately 12 hr, and then the container was filled with nitrogen at 1100 mbar. The container was opened just before the targets were placed inside the AMS sample chamber. The results showed no improvement in the level of acquired contamination when compared to a similar set of five untreated targets. These results reinforce the fact that the attachment of the carbonaceous layer on the target is through chemisorption and not just loosely adsorbed.
CONCLUSIONS
Through a series of experiments, we learned that the level of acquired contamination is very much dependent on the type of environment with which the sample is in contact. The level of contamination furthermore depends heavily on the form in which the samples are stored, i.e. the stored pressed targets are more vulnerable to contamination than the graphite powder. The contamination on stored graphite powder is barely visible when stored in an atmosphere spiked with contemporary CO2 during an experimented period of ~10 days, whereas the pressed targets are considerably contaminated. With enriched 14CO2-spiked laboratory air, even powder graphite samples did show a noticeable contamination uptake, while the pressed targets were indeed contaminated to a very large extent. This also reinforces the fact that the contamination is indeed real and not just a detector artifact. Perhaps the most important finding was that a very similar phenomenon is known in the field of material science, where they observe growth of a carbonaceous layer on all air-exposed samples, an apparently unavoidable effect that is known as adventitious carbon. This phenomenon might very well explain our storage test results. The pressed targets, when exposed to air, acquire a thin layer of adventitious carbon on the surface, which is visible during the initial part of the measurement. As measurement progresses, the layer of adventitious carbon is removed by the sputtering process, revealing the cleaner background material. Still, as indicated by the tests performed with enriched CO2, the contamination of the pressed targets is not entirely limited to the surface but also affects the bulk, probably through diffusion. The stored graphite powder shows less acquired contamination, but it is very likely that also on the powder an adventitious carbon layer builds up. However, the sample is mixed well by stirring before pressing it, and this mixes the adventitious carbon layer into the sample matrix, thus diluting the effect. Still, long storage of graphite powder will contaminate the sample and lead to higher background values, even though this is hard to identify since the contamination is well mixed throughout the sample. From the results presented in Miller et al. (2010), it is evident that the process of contamination leading to a buildup of a thin carbonaceous layer is always accompanied by an iron oxide layer. Through our experiments, we also observe that in contrast to the graphitization product, a graphite rod alone fails to show a surface carbonaceous buildup, stored in similar conditions. It may be possible that this uptake of CO2 leading to the production of the AC layer is occurring through electrochemical reduction of CO2 in the presence of Fe and water vapor. We have also observed that, when a graphite rod (which normally is immune to contamination) is left in open air after it has been measured in the AMS, it shows a buildup of a carbonaceous layer, probably mediated through the deposited Cs on the surface.
This brings us to conclude that this process of surface contamination is, to a certain extent, inevitable. Although there are measures that can be taken to minimize the level of contamination, none will completely avoid it. Learning from the experience of the surface science community, the best recipe seems to be to store samples in the form of graphite powder, in a container filled with a dry and pure N2 or Ar atmosphere, and if possible only for a limited period of time. Press the samples only when the instrument is ready for measurement. Once pressed, the samples must be transferred to the AMS sample chamber as soon as possible. As performed in most laboratories, the target surface should be sputtered clean before every measurement. This step of sputter-cleaning must be combined with the whole measurement procedure by adding some initial sputtering time (in our case a set of 8 or 16 blocks), the data of which must be excluded during the data analysis. In light of the findings of this work, we will change our cleaning approach accordingly. Additional measures to avoid the adventitious carbon, such as pressing and transporting the samples in a CO2-free, dry atmosphere, are very cumbersome, and will most likely not lead to the complete avoidance of the adventitious carbon (as this will even grow in the vacuum of the source chamber of the accelerator).
The implications of such surface contamination are of course not limited to background materials: all samples suffer from such a contamination, but it is mostly not noticeable. Still, sputtering a whole batch of samples, including backgrounds, unknowns, and reference materials, is the best strategy. For very small samples, the effects aggravate. Since the graphitization tube and the iron powder are generally exposed to laboratory air before graphitization, they too carry an adventitious carbon layer, which could well become part of the modern carbon contamination (MCC) (Santos et al. Reference Santos, Southon, Griffin, Beaupre and Druffel2007; de Rooij et al. Reference de Rooij, van der Plicht and Meijer2010). It is therefore important to chemically remove this source of MCC for further reduction of the total accumulated contamination. The AC present on the reactor surface and on the iron powder may be removed by oxidation with O2 followed by reduction with H2 at 600°C before starting the graphitization step, although the effectiveness is yet to be verified.
The AC contamination on samples can be avoided if the samples are introduced as CO2 directly into the ionization chamber of the AMS. Indeed, experience with especially small samples shows lower levels of contamination when using such a gas source (Ruff et al. Reference Ruff, Szidat, Gaggeler, Suter, Synal and Wacker2010). Development of more efficient gas ion sources for AMS, among others, might thus improve the dynamic range of detection and make measurements of samples older than 50,000 yr possible. On the other hand, gas sources at the moment can only handle a limited amount of sample CO2; therefore, counting statistics will be very limited for old samples. Now that we have unambiguously revealed one of the sources of contamination, the combination of careful sample and target handling (meaning basically fast throughput) and systematic sputtering of all targets might also lead to an effectively lower background, and thus to more reliable measurement of the oldest samples.
ACKNOWLEDGMENTS
We would like to express our sincere gratitude to our colleagues at the Centre for Isotope Research, especially Fsaha Ghebru, Dicky van Zonneveld, Trea van Dijk-Dijkstra, and Henk Jansen for their commitment and constant support with preparation of the samples and with useful discussions. We also thank Panteha Bolourinejad for her help with the SEM imaging and EDXS measurements, and Jacob Baas for the PXRD measurements. We would also like to thank the two anonymous reviewers for their constructive and valuable comments.