


INTRODUCTION
Radiocarbon (14C) dating of lime mortar is a method contributing to absolute dating in history and archaeology (Hale et al. Reference Hale, Heinemeier, Lancaster, Lindroos and Ringbom2003; Marzaioli et al. Reference Marzaioli, Lubritto, Nonni, Passariello, Capano and Terrasi2011; Ortega et al. Reference Ortega, Zuluaga, Alonso-Olazabal, Murelaga, Insausti and Ibanez-Etxeberria2012; Ringbom et al. Reference Ringbom, Lindroos, Heinemeier and Sonck-Koota2014). Conclusive 14C dating of a mortar sample determines the event of mortar hardening, which relates to the time of construction (Labeyrie and Delibrias Reference Labeyrie and Delibrias1964). For archaeological sites with mortared stone structures, mortar can be abundant and in a context that can be associated with the site’s historical buildings (Heinemeier et al. Reference Heinemeier, Ringbom, Lindroos and Sveinbjornsdottir2010). Besides lime mortar, the presented 14C methodologies are relevant for further anthropogenic carbonates such as ash, lime plaster and lime concrete (Toffolo et al. Reference Toffolo, Regev, Mintz, Poduska, Shahack-Gross, Berthold, Miller and Boaretto2017, Reference Toffolo, Regev, Mintz, Kaplan-Ashiri, Berna, Dubernet, Yan, Regev and Boaretto2020). This study’s samples are lime mortars, and the materials and methods section explains the selection of samples.
Production of lime mortar involves firing limestone, mainly made of calcite (CaCO3), at temperatures near or above 900°C, where it thermally decomposes to form quicklime (CaO). The quicklime is slaked with water to produce slaked lime (Ca(OH)2). Finally, one mixes the slaked lime with an aggregate, typically sand, and wet mortar is ready to be applied as filling material between stones of the structure to be built. As wet mortar hardens, the contained slaked lime consumes atmospheric CO2 and binds it as CaCO3, see Equation (1). In doing so, the CaCO3 of lime mortar binder stores the atmospheric 14CO2 signal from the time of hardening, and this can potentially be 14C dated (Labeyrie and Delibrias Reference Labeyrie and Delibrias1964; Stuiver and Smith Reference Stuiver and Smith1965; Baxter and Walton Reference Baxter and Walton1970).
 $$\rm Ca{\left( {OH} \right)_2}(s) + C{O_2}(g)\mathop \to \limits^{} CaC{O_3}(s) + {H_2}O(l)$$
14C dating of lime mortar has challenges such as geological carbonate, recrystallization, fire damage, delayed hardening and layered double hydroxide compounds (Labeyrie and Delibrias Reference Labeyrie and Delibrias1964; Stuiver and Smith Reference Stuiver and Smith1965; Baxter and Walton Reference Baxter and Walton1970; Sonninen and Jungner Reference Sonninen and Jungner1989; Heinemeier et al. Reference Heinemeier, Jungner, Lindroos, Ringbom, von Konow and Rud1997; Artioli et al. Reference Artioli, Secco, Addis and Bellotto2017; Ricci et al. Reference Ricci, Secco, Marzaioli, Terrasi, Passariello, Addis, Lampugnani and Artioli2020). Geological carbonate is several orders of magnitude older than the 14C half-life, and thus contains essentially no 14C atoms. Contamination with geological carbonate can shift a mortar’s 14C concentration below the hardening’s 14C concentration. During production of mortar, the sand used as aggregate may contain grains of limestone, or limestone fragments may survive an incomplete burning of lime. In these ways, a mortar sample may have an inherent geological carbonate contamination. Recrystallization, fire damage, delayed hardening and layered double hydroxide compounds can shift a mortar’s 14C concentration above the hardening’s 14C concentration. In the presence of water, calcium carbonate is not entirely stable, and a mortar’s binder may recrystallize and incorporate young CO2 from the atmosphere. Fire damage may cause de-carbonation followed by re-activation of the binder and capture of new atmospheric CO2 (Heinemeier et al. Reference Heinemeier, Ringbom, Lindroos and Sveinbjornsdottir2010; Lindroos et al. Reference Lindroos, Regev, Oinonen, Ringbom and Heinemeier2012). Delayed hardening can happen, if mortar has low permeability for CO2 or if samples come from deeper parts in a construction. It introduces a delay between the time of construction and the time of hardening, and it can leave unreacted calcium hydroxides (portlandite) so the sample is alkaline and absorbs modern CO2 when sampled (Sonninen and Jungner Reference Sonninen and Jungner1989; Heinemeier et al. Reference Heinemeier, Jungner, Lindroos, Ringbom, von Konow and Rud1997; Michalska et al. Reference Michalska, Czernik and Goslar2017). Layered double hydroxide (LDH) compounds can form from magnesium phases in dolomitic lime mortar and ancient hydraulic mortars such as pozzolana and cocciopesto (Massazza Reference Massazza and Hewlett2003; Ponce-Anton et al. Reference Ponce-Anton, Ortega, Zuluaga, Alonso-Olazabal and Solaun2018; Ricci et al. Reference Ricci, Secco, Marzaioli, Terrasi, Passariello, Addis, Lampugnani and Artioli2020). LDHs can exchange carbonate anions with the atmosphere throughout the mortar’s life and introduce young carbon dioxide (Artioli et al. Reference Artioli, Secco, Addis and Bellotto2017; Ponce-Anton et al. Reference Ponce-Anton, Ortega, Zuluaga, Alonso-Olazabal and Solaun2018; Ricci et al. Reference Ricci, Secco, Marzaioli, Terrasi, Passariello, Addis, Lampugnani and Artioli2020). This text uses the term, late-in-formation pyrogenic carbonate, to collectively refer to carbonate associated with recrystallization, fire damage, delayed hardening, alkalinity or LDHs.
Since the 1960s, the 14C community has researched lime mortar as a material for 14C dating (Labeyrie and Delibrias Reference Labeyrie and Delibrias1964; Stuiver and Smith Reference Stuiver and Smith1965; Baxter and Walton Reference Baxter and Walton1970; Folk and Valastro Reference Folk and Valastro1976). In the 1990s and 2000s the sequential dissolution method develops, and it applies a single injection of 85% phosphoric acid to release the sample’s carbonate as CO2. Extraction of CO2 happens in multiple fractions throughout dissolution, and several fractions are 14C dated by accelerator mass spectrometry (AMS) (Van Strydonck et al. Reference Van Strydonck, Dupas, Dauchotdehon, Pachiaudi and Marechal1986; Heinemeier et al. Reference Heinemeier, Jungner, Lindroos, Ringbom, von Konow and Rud1997; Ringbom et al. Reference Ringbom, Lindroos, Heinemeier and Sonck-Koota2014). Sequential dissolution is explained further in the associated subsection in materials and methods. Here conclusive dating results follow from conclusiveness criteria that assert agreement among multiple CO2 fractions (Heinemeier et al. Reference Heinemeier, Ringbom, Lindroos and Sveinbjornsdottir2010; Lindroos et al. Reference Lindroos, Ringbom, Kaisti, Heinemeier, Hodgins and Brock2011; Ringbom et al. Reference Ringbom, Lindroos, Heinemeier and Sonck-Koota2014). The discussion section describes conclusiveness criteria further. Heinemeier et al. (Reference Heinemeier, Ringbom, Lindroos and Sveinbjornsdottir2010) compiled a successful study of lime mortars from the interior of Medieval churches. Here, 124 out of 150 samples were conclusive, and 75 out of 79 samples agreed with independent age control. There are other important approaches to 14C dating of pyrogenic carbonates, and some are based on separation of a suitable dating fraction, e.g., by density separation, cryogenic-breaking, ultrasound, suspension, sedimentation or thermal treatment (Marzaioli et al. Reference Marzaioli, Lubritto, Nonni, Passariello, Capano and Terrasi2011; Ortega et al. Reference Ortega, Zuluaga, Alonso-Olazabal, Murelaga, Insausti and Ibanez-Etxeberria2012; Toffolo et al. Reference Toffolo, Regev, Mintz, Poduska, Shahack-Gross, Berthold, Miller and Boaretto2017; Ponce-Anton et al. Reference Ponce-Anton, Ortega, Zuluaga, Alonso-Olazabal and Solaun2018; Ricci et al. Reference Ricci, Secco, Marzaioli, Terrasi, Passariello, Addis, Lampugnani and Artioli2020; Toffolo et al. Reference Toffolo, Regev, Mintz, Kaplan-Ashiri, Berna, Dubernet, Yan, Regev and Boaretto2020).
Mortar is a challenging material to 14C date, and sequential dissolution and other preparation methods occasionally obtain inconclusive results, especially when the above challenges are abundant (Lichtenberger et al. Reference Lichtenberger, Lindroos, Raja and Heinemeier2015; Hajdas et al. Reference Hajdas, Lindroos, Heinemeier, Ringbom, Marzaioli, Terrasi, Passariello, Capano, Artioli, Addis, Secco, Michalska, Czernik, Goslar, Hayen, Van Strydonck, Fontaine, Boudin, Maspero, Panzeri, Galli, Urbanova and Guibert2017; Michalska et al. Reference Michalska, Czernik and Goslar2017; Ponce-Anton et al. Reference Ponce-Anton, Ortega, Zuluaga, Alonso-Olazabal and Solaun2018).
Recently, there has been an interest in sample preparation by thermal decomposition for pyrogenic calcium carbonate, such as ash or lime mortar (Toffolo et al. Reference Toffolo, Regev, Mintz, Poduska, Shahack-Gross, Berthold, Miller and Boaretto2017; Ricci et al. Reference Ricci, Secco, Marzaioli, Terrasi, Passariello, Addis, Lampugnani and Artioli2020; Toffolo et al. Reference Toffolo, Regev, Mintz, Kaplan-Ashiri, Berna, Dubernet, Yan, Regev and Boaretto2020). Thermal decomposition was actually the initial method used by Labeyrie and Delibrias (Reference Labeyrie and Delibrias1964), but soon after acid hydrolysis became more prevalent (Stuiver and Smith Reference Stuiver and Smith1965). The authors of this article have most often prepared mortar samples by sequential dissolution. Inspired by recent work, sample preparation by thermal decomposition revisits several challenging mortar samples. This contributes to methodological development of thermal decomposition as a preparation method for mortar dating. More broadly, it contributes to expanding the methods available to mortar dating, which may improve the conclusiveness when encountering the challenges described above. For example, sequential dissolution obtained inconclusive results for nearly all samples presented in this study, and this motivates other preparation methods.
MATERIALS AND METHODS
Samples
The samples come from Åbo Akademi’s collection. There are three priorities when choosing samples. First, samples must have a known historical context such that results from sample preparation can be evaluated. The actual construction time is not known from historical sources, but previous dating has yielded ages that fit into the historical context, see Table 1. Second, samples must have one of the recurring challenges described in the introduction, so different preparation methodologies can investigate different challenges. Third and last, samples must have previous dating by sequential dissolution to compare with thermal decomposition.
Table 1 Samples, aliquots, and 14C dates. It was not possible to look up the sequential dissolution mass of the samples dated before 2008. Mortar samples with TD in the sample run no. column were prepared with TD, and similarly for SQ and P+SQ. SQ 14C dates taken from Lindroos et al. (Reference Lindroos, Ringbom, Kaisti, Heinemeier, Hodgins and Brock2011, Reference Lindroos, Regev, Oinonen, Ringbom and Heinemeier2012, Reference Lindroos, Ringbom, Heinemeier, Hajdas and Olsen2020a, Reference Lindroos, Heinemeier, Ringbom, Daugbjerg and Hajdas2020b), Ringbom et al. (Reference Ringbom, Hale, Heinemeier, Lindroos and Brock2006), and Lichtenberger et al. (Reference Lichtenberger, Lindroos, Raja and Heinemeier2015). δ13C values marked with an * were measured by AMS.

To investigate geological carbonate’s influence on 14C concentration in mortar this study presents mortar samples TTK005 and TTK006 from Turku cathedral in SW Finland and J13-ESM-1 from Jerash, Jordan.
The sample TTK006 comes from the pentagonal choir of Turku cathedral. Mortar dating was done in 2007, and results are presented in Lindroos et al. (Reference Lindroos, Ringbom, Kaisti, Heinemeier, Hodgins and Brock2011, Reference Lindroos, Regev, Oinonen, Ringbom and Heinemeier2012, Reference Lindroos, Ringbom, Heinemeier, Hodgins, Sonck-Koota, Sjoberg, Lancaster, Kaisti, Brock, Ranta, Caroselli and Lugli2018). The sample was problematic because of abundant marble contamination, which may have masked other types of contamination. Sample TTK005, see Table 1, is from the same construction phase, and it has been dated in five CO2 fractions from the bulk mortar and three CO2 fractions from a lime lump within it (Lindroos et al. Reference Lindroos, Ringbom, Heinemeier, Hodgins, Sonck-Koota, Sjoberg, Lancaster, Kaisti, Brock, Ranta, Caroselli and Lugli2018). Sample TTK004 and TTK004Li are likewise a bulk mortar and a lime lump within it and taken close to sample TTK006. They were dated in 2017 in Zürich in 3 CO2 fractions each (Table 1), and the results have not been published earlier. The Pentagonal Choir is part of the original cathedral inaugurated in 1300 AD (Gardberg et al. Reference Gardberg, Simo and Welin2000). It may have been renovated after destruction of the cathedral in 1318 AD (Gardberg et al. Reference Gardberg, Simo and Welin2000; Lindroos et al. Reference Lindroos, Ringbom, Heinemeier, Hodgins, Sonck-Koota, Sjoberg, Lancaster, Kaisti, Brock, Ranta, Caroselli and Lugli2018).
The sample J13-ESM-1 comes from a water pipe cover in the ancient city Jerash, and Lichtenberger et al. (Reference Lichtenberger, Lindroos, Raja and Heinemeier2015) discuss the sample further. Mortar dating with sequential dissolution was tried in 2015, and it proved difficult because of limestone aggregate. Lichtenberger et al. (Reference Lichtenberger, Lindroos, Raja and Heinemeier2015) reports a charcoal sample embedded in the mortar, usable for age control and 14C dated to (1723 ± 25) 14C years BP.
To investigate the contribution to a mortar’s 14C concentration from late-in-formation pyrogenic carbonate, this study presents mortar sample Kastel09 from Kastelholm castle in SW Finland, lime lump Kimito004Li from Kimito (Kemiö in Finnish) church in SW Finland and mortar sample Merida003 from Mérida amphitheater in W Spain.
Kastelholm is first mentioned in historical documents in 1388 AD (Hausen Reference Hausen1910). A trial to date the structurally oldest mortar with radiometric methods was made in 1985 (Sonninen and Jungner Reference Sonninen and Jungner1989). Lindroos et al. (Reference Lindroos, Ringbom, Heinemeier, Hajdas and Olsen2020a) performed 14C dating prepared by sequential dissolution of sample Kastel09, and they present calendar date spans 1285–1312 AD with 41.5% and 1359–1388 AD with 53.9% probability. The age span 1285–1312 AD is interesting, because the nearby church of Jomala is from the 13th century AD (Ringbom et al. Reference Ringbom, Heinemeier, Lindroos and Brock2011). Other samples show late-in-formation pyrogenic carbonate either from alkalinity or fire damage. As an example of this sample Kastel10 is presented, which Lindroos et al. (Reference Lindroos, Ringbom, Heinemeier, Hajdas and Olsen2020a) also dated with sequential dissolution. We make thermal decomposition preparation of sample Kastel09, which is the least alkaline and has the least inhomogeneous CO2 fractions by sequential dissolution.
Sample Kimito004Li is a lime lump in a mortar from the attic of the sacristy in Kimito church, and it yielded an inconclusive result with sequential dissolution. On stylistic grounds, the famous mason Petrus Murator is considered the mason who vaulted the nave of Kimito church (Nikula Reference Nikula1975). It is documented that Petrus Murator was payed for finishing the vaulting of Turku cathedral in 1466 AD (Hausen Reference Hausen1890; Nikula Reference Nikula1973), and the nave of Kimito church was most likely vaulted before 1466 AD (Nikula Reference Nikula1975). Structurally, the sacristy is the oldest part of Kimito church, and it is stylistically attributed to the first half of the 15th century (Nikula Reference Nikula1975). 14C dating of charred wood planks from the nave yielded variable ages from 889 AD to 1620 AD, see samples Kimito002W, Kimito003W and Kimito013W in Table 1. Furthermore, there are coin-finds from the early 14th century AD at Kimito church (Nikula Reference Nikula1975).
The Mérida Amphitheatre is either Augustan, early 1st century AD, or Flavian, late 1st century AD (Capello and Galán Reference Capello and Galán1995; Mateos Reference Mateos2001). Mortar dating results from Mérida, including sample Merida003, have been published and suggest a late Flavian age (Hale et al. Reference Hale, Heinemeier, Lancaster, Lindroos and Ringbom2003; Ringbom et al. Reference Ringbom, Hale, Heinemeier, Lindroos and Brock2006; Lindroos et al. Reference Lindroos, Heinemeier, Ringbom, Daugbjerg and Hajdas2020b). The Flavian dynasty spans from 69 AD to 96 AD (Jones et al. Reference Jones and Milns2002). The Mérida samples are very hard, have dolomitic chemistry, delayed hardening and shows abundant late-in-formation pyrogenic carbonates that dissolves before the binder carbonate (Lindroos et al. Reference Lindroos, Heinemeier, Ringbom, Daugbjerg and Hajdas2020b).
Sample Pretreatment
The sample pretreatment starts by gently crushing a sample with pliers (Heinemeier et al. Reference Heinemeier, Ringbom, Lindroos and Sveinbjornsdottir2010; Lichtenberger et al. Reference Lichtenberger, Lindroos, Raja and Heinemeier2015; Lindroos et al. Reference Lindroos, Ringbom, Heinemeier, Hodgins, Sonck-Koota, Sjoberg, Lancaster, Kaisti, Brock, Ranta, Caroselli and Lugli2018). The crushing is intentionally careful, i.e. not using too much force, as this can produce small grains of aggregate material, which may contain contaminating limestone (Heinemeier et al. Reference Heinemeier, Ringbom, Lindroos and Sveinbjornsdottir2010). Sieves with meshes from 100 to 500 µm dry sieve the mortar into several grain size fractions (Van Strydonck et al. Reference Van Strydonck, Dupas, Dauchotdehon, Pachiaudi and Marechal1986). The dry sieving takes approximately 20 minutes using a mechanical sieve shaker, and the shaking promotes further crumbling of soft binder material. The grain size fraction <100 µm is wet sieved into several fractions from <20 µm to 100 µm. According to Heinemeier et al. (Reference Heinemeier, Ringbom, Lindroos and Sveinbjornsdottir2010), grain size fractions <100 µm filter out large aggregate grains that may be contaminants, and this study uses these grain size fractions for thermal decomposition and sequential dissolution.
Characterization Methods
Alkalinity screening, cathodoluminescence microscopy and thermal gravimetric analysis, are used to characterize the mortar samples. The characterization methods are presented below.
Alkalinity Screening
Alkalinity is an indicator for late-in-formation pyrogenic carbonates (Labeyrie and Delibrias Reference Labeyrie and Delibrias1964; Ringbom et al. Reference Ringbom, Heinemeier, Lindroos and Brock2011; Lichtenberger et al. Reference Lichtenberger, Lindroos, Raja and Heinemeier2015). Roughly 10 mL of deionized water suspends roughly 200 mg of the 300–500 µm grainsize fraction. Strips of pH indicator paper and two drops of 2% phenolphthalein in alcohol assess the samples’ alkalinity. For alkaline samples, the phenolphthalein gives a strong purple color after 5 minutes, and alkaline samples are usually rejected for AMS dating. However, this study works with some alkaline samples to study late-in-formation pyrogenic carbonates.
Cathodoluminescence Microscopy
The 46–75 µm grain size fraction is characterized with a stereomicroscope combined with a Cambridge Image Technology Ltd (CITL) CL8200 MK4 cold cathode cathodoluminescence (CL) device and a camera (Marshall Reference Marshall1988). In CL mineral grains with luminescence light up in specific colors that enable mineral identification, e.g., limestone and marble are often bright orange-red (Götze Reference Götze2012; Al-Bashaireh Reference Al-Bashaireh2013). If abundant grains of limestone or marble are identified by CL the sample may have problems with geological carbonate. Such samples are usually rejected for AMS dating, but this study works with some samples with geological carbonate. Though not done in this study, CL with a polished sample surface can study late-in-formation pyrogenic carbonates (Marshall Reference Marshall1988; Götze Reference Götze2012).
Thermal Gravimetric Analysis
Before thermal decomposition, samples are characterized with thermal gravimetric analysis (TGA) (Bakolas et al. Reference Bakolas, Biscontin, Moropoulou and Zendri1998; Toffolo et al. Reference Toffolo, Regev, Mintz, Poduska, Shahack-Gross, Berthold, Miller and Boaretto2017; Ponce-Anton et al. Reference Ponce-Anton, Ortega, Zuluaga, Alonso-Olazabal and Solaun2018). The analysis takes around 10 mg of the grainsize fraction 46–75 µm, and places it in a furnace equipped with a precision scale and nitrogen atmosphere. At increased temperatures, an increasing fraction of the solid sample thermally decomposes to gaseous products. TGA measures loss of sample weight as function of temperature. This study uses the TGA instrument, Tainstruments SDT Q600, at the department of Inorganic Chemistry at Åbo Akademi University. Notice that the TGA instrument cannot collect CO2 for 14C dating, so the TGA is made on a small aliquot of the grain size fraction, and the actual thermal decomposition for 14C dating on a larger aliquot. The result from the TGA method establishes the temperature interval where a mortar sample’s carbonates thermally decompose and release CO2. This is important information when operating the temperature and CO2 collection of the thermal decomposition preparation method (explained below). The result section on TGA elaborates further on different stages of mass loss during thermal decomposition of mortar samples.
Preparation Methods
Sequential Dissolution (SQ)
This project uses the well-tried sequential dissolution (SQ) method as comparison to thermal decomposition. In short, the method works by a single injection of excessive 85% phosphoric acid on a powder prepared from the sample (Ringbom et al. Reference Ringbom, Lindroos, Heinemeier and Sonck-Koota2014; Lindroos et al. Reference Lindroos, Ringbom, Heinemeier, Hodgins, Sonck-Koota, Sjoberg, Lancaster, Kaisti, Brock, Ranta, Caroselli and Lugli2018). The pre-treatment section describes production of powders, and we use several grain size windows below 100 µm and lime lumps, see Table 1. Late-in-formation pyrogenic carbonate, binder carbonate and geological carbonate dissolve with different reaction rates and contribute differently to different CO2 fractions collected throughout the dissolution. For example geological carbonate dissolves more slowly, and its contribution increases in the later fractions of SQ. Ringbom et al. (Reference Ringbom, Lindroos, Heinemeier and Sonck-Koota2014) describe the SQ method in more detail.
Thermal Decomposition (TD)
Figure 1 illustrates the experimental setup for sample preparation with thermal decomposition (TD). The system is similar to systems used for SQ, with the laboratory furnace replacing the dissolution reactor flask (Heinemeier et al. Reference Heinemeier, Ringbom, Lindroos and Sveinbjornsdottir2010; Ringbom et al. Reference Ringbom, Lindroos, Heinemeier and Sonck-Koota2014). TD places the selected grain size fraction in a quartz tube and fixates it with a lump of quartz wool. A hose connects the quartz tube and the vacuum system. When the system’s vacuum is sufficient, the furnace slowly increases the temperature of the sample. When the preparation’s start-temperature is reached, the pressure gauge monitors the release of gaseous products from TD. Characterization by TGA establishes sample-specific start-temperatures, usually around 550–650°C, where the mortar’s carbonates start releasing CO2. Other studies report TD of anthropogenic carbonate starting in the range 500–550°C (Toffolo et al. Reference Toffolo, Regev, Mintz, Poduska, Shahack-Gross, Berthold, Miller and Boaretto2017; Ricci et al. Reference Ricci, Secco, Marzaioli, Terrasi, Passariello, Addis, Lampugnani and Artioli2020). Chemistry literature describes the release of CO2 by TD of calcium carbonate with Equation (2), and that it happens at temperatures in the range 680–875°C (Murthy et al. Reference Murthy, Marish, Rajanandam and Kumar1994; Rao Reference Rao1996; Karunadasa et al. Reference Karunadasa, Manoratne, Pitawala and Rajapakse2019):
 $\rm CaC{O_3}\left( s \right)\mathop \to \limits^{\Delta } CaO\left( s \right) + C{O_2}\left( g \right)$

Figure 1 The experimental setup for sample preparation by thermal decomposition. Figure inspired by Ringbom et al. (Reference Ringbom, Lindroos, Heinemeier and Sonck-Koota2014).
When the amount of CO2 is sufficient for AMS dating (in range 0.1 mgC–1.0 mgC), liquid nitrogen freezes out a fraction and a blowtorch seals the fraction in a glass vial. The furnace is thermostat regulated, and it holds a set temperature. As long as the sample continues to release CO2 the temperature is kept constant, and only when CO2 release stops the temperature is carefully increased to resume TD. In this way, the early fractions contain CO2 from sample phases that thermally decompose at lower temperatures, while later fractions contain CO2 from sample phases that thermally decompose at higher temperatures. This aligns with Toffolo et al. (Reference Toffolo, Regev, Mintz, Kaplan-Ashiri, Berna, Dubernet, Yan, Regev and Boaretto2020) and Ricci et al. (Reference Ricci, Secco, Marzaioli, Terrasi, Passariello, Addis, Lampugnani and Artioli2020) discussing TD of different mortar phases in different temperature ranges, for example organic phase up to 500°C, LDH phase around 500–550°C, pyrogenic carbonates (e.g. lime mortar binder) in the range 500–650°C and marble in the range 700–800°C. In our TD preparation a typical start-temperature is around 550–650°C, the temperature increments are around 10–20°C, it takes 5–15 min to produce a fraction, and a sample is exhausted somewhere between 800–900°C. As a variation sample Merida003 has start-temperature at room temperature, see the results section.
Calcite backgrounds are also thermally decomposed. The backgrounds are compiled to a background correction used for TD 14C determinations (Donahue et al. Reference Donahue, Linick and Jull1990; Brown and Southon Reference Brown and Southon1997; Toffolo et al. Reference Toffolo, Regev, Mintz, Kaplan-Ashiri, Berna, Dubernet, Yan, Regev and Boaretto2020).
Preheating Followed by Sequential Dissolution (P+SQ)
Ricci et al. (Reference Ricci, Secco, Marzaioli, Terrasi, Passariello, Addis, Lampugnani and Artioli2020) discuss a thermal treatment at 550°C to break down the LDH structure and release the associated carbonate anions, e.g. in a magnesium-rich mortar. Inspired hereof, preheating followed by sequential dissolution (P+SQ) is attempted for sample Merida003, which is a dolomitic mortar somewhat similar to the magnesium-rich samples discussed by Ricci et al. (Reference Ricci, Secco, Marzaioli, Terrasi, Passariello, Addis, Lampugnani and Artioli2020). The sample is preheated to 620°C and the temperature is maintained for half an hour. This temperature was chosen for sample Merida003, because it is the lowest temperature producing enough CO2 from preheating for a datable fraction. The sample then cools to room temperature while still in vacuum, see Figure 1. One then breaks vacuum, quickly transfers the sample to a reactor flask in the SQ setup and reapplies vacuum. SQ then prepares the preheated sample as described in the materials and methods section on sequential dissolution.
Graphitization and AMS Dating
Graphitization reactors convert the produced CO2 fractions to graphite using hydrogen and an iron catalyst (Vogel et al. Reference Vogel, Southon, Nelson and Brown1984). A pneumatic press presses the graphite into AMS-cathodes, and they are 14C dated at Aarhus AMS Centre using the centre’s HVE 1MV accelerator (Olsen et al. Reference Olsen, Tikhomirov, Grosen, Heinemeier and Klein2017), except for samples TTK004, TTK004Li and Kimito004Li by SQ that were dated in Zürich using the MICADAS machine at the Laboratory of Ion Beam Physics (Synal et al. Reference Synal, Stocker and Suter2007). For each sample multiple fractions are dated, so one can evaluate conclusiveness as described in the discussion. The online program OxCal 4.4 with the IntCal20 calibration curve calculates calendar date from 14C determinations (Bronk Ramsey Reference Bronk Ramsey2009; Reimer et al. Reference Reimer, Austin, Bard, Bayliss, Blackwell, Bronk Ramsey, Butzin, Cheng, Edwards, Friedrich, Grootes, Guilderson, Hajdas, Heaton, Hogg, Hughen, Kromer, Manning, Muscheler, Palmer, Pearson, van der Plicht, Reimer, Richards, Scott, Southon, Turney, Wacker, Adolphi, Büntgen, Capano, Fahrni, Fogtmann-Schulz, Friedrich, Köhler, Kudsk, Miyake, Olsen, Reinig, Sakamoto, Sookdeo and Talamo2020).
RESULTS
This section presents results from characterization and 14C dating of the selected samples. 14C profiles illustrate the dated CO2 fractions, and the incremental heating method in potassium-argon dating inspires the style of plotting in Figures 5–7 (Foland Reference Foland1983). Each box illustrates a 14C-dated CO2 fraction. The horizontal extent of a fraction illustrates the cumulative CO2 fraction released prior to the fraction and after the fraction. The vertical extend of a fraction illustrates the 68.3% confidence interval of the determined F14C (14C age = –8033·ln F14C). Text annotates the temperature reached during production of the corresponding TD fraction.
Characterization
Figure 2 shows CL images screening for limestone or marble aggregate that may carry geological carbonate contamination. Figure 2B shows the CL image for sample J13-ESM-1. Unfortunately, some types of limestone at Jerash do not have the typical red-orange luminescence (Al-Bashaireh and Hodgins Reference Al-Bashaireh and Hodgins2012; Lichtenberger et al. Reference Lichtenberger, Lindroos, Raja and Heinemeier2015). Therefore, CL cannot rule out geological carbonate for sample J13-ESM-1. Alkalinity screens samples for late-in-formation pyrogenic carbonates, and Table 2 summarizes the characterization results for CL and alkalinity. There are potential problems with most samples, and usually one would reject these for AMS dating. However, the aim is to investigate TD for recurring challenges in mortar dating.

Figure 2 CL images for the samples TTK006, J13-ESM-1, Kastel09, Kastel10, Kimito004Li, and Merida003. A: TTK006, 46–75 µm. Brown-grey binder calcite and orange marble calcite. The blue grain is quartz. B: J13-ESM-1, 46–75 µm. The sample has no luminescence. C–D: Kastel09 and Kastel10, respectively, 46–75 µm. Brown grains are binder calcite and red ones are limestone. Blue is quartz and green is feldspar. E: Kimito004Li, crushed lime lump. Dark red is binder calcite. F: Merida003, 46–75 µm, with marble splinter yellow and dolomite red. Blue, quartz and green feldspar (and occasionally xenotime).
Table 2 Results from sample characterization. Alkaline mortars may have problems with late-in-formation pyrogenic carbonates. Abundant bright yellow-orange-red grains are a marker for limestone and marble that can carry geological carbonate. CL for sample J13-ESM-1 cannot rule out geological carbonate, because on non-luminescent limestone at Jerash (Lichtenberger et al. Reference Lichtenberger, Lindroos, Raja and Heinemeier2015). The sample Kimito004Li was too small for alkalinity test.

Figure 3 shows the results from TGA, where samples loose mass through TD. The samples show drying of pore space water and water of crystallization for temperature below 200°C (Bakolas et al. Reference Bakolas, Biscontin, Moropoulou and Zendri1998; Paama et al. Reference Paama, Pitkänen, Rönkkömäki and Perämäki1998). From 200–600°C, the TGA curves decrease further because of decomposition of OH- groups, which may come from unhardened slaked lime or hydraulic mortar minerals, e.g. calcium silicate hydrate (Dodson Reference Dodson1990; Massazza Reference Massazza and Hewlett2003; Ponce-Anton et al. Reference Ponce-Anton, Ortega, Zuluaga, Alonso-Olazabal and Solaun2018). Near 640–650°C the TGA curves start a dramatic loss of weight, and much of this is attributed to TD of CaCO3 (Bakolas et al. Reference Bakolas, Biscontin, Moropoulou and Zendri1998; Paama et al. Reference Paama, Pitkänen, Rönkkömäki and Perämäki1998; Ponce-Anton et al. Reference Ponce-Anton, Ortega, Zuluaga, Alonso-Olazabal and Solaun2018). It is interesting that this loss of mass starts below the temperature interval (680–875°C) reported for TD of CaCO3 in chemistry literature, and the discussion elaborates further on this. Just below 800°C, the samples’ carbonate is exhausted and decomposition ceases. The TGA curves helps decide the start-temperatures reported in the below sections on TD of selected samples.
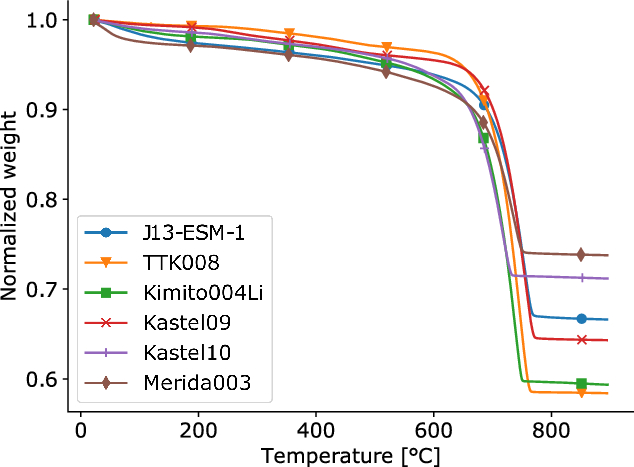
Figure 3 Results from TGA for samples J13-ESM-1, TTK008, Kimito004Li, Kastel09, Kastel10, and Merida003. Weight loss from TD of binder CaCO3 is seen from ca. 640–770°C. Pure calcite decomposing to calcium oxide has its normalized weight reduced from 1.0 to 0.56. A mortar sample may have a smaller reduction of normalized weight because of non-decomposable aggregates or hydraulic mortar minerals (Dodson Reference Dodson1990).
Thermal Decomposition Backgrounds
TD has its own background correction compiled from calcite backgrounds of various sample sizes. In Figure 4, the measured F14C values are plotted as a function of inverse sample mass, and the fitted function is used to correct TD 14C determinations (Donahue et al. Reference Donahue, Linick and Jull1990; Brown and Southon Reference Brown and Southon1997; Toffolo et al. Reference Toffolo, Regev, Mintz, Kaplan-Ashiri, Berna, Dubernet, Yan, Regev and Boaretto2020).

Figure 4 Calcite backgrounds for TD. The background correction is fitted: F14CBackground = (0.19 ± 0.6)·10–3 mgC · 1/mass + (3.2 ± 0.3)·10–3. A F14C value of 0.0030 corresponds to a 14C age of ca. 46,600 14C years BP.
Thermal Decomposition and Geological Carbonate
Figure 5A shows 14C profiles with TD and SQ for sample TTK006 from Turku Cathedral, Finland. There is also a 14C profile with SQ for sample TTK005, and the two samples are from the same wall. Interpolation of the IntCal20 curve calculates expected F14C for Turku Cathedral (Reimer et al. Reference Reimer, Austin, Bard, Bayliss, Blackwell, Bronk Ramsey, Butzin, Cheng, Edwards, Friedrich, Grootes, Guilderson, Hajdas, Heaton, Hogg, Hughen, Kromer, Manning, Muscheler, Palmer, Pearson, van der Plicht, Reimer, Richards, Scott, Southon, Turney, Wacker, Adolphi, Büntgen, Capano, Fahrni, Fogtmann-Schulz, Friedrich, Köhler, Kudsk, Miyake, Olsen, Reinig, Sakamoto, Sookdeo and Talamo2020), and this yields F14C=0.9212 ± 0.0013 for the inauguration in 1300 AD and F14C=0.9254 ± 0.0012 for the destruction in 1318 AD.

Figure 5 14C profiles for TTK006, TTK005, and J13-ESM-1, see Table 1 for further information on sample aliquots. A: TTK006 with TD and SQ, and TTK005 with SQ. The expected F14C values derive from the years 1300 AD and 1318 AD, and geological carbonate shifts many fractions to lower F14C values. The weighted average of the 1st and 2nd fractions of TTK005 (SQ) is F14C=0.9277 ± 0.0029. SQ data taken from Lindroos et al. (Reference Lindroos, Ringbom, Kaisti, Heinemeier, Hodgins and Brock2011, Reference Lindroos, Regev, Oinonen, Ringbom and Heinemeier2012). B: J13-ESM-1 with TD and SQ. The charcoal sample J13-ESM-1C embedded in the mortar infers the expected F14C, and geological carbonate shift many fractions to lower F14C values. SQ data and charcoal data taken from Lichtenberger et al. (Reference Lichtenberger, Lindroos, Raja and Heinemeier2015).
The SQ profiles for TTK005 and TTK006 show decreasing F14C for later fractions, while the 1st and 2nd fractions are closer to the expected F14C. The geological carbonate identified by CL is a probable explanation for late fractions with lower F14C, see Table 2. The first minimum (3rd CO2 fraction) in the SQ profile for sample TTK005 has been interpreted as aggregate marble contamination, and the minimum defined by the last (5th) fraction as calcination residues from incomplete lime burning (Lindroos et al. Reference Lindroos, Ringbom, Heinemeier, Hodgins, Sonck-Koota, Sjoberg, Lancaster, Kaisti, Brock, Ranta, Caroselli and Lugli2018).
Figure 5A also shows TD for sample TTK006. The furnace heats sample TTK006 to 650°C, as suggested by TGA in Figure 3, and collection of fractions starts. The first temperature interval, from 650–680°C, produces too little CO2 for AMS dating. The TD 14C profile for TTK006 is also decreasing for later fractions, and it shows multiple minima and maxima as do the SQ profile of sample TTK005. All TD CO2 fractions seem affected by geological carbonate because they have lower F14C than expected.
Figure 5B shows TD and SQ of sample J13-ESM-1, a mortar-cover cast around a water pipe in Jerash in Jordan (Lichtenberger et al. Reference Lichtenberger, Lindroos, Raja and Heinemeier2015). The sample’s expected F14C=0.8070 ± 0.0025 comes from a charcoal sample embedded in the mortar (Lichtenberger et al. Reference Lichtenberger, Lindroos, Raja and Heinemeier2015). According to Al Bashaireh (Reference Al-Bashaireh2013) charcoal in mortar can be used for dating, if short-lived bushes were burned and not old wood. The first fraction of SQ and charcoal are similar in F14C, while later fractions in the SQ profile has lower F14C values. This behavior matches a sample influenced by geological carbonate. As explained in the characterization results section CL cannot rule out geological carbonate for this sample, because some types of limestone at Jerash are without a luminescence property. Yaseen et al. (Reference Yaseen, Al-Amoush, Al-Farajat and Mayyas2013) and Lichtenberger et al. (Reference Lichtenberger, Lindroos, Raja and Heinemeier2015) find limestone sand and gravel aggregate in most Jerash mortars, and this could be the case for sample J13-ESM-1. The sample was not found alkaline, so it is unlikely that late-in-formation pyrogenic carbonates are abundant, see Table 2.
For TD, the furnace heats sample J13-ESM-1 to 600°C, lower than suggested by TGA in Figure 3, and collection of fractions starts. The TD 14C profile is also decreasing in F14C for later fractions, and geological carbonate is a possible explanation. Interestingly, the first fraction of TD has a higher F14C than expected, while the first fraction of SQ has not.
Thermal Decomposition and Late-In-Formation Pyrogenic Carbonates
Figure 6A shows TD and SQ of sample Kastel09 from Kastelholm castle in Finland. Figure 6A also shows a SQ profile for sample Kastel10, and the two samples originate from the same structural unit. Interpolation of the IntCal20 curve calculates the expected F14C=0.9253 ± 0.0012 from the first written source on Kastelholm in 1388 AD (Hausen Reference Hausen1910). Allowing 10 years for construction, or a delay from construction to first written source, the year 1378 AD has expected F14C = 0.9217 ± 0.0011. Lindroos et al. (Reference Lindroos, Ringbom, Heinemeier, Hajdas and Olsen2020a) report alkalinity, fire damage and limited limestone contamination for Kastelholm mortar. CL finds few red grains in both samples, Kastel10 is alkaline, and Kastel09 is not alkaline, see Table 2. In Figure 6A, the two SQ profiles have fractions with higher F14C values than expected, and late-in-formation pyrogenic carbonate from alkalinity or fire damage is a likely explanation. Notice that higher than expected F14C mostly affects sample Kastel10, which is alkaline.

Figure 6 14C profiles for Kastel09, Kastel10 and Kimito004Li, see Table 1 for further information on sample aliquots. A: Kastel09 with TD and SQ, and Kastel10 with SQ. The expected F14C values derive from the years 1378 AD and 1388 AD. SQ data taken from Lindroos et al. (Reference Lindroos, Ringbom, Heinemeier, Hajdas and Olsen2020a). B: The weighted average of the 1st and 2nd fractions of Kastel09 (TD) is F14C = 0.9203 ± 0.0020, and this is calibrated (Bronk Ramsey Reference Bronk Ramsey2009; Reimer et al. Reference Reimer, Austin, Bard, Bayliss, Blackwell, Bronk Ramsey, Butzin, Cheng, Edwards, Friedrich, Grootes, Guilderson, Hajdas, Heaton, Hogg, Hughen, Kromer, Manning, Muscheler, Palmer, Pearson, van der Plicht, Reimer, Richards, Scott, Southon, Turney, Wacker, Adolphi, Büntgen, Capano, Fahrni, Fogtmann-Schulz, Friedrich, Köhler, Kudsk, Miyake, Olsen, Reinig, Sakamoto, Sookdeo and Talamo2020). The first written source on Kastelholm is from 1388 AD. C: TD and SQ for sample Kimito004Li. The expected F14C values derive from the years 1400 AD and 1450 AD. D: The weighted average of the 1st and 2nd fractions of Kimito004Li (TD) is F14C=0.9310±0.0019, and this is calibrated (Bronk Ramsey Reference Bronk Ramsey2009; Reimer et al. Reference Reimer, Austin, Bard, Bayliss, Blackwell, Bronk Ramsey, Butzin, Cheng, Edwards, Friedrich, Grootes, Guilderson, Hajdas, Heaton, Hogg, Hughen, Kromer, Manning, Muscheler, Palmer, Pearson, van der Plicht, Reimer, Richards, Scott, Southon, Turney, Wacker, Adolphi, Büntgen, Capano, Fahrni, Fogtmann-Schulz, Friedrich, Köhler, Kudsk, Miyake, Olsen, Reinig, Sakamoto, Sookdeo and Talamo2020). Kimito church’s sacristy is from the 1st half of the 15th century.
In TD, the furnace heats sample Kastel09 to 550°C, lower than suggested by TGA in Figure 3, and collection of CO2 fractions starts. The first temperature interval from 550–680°C, yields too little CO2 for AMS dating. Comparing with SQ profiles, the TD profile is quite flat, and no fractions have higher F14C than expected.
Figure 6C shows TD and SQ of the lime lump sample Kimito004Li from Kimito church in Finland. Interpolation of the IntCal20 curve calculates the expected F14C = 0.9317 ± 0.0012 from the year 1400 AD, which is the beginning of the 1st half of the 15th century. Likewise, the year 1450 AD, which is the end of the 1st half of the 15th century, has expected F14C = 0.9480 ± 0.0012. In Figure 6C, the SQ profile is in range of the expected F14C, but later fractions show decreasing F14C values. CL rules out geological carbonates, so a possible explanation is late-in-formation pyrogenic carbonate shifting early fractions to higher F14C. Alkalinity screening to support this is unavailable, as the lime lump was exhausted.
For TD, the furnace heats sample Kimito004Li to 600°C, lower than suggested by TGA in Figure 3, and collection of fractions starts. The TD profile is in range of the expected F14C, and more homogenous than the SQ profile.
Preheating Followed by Sequential Dissolution
In relation to preheating, we test if it is possible to produce CO2 below the start temperature suggested by TGA. Thus, TD preparation of sample Merida003 starts CO2 collection from room temperature to 620°C.
Figure 7A shows sample Merida003 with TD and SQ. Interpolation on the IntCal20 curve calculates the expected F14C = 0.7841 ± 0.0014 for the year 69 AD, which is the beginning of the Flavian dynasty, and the expected F14C = 0.7859 ± 0.0014 for the year 96 AD, which is the end of the Flavian dynasty. Early fractions in the SQ profile have higher F14C than expected. Characterization found this sample alkaline, so late-in-formation pyrogenic carbonates are a likely explanation. The TD profile starts CO2 collection from room temperature to 620°C, and all fractions have higher F14C values than expected, especially the three earliest fractions. Again late-in-formation pyrogenic carbonates are a likely explanation.

Figure 7 14C profiles for Merida003, see Table 1 for further information on sample aliquots. A: TD and SQ profiles for sample Merida003. The expected F14C values derives from the years 69 AD and 96 AD, the Flavian dynasty. Many fractions have higher F14C values than expected, probably because of alkalinity, delayed hardening or dolomitic chemistry. SQ data taken from Lindroos et al. (Reference Lindroos, Heinemeier, Ringbom, Daugbjerg and Hajdas2020b). B: SQ (repeated from 7A) and P+SQ profiles. More of the P+SQ profile is close to the expected F14C value than the SQ profile, and preheating seems to remove some late-in-formation pyrogenic carbonates. The P+SQ profile is also published in Lindroos et al. (Reference Lindroos, Heinemeier, Ringbom, Daugbjerg and Hajdas2020b).
Figure 7B shows sample Merida003 with SQ (repeated) and P+SQ (preheated to 620˚C). A considerable part of the P+SQ profile in Figure 7B is close to the expected F14C. The CO2 thermally decomposed during preheating was collected and 14C dated to F14C = 0.8437 ± 0.0049, see Table 1 for sample run no. Merida003 PSQ1.T1.
DISCUSSION
Table 2 summarizes characterization results, and this identifies potential problems with limestone, marble or alkalinity for most samples. To investigate TD for problematic mortar no samples are rejected for dating. As mention in the results section, CL cannot rule out geological carbonate for sample J13-ESM-1 because of non-luminescent limestone at Jerash. Apart from this, the sample characterization is very useful in identifying problems that enable evaluation of 14C profiles, e.g., fractions influenced by geological carbonate or late-in-formation pyrogenic carbonate.
Figure 3 shows TGA curves for mortar samples, and the dominant mass losses start around 640–650°C, which is lower than the reported start temperatures for TD of calcium carbonate, e.g., 680–700°C (Rao Reference Rao1996; Karunadasa et al. Reference Karunadasa, Manoratne, Pitawala and Rajapakse2019). This compares to Ricci et al. (Reference Ricci, Secco, Marzaioli, Terrasi, Passariello, Addis, Lampugnani and Artioli2020) and Toffolo et al. (Reference Toffolo, Regev, Mintz, Kaplan-Ashiri, Berna, Dubernet, Yan, Regev and Boaretto2020) discussing pyrogenic carbonates decomposing at lower temperatures than geological carbonates. As mentioned in materials and methods, Ricci et al. (Reference Ricci, Secco, Marzaioli, Terrasi, Passariello, Addis, Lampugnani and Artioli2020) employ a thermal treatment at 550°C to eliminate the carbonate fraction of LDHs, and this study experimented with preheating at 620°C. It may be possible to do a thermal treatment closer to the start temperature of the dominant mass loss, e.g., 640–650°C, without losing too much binder carbonate.
Figure 4 shows calcite backgrounds and the background correction for TD. The background F14C level has order of magnitude 10–3. Considering that ancient and medieval samples are well above one 14C half-life, i.e., F14C>0.5, the background level is satisfactory.
As seen in Table 1 the carbon yield of TD is significantly lower than SQ. At the same time, TD produces a sizeable amount of incondensable gas. TD of CaCO3 in a vacuum may not happen entirely as described by Equation (2). Part of the carbonate may produce carbon monoxide, which liquid nitrogen cannot freeze. Future work can investigate the carbon yield of TD with oxidizing agents such as pellets of CuO or an O2 atmosphere. These may oxidize carbon monoxide to CO2 and increase the yield. However, it is unknown if the addition of an oxidizing agent has an effect on TD temperatures or TD rates for late-in-formation pyrogenic carbonate, binder carbonate or geological carbonate.
Conclusiveness and Accuracy
To evaluate conclusive sample ages from the 14C profiles in Figures 5–7, we use criterion I defined by Heinemeier et al. (Reference Heinemeier, Ringbom, Lindroos and Sveinbjornsdottir2010):
Criterion I: The F14C of the first two CO2 fractions are the same.
The conclusive 14C determination for the mortar sample is then the weighted average of the first two fractions. The criterion is based on the assumption that the preparation method’s chemistry have different reaction rates for late-in-formation pyrogenic carbonate, binder carbonate and geological carbonate. Here they are listed in order of decreasing reaction rate. Two F14C determinations are considered the same, if a chi-square test for goodness of fit evaluates that the two values are well-described by their weighted average (Bennett and Franklin Reference Bennett and Franklin1954; Bronk Ramsey Reference Bronk Ramsey2009). Accuracy is evaluated by comparing the conclusive F14C and an expected F14C value with the same chi-square test for goodness of fit.
In Figure 7, the profiles by TD, SQ and P+SQ have plateaus where 3–4 fractions show similar F14C. The plateaus in the profiles by SQ and P+SQ have F14C values close to the expected, see Figure 7B. It may, or it may not, be possible to formulate and use conclusiveness criteria based on plateaus. Perhaps, plateau criteria could be based on a chi-square test of fractions’ F14C values, or the plateau’s cumulative CO2 fraction, or agreement between multiple plateaus by different preparation methods. We advise caution if one rules late plateaus conclusive because they can be inaccurate, see Merida003 (TD) in Figure 7A. We did not succeed in formulating simple and objective criteria that simultaneously rule the accurate plateau in profile Merida003 (SQ) conclusive, and the inaccurate plateau in profile Merida003 (TD) inconclusive. This study therefore avoids interpretation of late plateaus.
Thermal Decomposition and Geological Carbonate
In Figure 5A, the 1st and 2nd fractions of profile TTK005 (SQ) pass conclusiveness criterion I, see Table 3, and give conclusive F14C = 0.9277 ± 0.0029. Furthermore, this conclusive F14C and the expected F14C for the destruction in 1318 AD pass a chi-square test, see Table 3, so this conclusive 14C determination is accurate for Turku cathedral’s destruction. All profiles besides TTK005 (SQ) in Figure 5A and Figure 5B fail conclusiveness criterion I, and their results are inconclusive, see Table 3. No TD profiles for a sample with abundant geological carbonates achieve a conclusive mortar dating result. Considering these results, one can argue that TD is worse than SQ at distinguishing geological carbonate and binder carbonate.

Thermal Decomposition and Late-in-Formation Pyrogenic Carbonates
In Figure 6A, the 1st and 2nd fractions of Kastel09’s TD profile pass conclusiveness criterion I, and give conclusive F14C = 0.9203 ± 0.0020, see Table 3. The conclusive F14C and expected F14C for 1378 AD pass a chi-square test, see Table 3, so the conclusive F14C is an accurate 14C determination for Kastelholm castle. Figure 6B shows calibrated date of Kastel09’s conclusive F14C, which agrees with Kastelholm castle first mentioned in written sources in 1388 AD (Hausen Reference Hausen1910). The SQ profiles for Kastel09 and Kastel10 fail conclusiveness criterion I, and their results are inconclusive, see Table 3.
In Figure 6C, the profile Kimito004Li (TD) passes conclusiveness criterion I, see Table 3, and yields conclusive F14C = 0.9310 ± 0.0019. The conclusive F14C and expected F14C for 1400 AD pass a chi-square test, see Table 3. Thus, the conclusive F14C is an accurate 14C determination for the sacristy of Kimito church. Figure 6D shows calibrated date for Kimito004Li’s conclusive F14C, which has some probability in the 1st half of the 15th century AD. This agrees with the expected age of Kimito church’s sacristy (Nikula Reference Nikula1975). The expected age is based on historical context, see the samples subsection in the materials and methods section, so this is actually the first dating of Kimito church.
TD of mortar samples with late-in-formation pyrogenic carbonates, and limited geological carbonate, seems to improve 14C profiles in Figure 6A and Figure 6C. The causes of these preliminary findings have not yet been studied. Figure 7A shows TD of Merida003, where CO2 collection starts at room temperature. The first three TD fractions have the highest F14C compared to the expected F14C, and likely they are affected by late-in-formation pyrogenic carbonates outgassing somewhere from room temperature to 710°C. Secondary sodium carbonates formed in wet conditions, e.g. trona and thermonatrite (Na3H(CO3)2·2H2O and Na2(CO3)·H2O, respectively) and vaterite (CaCO3) after fire damage, have lower decomposing temperatures (Maciejewski et al. Reference Maciejewski, Oswald and Reller1994; Hartman et al. Reference Hartman, Trnka, Veselý and Svoboda2001; Lindroos et al. Reference Lindroos, Regev, Oinonen, Ringbom and Heinemeier2012). This can explain how Figure 6A and Figure 6C improve, as these experiments start CO2 collection around 600°C. Below this temperature some late-in-formation pyrogenic carbonates may drive off, and not affect fractions collected later.
Preheating Followed by Sequential Dissolution
In Figure 7 none of the Merida003 profiles by TD, SQ or P+SQ pass conclusiveness criterion I, and their 14C determinations are inconclusive, see Table 3. Many fractions have higher F14C than expected, and it is surprising that the entire TD profile for Merida003 has higher F14C than expected. The Merida samples are very hard, and Lindroos et al. (Reference Lindroos, Heinemeier, Ringbom, Daugbjerg and Hajdas2020b) discuss poor permeability for CO2 and delayed hardening, which could be an explanation for higher F14C than expected. For dolomitic mortars LDHs can contain carbonate from exchanged atmospheric CO2 (Artioli et al. Reference Artioli, Secco, Addis and Bellotto2017; Ponce-Anton et al. Reference Ponce-Anton, Ortega, Zuluaga, Alonso-Olazabal and Solaun2018). Ricci et al. (Reference Ricci, Secco, Marzaioli, Terrasi, Passariello, Addis, Lampugnani and Artioli2020) and Toffolo et al. (Reference Toffolo, Regev, Mintz, Kaplan-Ashiri, Berna, Dubernet, Yan, Regev and Boaretto2020) find that carbonate captured by LDHs decomposes around 500–550°C, so one would expect this to contribute to the first TD fraction only.
Figure 7B presents results from P+SQ preparation of sample Merida003. P+SQ improves the profile, which shows less late-in-formation pyrogenic carbonate than SQ. It seems that some late-in-formation pyrogenic carbonate decomposed in the preheating, but the P+SQ profile still fails conclusiveness criterion I. It would be interesting to investigate preheating at a temperature above 620°C.
CONCLUSION
TD in vacuum can extract CO2 from a mortar sample, and TGA curves are useful for choosing the experimental parameters. TD in vacuum has a significantly lower carbon yield than SQ, and this study used larger sample aliquots for TD than SQ.
TD is not successful in preparing samples with geological carbonate. As seen in Figure 5A and Figure 5B binder carbonate and geological carbonate does not behave sufficiently different in preparation by TD.
This study finds an interesting interaction between TD and late-in-formation pyrogenic carbonates from alkalinity or fire damage. Figure 7A shows TD driving off material with higher F14C than the rest of the sample at temperatures from room temperature to 710°C. In this way, Kastel09 and Kimito004Li may have had their late-in-formation pyrogenic carbonates removed below the preparation’s start temperature, and the two samples are conclusively dated in Figure 6A and Figure 6C. The conclusive 14C determinations for Kastelholm castle and Kimito church accurately agree with the buildings’ expected ages.
Another application is P+SQ, which preheats to remove late-in-formation pyrogenic carbonates prior to sequential dissolution. In Figure 7B, the preheating (at 620°C for half an hour) removes some late-in-formation pyrogenic carbonates, but not enough for the P+SQ profile to pass conclusiveness criterion I.
ACKNOWLEDGMENTS
This work was supported by the Danish National Research Foundation under the grant DNRF119–Centre of Excellence for Urban Network Evolutions (UrbNet).
This study is extremely grateful to Rubina Raja, Aarhus University, and Achim Lichtenberger, Ruhr-Universität Bochum. Their work and directorship at the Danish–German Jerash Northwest Quarter project made Jerash mortar samples available to this study.
Åsa Ringbom directed the sampling in Kimito and Kastelholm within the project “International Mortar Dating” and Stig Dreijer sponsored the project. Pia Sjöberg and Bo Ossian Lindberg guided the sampling in Kimito.


