


INTRODUCTION
Small vertebrates provide valuable information necessary to reconstruct the paleoenvironment and paleoclimate of a specific region (Chaimanee et al. Reference Chaimanee, Jaeger and Suteethorn1993; Bona et al. Reference Bona, Laurenti and Delfino2009; Rofes et al. Reference Rofes, Garcia-Ibaibarriaga, Aguirre, Martínez-García, Ortega, Zuluaga, Bailon, Alonso-Olazabal, Castaños and Murelage2015). As specific conditions are needed for them to survive and as they do not travel far from their living areas, microfaunal species and changes in their communities over time give important clues about local vegetation variations and, as a consequence, about climate changes. Finding paleontological material from commensal species may also indicate the presence of human communities nearby. Furthermore, as small vertebrates have a high rate of mutation, are usually abundant (compared to macrofaunal species) in archaeological and paleontological sites, and as the biochronology of many taxa is relatively well known, they can be excellent biochronological markers to date stratigraphic and archaeological units corresponding to relatively short periods of time (e.g. Cuenca-Bescós et al. Reference Cuenca-Bescós, Rofes, López-García, Blain, De Marfá, Galindo-Pellicena, Bennásar-Serra, Melero-Rubio, Arsuaga, Bermúdez de Castro and Carbonell2010). Possible applications include the reconstruction of paleoenvironmental changes in a given region, the reconstruction of recolonization processes of different species, and the understanding of the impact of human pressure on small vertebrate populations, as it induces fragmentation of ecosystems, anthropization of landscapes, destruction of territories, and introduction of alien species (Kotsakis and Barisone Reference Kotsakis and Barisone2000; Flynn and Wessels Reference Flynn and Wessels2013; Rofes et al. Reference Rofes, Garcia-Ibaibarriaga, Aguirre, Martínez-García, Ortega, Zuluaga, Bailon, Alonso-Olazabal, Castaños and Murelage2015; Royer Reference Royer2016). Isotopic analysis of small mammals may also be used as a proxy of continental climate changes (Navarro et al. Reference Navarro, Lécuyer, Montuire, Langlois and Martineau2004; Commendador and Finney Reference Commendador and Finney2016). However, for recent periods like the latest Pleistocene and Holocene, where the human pressure is progressively increasing, obtaining fine chronological frameworks of these changes through direct radiocarbon dating of small vertebrate bones is required to obtain high-resolution paleoenvironmental reconstructions and to understand complex historical-biogeographical processes like the postglacial recolonization of several species. Dating of bone microsamples (including rodents; Soricomorpha, e.g. shrews; Erinaceidae, e.g. hedgehogs; bats; amphibians; and reptiles) has scarcely been tried because of two main challenges: (1) the insufficient amount of collagen for 14C dating given the limited amount of material (e.g. 20–30 mg for a shrew hemimandible) and (2) the use of a suitable extraction protocol to ensure an efficient recovery of the limited amount of collagen from the bone.
Small vertebrate bones are more sensitive to alterations both because of digestion by predators and postburial diagenesis (Dauphin and Denys Reference Dauphin and Denys1992; Dauphin et al. Reference Dauphin, Denis and Denys1999). Moreover, the small size of small vertebrate samples yields a higher specific area (surface to volume ratio) than macrovertebrates, leading to higher rates of interaction with the surrounding sedimentary environment. In the particular case of fish, investigation on the chemistry of the bones and studies of archaeological material also revealed a lower degree of collagen preservation than for other bones coming from the same sites, probably due to the lower calcification of several parts of the skeleton (rather cartilaginous than bony). This lower mineralization also facilitates the penetration of contaminants from the sediment (Szpak Reference Szpak2011).
Regardless of the protocol chosen, pretreatment steps and further measurements are time-consuming, labor-intensive, and expensive. That is the reason why, in addition to a careful visual preliminary examination, samples may be tested for nitrogen and carbon content prior to 14C dating to assess if the sample has sufficient collagen preservation. Nondestructive alternatives to isotope ratio mass spectrometry (IRMS) have been proposed using Raman spectroscopy (Pestle et al. Reference Pestle, Brennan, Sierra, Smith, Vesper, Cordell and Colvard2015) or a combination of X-ray microtomography and ion beam analysis (Beck et al. Reference Beck, Cuif, Pichon, Vaubaillon, Dambricourt Malassé and Abel2012). More recently, attenuated total reflectance–Fourier transform infrared (ATR-FTIR) spectroscopy has been shown to give reliable results within a few minutes for a very small amount of sample (<1 mg) and can thus be used to discard poorly preserved specimens (Lebon et al. Reference Lebon, Reiche, Gallet, Bellot-Gurlet and Zazzo2016).
The amount of carbon that can currently be extracted from microsamples can narrowly reach the detection limit (1 mg of carbon) for 14C measurement using conventional AMS. Currently, AMS 14C dating of collagen from bones usually requires between 300–600 mg of archaeological material, depending on the level of preservation of the protein. Therefore, collagen extraction protocols (yields) must be optimized, but the quality of the collagen extracted must also be assessed as the presence of any exogenous carbonaceous contaminant, either coming from the sediment or from lab processing of the sample, would significantly bias the resulting date for small bone samples. A large diversity of collagen extraction protocols can be found in the literature. Most of them follow the well-established acid/alkali/acid (AAA) procedure (Longin Reference Longin1971; Arslanov and Svezhentsev Reference Arslanov and Svezhentsev1993), but acid, temperature, and duration of exposure may change for the first acid treatment; the alkali step may be avoided (or its duration limited); and the last acid step, known as gelatinization, may also vary in duration, temperature, and pH (Brown et al. Reference Brown, Nelson, Vogel and Southon1988; Semal and Orban Reference Semal and Orban1995; Brock et al. Reference Brock, Geoghegan, Thomas, Jurkschat and Higham2013). This treatment may be performed on crushed bones directly but a grinding (and sometimes a sieving) step may be added. Following the AAA treatment, purification and/or concentration steps are often added and different choices have been made for material and pore size of the filters. The addition of the ultrafiltration step has led to controversies regarding its efficiency (Hüls et al. Reference Hüls, Grootes and Nadeau2009; Fülop et al. Reference Fülöp, Heinze, John and Rethemeyer2013). Differences in quantity and quality of collagen in extracts between the different protocols have previously been investigated on macrovertebrate bones (Jørkov et al. Reference Jørkov, Heinemeier and Lynnerup2007; Caputo et al. Reference Caputo, Lepretti, Scarabino, Esposito and Proto2012; Cleland et al. Reference Cleland, Voegele and Schweitzer2012; Brock et al. Reference Brock, Geoghegan, Thomas, Jurkschat and Higham2013; Fülöp et al. Reference Fülöp, Heinze, John and Rethemeyer2013; Minami et al. Reference Minami, Yamazaki, Omori and Nakamura2013; Sealy et al. Reference Sealy, Johnson, Richards and Nehlich2014) but not on small vertebrate bones except fish (Szpak Reference Szpak2011; Keaveney and Reimer Reference Keaveney and Reimer2012).
Only a few laboratories have tried to date small vertebrate bones. Modern rat bones (Rattus norvegicus) from Tokaanu Bay on the volcanic lake of Taupo were dated by the Rafter Radiocarbon Lab AMS facility (Lower Hutt, New Zealand) to investigate the influence of diet on their 14C age (Beavan-Athfield et al. Reference Beavan-Athfield, McFadgen and Sparks2001). Ancient bones were also dated by different labs (ORAU laboratory, AMS facility Tucson, and Kiel AMS) on Holocene samples coming from temperate to semiarid areas (Wilmshurst et al. Reference Wilmshurst, Anderson, Higham and Worthy2008; Alcover et al. Reference Alcover, Rando, García-Talavera, Hutterer, Michaux, Trias and Navarro2009; Rando et al. Reference Rando, Pieper and Alcover2014) and on older samples from cold climate sites (Heaton and Grady Reference Heaton and Grady2003; Martinkova et al. Reference Martinkova, Barnett, Cucchi, Struchen, Pascal, Fischer, Higham, Brace, Ho, Quéré, O’Higgins, Excoffier, Heckel, Hoelzel, Dobney and Searle2013; Palkopoulou et al. Reference Palkopoulou, Baca, Abramson, Sablin, Socha, Nadachowski, Prost, Germonpré, Kosintsev, Smirnov, Vartanyan, Ponomarev, Nyström, Nikolskiy, Jass, Litvinov, Kalthoff, Grigoriev, Fadeeva, Douka, Higham, Ersmark, Pitulko, Pavlova, Stewart, Węgleński, Stankovic and Dalén2016).
In this study, eight representative collagen extraction protocols were tested on both modern and archaeological small vertebrate bones and on macromammal bones as control, prescreened upstream for collagen preservation using ATR-FTIR spectroscopy. Yields were calculated and compared and collagen “quality” was assessed using the C:N criteria as well as the influence of the protocols chosen on isotopic δ13C and δ15N results.
EXPERIMENTAL
Sample Selection
Seven types of samples were selected including two macromammal bones, with the remaining five being subsampled from assemblages of small vertebrate bones (Table 1). In the case of small vertebrates, only one type of bone and species was selected when possible. If not, only samples corresponding at least to the same family (for mammals) or to the same suborder (for amphibians) were kept. Selections and species identification of the bones were achieved in collaboration with archaeozoologist colleagues. Macrovertebrates bones were sampled using a diamond-tipped Dremel grinder in order to obtain 3 to 8 g of sample. For small vertebrates, several bones from the same context were gathered to reach a mass of about 5 g. Bones of juveniles or showing digestion marks were discarded. When still present, teeth were removed from hemimandibles. Modern small vertebrate bones were sifted from the rejection pellet of a barn owl (Tyto alba), a class 1 predator according to Andrews’ classification (Andrews and Cook Reference Andrews and Cook1990). They did not show heavy digestion marks and can thus be considered as modern reference material for small vertebrate bones. A subsample of VIRI E (Mammuthus sp.) was chosen as the macromammal archaeological bone reference. Good climatic and chronological coverage were ensured with samples coming from tropical and temperate environments, and ranging in age from ~40,000 BP to Modern.
Table 1 Taxonomical, geographical, and chronological contexts of the test samples.
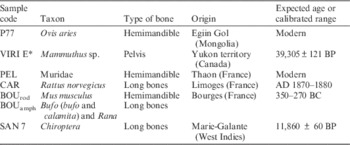
* Intercalibration sample.
ATR-FTIR Analysis
Prior to collagen extraction, bone micro-subsamples were prescreened using FTIR to assess the preservation of collagen, following the procedure described in Lebon et al. (Reference Lebon, Reiche, Gallet, Bellot-Gurlet and Zazzo2016). Briefly, FTIR spectra were performed in ATR mode [using a Golden GateTM Single Reflection Diamond ATR accessory (Specac, France) with KRS-5 lens] on a Vertex 70 FTIR spectrometer (Bruker Optics, France). ATR-FTIR spectra were obtained by the accumulation of 128 scans in the wavenumber range 4000–400 cm–1 with a spectral resolution of 2 cm–1. The heterogeneity of each microsample was considered by performing several measurements (up to six), on several grains of powdered bone (<1 mg). OPUS software (Bruker Optics, France) was used to draw linear baselines and measure the amide I and phosphate ν3(PO4) bands, between 1710–1590 and 1110–940 cm–1, respectively (for the latter, baseline correction was applied between 1160 and 890 cm–1). Nitrogen and collagen contents of the bones were then estimated from the amide I/PO4 ratio using equations reported in Lebon et al. (Reference Lebon, Reiche, Gallet, Bellot-Gurlet and Zazzo2016) taking standard deviations into account:
 $${\rm \,\%\,}\,{\rm N}\,\left( {{\rm wt}} \right){\rm \,{\equals}\,20}{\rm .6}\,{\rm amide}\,{\rm I/PO}_{{\rm 4}} {\rm {\plus}0}{\rm .31}\,{\rm and}\,{\rm \,\%\,}\,{\rm Collagen}\,\left( {{\rm wt}} \right)\,{\rm {\equals}\,113}{\rm .13}\,{\rm amide}\,{\rm I/PO}_{{\rm 4}} {\rm {\plus}1}{\rm .69}{\rm .}$$
Extraction Protocols
Following physical cleaning with a diamond drill, macromammal bones were coarsely crushed into fragments. If required (protocols F–H, see below), cleaned crushed bones were ground using an agate pestle and mortar and sieved until the size of the particles obtained ranged between 0.3 and 0.7 mm. The collagen of each prepared bone subsample (150 mg) was then extracted according to eight different protocols, available in the scientific literature (Longin Reference Longin1970; Brown et al. Reference Brown, Nelson, Vogel and Southon1988; Tuross et al. Reference Tuross, Fogel and Hare1988; Bocherens et al. Reference Bocherens, Fizet, Mariotti, Lange-Badre, Vandermeersch, Borel and Bellon1991; Semal and Orban Reference Semal and Orban1995; Beaumont et al. Reference Beaumont, Beverly, Southon and Taylor2010; Brock et al. Reference Brock, Higham and Bronk Ramsey2010, Reference Brock, Geoghegan, Thomas, Jurkschat and Higham2013; Tuross Reference Tuross2012; Stafford Reference Stafford2014; Waters et al. Reference Waters, Stafford, Kooyman and Hills2015). A detailed description of each protocol is given in the following and a summary is given in Table 2. Protocols A–B can be considered as “soft,” protocols C–E involve the use of ultrafilters, protocol F is our in-house protocol for 14C dating and isotope analysis, and protocols G–H can be considered as “harsh.” Solutions were freshly prepared with ultrapure Milli-QTM water and volumes were adapted to the amount of sample. Unless stated otherwise, each step of the protocols was performed at room temperature. For protocols A and B, glass filters were required and a specific filtration kit was designed. Sintered glass vacuum filtration devices (porosity P5 corresponding to 1.6-μm maximum pore size) were obtained from Ellipse (France). For protocols C–E, Sartorius Vivaspin 15™ 30 kDa MWCO ultrafilters were purchased from Dutscher (France) and precleaned following Brock et al. (Reference Brock, Bronk Ramsey and Higham2007) and Beaumont et al. (Reference Beaumont, Beverly, Southon and Taylor2010). HDPE Ezee-filtersTM were purchased from Elkay (UK) and cleaned by ultrasonication (20 min) following Brock et al. (Reference Brock, Bronk Ramsey and Higham2007). For protocol G, Spectra/Por 2 MWCO 12–14 kDa dialysis tubing regenerated cellulose membranes were purchased from Spectrumlabs (France) and precleaned according to the manufacturer’s instructions.
Table 2 Summary of the collagen extraction protocols.

* UF = ultrafiltration. Ultrafiltration and dialysis membrane cutoff are given in parentheses.
Protocol A (after Tuross et al. Reference Tuross, Fogel and Hare1988; Tuross Reference Tuross2012)
Small bone chunks are immersed in 0.5M EDTA solution (pH 7.4) until complete decalcification (with a visual and “mechanical” check every day, on weekdays). The solution is replaced every 4–5 days. The remaining pale yellow transparent phantom is rinsed 15 times including one time overnight (to remove EDTA). Extraction is performed with HCl pH 5 at 100°C for 16 hr followed by glass filtering.
Protocol B (after Stafford Reference Stafford2014; Waters et al. Reference Waters, Stafford, Kooyman and Hills2015)
Bone shards (5–10 mm) are immersed in 0.2M HCl at 4°C for 2 to 4 days (visual and mechanical check). The solution is replaced three times a day. The remaining phantom is rinsed with Milli-Q water and immersed in 0.1M NaOH at 4°C for 2 to 4 days (visual check: coloration of the solution), then rinsed with 0.2M HCl, and then Milli-Q water. Extraction is performed in 0.06M HCl at 90°C for up to 1 hr. Solubilization is checked every 5 min and followed by glass filtering.
Protocol C (after Brown et al. Reference Brown, Nelson, Vogel and Southon1988)
Coarsely ground bone chunks (~10–60 mg) are immersed in 0.25M HCl for several days until complete decalcification (visual check). The remaining phantom is rinsed with Milli-Q water and extraction is performed in HCl pH 2 at 58°C for 16 hr. Purification is performed using Ezee-filters and collagen is concentrated via ultrafiltration: the sample is spun for 20 min at 3000 rpm followed by the remaining volume check. This process is repeated until 0.5–1 mL remaining volume.
Protocol D (after Beaumont et al. Reference Beaumont, Beverly, Southon and Taylor2010)
Coarsely ground bone chunks (~0.5–2 mm) are immersed in 0.5M HCl for 24 to 36 hr until complete decalcification (visual check). The remaining phantom is rinsed with Milli-Q water. If required, the sample is treated with 0.1M NaOH for up to 1 hr. The treatment is stopped after 15 min if no coloration of the solution is observed. The remaining phantom is rinsed with 0.1M HCl, then Milli-Q water and extraction is performed in HCl pH 2 at 60°C overnight. Solubilized collagen is concentrated via ultrafiltration: the sample is spun twice, then diluted, and finally spun twice more.
Protocol E (after Brock et al. Reference Brock, Higham and Bronk Ramsey2010, Reference Brock, Geoghegan, Thomas, Jurkschat and Higham2013)
Coarsely ground bone chunks are immersed in 0.5M HCl for 24 hr. The solution is replaced three times. The remaining phantom is rinsed with Milli-Q water and treated with 0.1M NaOH for 30 min. The remaining phantom is rinsed with 0.5M HCl for 15 min, then Milli-Q water and extraction is performed in HCl pH 3 at 75°C for 20 hr. Acid-insoluble residues are removed via filtration through Ezee-filters. Collagen is then concentrated via ultrafiltration. The sample is spun for 20 to 40 min at 3000 rpm until 0.5–1 mL remains in the ultrafilter.
Protocol F (after Bocherens et al. Reference Bocherens, Fizet, Mariotti, Lange-Badre, Vandermeersch, Borel and Bellon1991)
Coarse bone powder (0.3–0.7 mm) is immersed in 1M HCl for 20 min under continuous stirring. The solution is then filtered on MF-Millipore™ membranes (mixed cellulose ester membranes of 5.0-µm pore size from Fisher Scientific, France) while Milli-Q water rinsing is performed. The acid-insoluble residues are then immersed in 0.1M NaOH for 20 hr. The solution is then filtered again on MF-Millipore™ while Milli-Q water rinsing is performed. The alkali-insoluble residues are immersed in HCl pH 2 and extraction is performed at 100°C for 17 hr. The final solution is filtered on MF-Millipore membranes before being collected.
Protocol G (after Semal and Orban Reference Semal and Orban1995)
Coarse bone powder (>0.3 mm) is immersed in 2M HCl for 20 min. The solution is then diluted to perform the collagen extraction in 0.2M HCl at 95°C for 50 min. The final solution is filtered on Whatman® nitrocellulose membrane filters of 0.45-µm pore size from Sigma-Aldrich (France), before being collected and dialyzed against bidistilled water until 1 mL remains in the membrane (overnight to several days). The aqueous dialysis solution is replaced after 1 hr the first time, then once a day.
Protocol H (after Longin Reference Longin1970)
Coarse bone powder (>0.3 mm) is immersed in 2M HCl for 20 min with sporadic manual stirring. The solution is then discarded and the residues diluted to reach pH 3 to perform the collagen extraction at 90°C for 25 hr. The final supernatant is collected after 10 min centrifugation at 3000 rpm.
At the end of each processing, supernatants were pipetted out and freeze-dried for at least 48 hr. The final extract was weighted quickly to calculate the collagen extraction yield for each sample and each protocol.
Elemental Analysis and Isotopic Ratio Mass Spectrometry (IRMS)
Carbon (%C) and nitrogen (%N) contents as well as C:N ratios were calculated to evaluate collagen preservation. About 0.3 to 0.5 mg of extracted collagen were weighed and packed in precleaned tin capsules. Stable isotopic measurements were performed with a Thermo Scientific EA Flash 2000 coupled to a Delta V Advantage isotopic mass spectrometer. Isotopic values of all samples were measured relative to a laboratory standard of alanine. A reproducibility of 0.3 wt% for N and 0.6 wt% for C was estimated based on this standard. Carbon and nitrogen isotopes values are reported relative to the VPDB and AIR, respectively. Analytical precision is ±0.2‰ (2σ) for δ13C and δ15N.
RESULTS AND DISCUSSION
Upstream FTIR Analysis
Examples of ATR-FTIR spectra from both modern and archaeological bone samples studied are shown in Figure 1. Modern bones are characterized by intense organic bands: clearly visible amide I (at 1640 cm–1) but also amide II, amide III, amide A and B bands (at 1545, 1240, 3285, and 3075 cm–1, respectively) can be distinguished. On the contrary, archaeological bones show weaker or no organic bands but an increase in the intensity of mineral bands, as previously described for fossils (Farre et al. Reference Farre, Massard, Nouet and Dauphin2014): carbonate ν2 and ν3 (CO3) bands (at 875 and 1410 cm–1, respectively) and phosphate ν3 and ν4 (PO4) bands (at 1010 and 555 cm–1, respectively). Amide I/PO4 ratios are reported for each sample in Table 3 and vary between 0.01 and 0.20. The highest values are calculated for the modern sheep (P77) and the mammoth (VIRI E), whereas the lowest value corresponds to a bat from a tropical environment (SAN 7).

Figure 1 Prescreening example of ATR-FTIR spectra of test bone samples: modern macromammal bone (sheep P77), modern small mammal (rodent PEL), and archaeological amphibian (BOUamph). The two bands of interest for collagen preservation study [ν3(PO4) mineral and amide I organic bands] are indicated by arrows. Samples are ranked according to the intensity of the amide I band.
Table 3 ATR-FTIR data analysis: measurement of the amide I/PO4 ratio, calculated bone nitrogen content (wt%) and exogenous compounds identified in the bone sample. For a given sample, the different lines correspond to different analyses on different grains of the bone sample.

Nitrogen contents were estimated from these ratios based on Lebon et al. (Reference Lebon, Reiche, Gallet, Bellot-Gurlet and Zazzo2016) and are shown in Table 3. They allow to classify bone samples according to their preservation state (Stafford et al. Reference Stafford, Brendel and Duhamel1988), as shown in Figure 2. Logically, modern bones (P77 and PEL) as well as VIRI E mammoth fall into the highest range, with a N wt% content between 3.5 and 4.1, with the maximum reported being 4.4 for modern fresh bone (Bocherens et al. Reference Bocherens, Drucker, Billiou and Moussa2005). Most of the other archaeological small vertebrate bones belong to the well-preserved class except the bat bone from a tropical climate (SAN 7), which exhibits a very low nitrogen content below the 0.7% threshold defined by Brock et al. (Reference Brock, Wood, Higham, Ditchfield, Bayliss and Bronk Ramsey2012). It is also noteworthy that within the same site (Bourges), bone samples from amphibians (BOUamph) are better preserved than rodent bones (BOUrod). As far as we know, information about the collagen content in amphibian bones and possible discrepancies according to individual ages is not currently available. Thus, our observation is at the present time difficult to interpret. Estimation of the collagen content deduced from the amide I/PO4 ratio as proposed in Lebon et al. (Reference Lebon, Reiche, Gallet, Bellot-Gurlet and Zazzo2016) is also shown in Figure 2.

Figure 2 Box plot of the nitrogen (wt%) and collagen content (wt%) for modern and archaeological bone samples, calculated from FTIR amide I/PO4 ratios estimations, using Lebon’s calibration (Lebon et al. Reference Lebon, Reiche, Gallet, Bellot-Gurlet and Zazzo2016). The dotted line indicates the 0.7% N (wt) threshold defined for possible 14C dating of Paleolithic to Bronze Age bones (72% chance) using ORAU’s protocol with ultrafiltration (Brock et al. Reference Brock, Wood, Higham, Ditchfield, Bayliss and Bronk Ramsey2012). Shaded areas delineate the threshold of preservation state classification stated by Stafford et al. (Reference Stafford, Brendel and Duhamel1988).
ATR-FTIR spectra also offer the possibility of detecting exogenous compounds in bone. The list of exogenous compounds identified in our samples is given in Table 3. The spectra of buried samples (i.e. all the samples except the modern sheep bone P77) show contamination bands corresponding, for example, to carbonates (calcite) and aluminosilicates (kaolinite) coming from the soil in which the bones were found. This information could be further used to monitor the pretreatment of bone during the first acid step (e.g. increasing the duration of decalcification if large amounts of calcite is detected) and the second alkali step (e.g. avoiding this step if no exogenous alkali-soluble compound is found). It could also indicate the need to perform a preliminary chemical cleaning step (e.g. using acetone to remove conservatives). Moreover, it is worth noting that the detection limit in the bone-calcite mixture has been estimated from ATR-FTIR spectra as 2.5 wt% of calcite (Dal Sasso Reference Dal Sasso2015).
Yields: Quantity of Collagen Extracted
Collagen extraction yields vary from zero to 24.7% and are summarized in Table 4. For clarity and to enable a direct comparison of the protocol efficiencies, a normalized yield was calculated and is reported in Table 4. It corresponds to the ratio of the final measured collagen over the median value of the collagen content (wt%) calculated using FTIR analysis (as reported in Figure 2). For most of the protocols, modern and well-preserved VIRI E macromammal bones show logically the highest yield. Within the exception of VIRI E and BOUamph samples, the soft EDTA protocol A always shows lower normalized yields. This surprising result, also observed for the modern sheep bone (P77), suggests that this procedure is not able to efficiently extract collagen from the bones. This could be due to an incomplete demineralization as this step is stopped by visual and mechanical examination by the experimenter. Results for protocol G are variable and lead to lower normalized yields, probably due to the harsh solubilization conditions. The soft protocol B seems to be the most suitable to recover the highest quantity of collagen from rodent bones, whereas the harsher protocol F seems best suited to amphibian bones. This would suggest a higher mineralization of the amphibian bone samples studied. None of the protocols were able to extract enough collagen from the bat sample (SAN7).
Table 4 Final collagen yield and stable isotope results for the different protocols applied on each sample. Normalized yield corresponds to the ratio of the final measured collagen over the median value of the collagen content (wt%) calculated via FTIR analysis (as reported in Figure 2). * Indicates that the sample contained insufficient nitrogen and could not give a valid isotopic measurement. ** Indicates that the sample contained insufficient carbon and nitrogen and could not give valid isotopic measurements.

It can finally be noted that FTIR prescreening was able to give a reliable estimation of the expected extractible collagen content of bones, but sometimes underestimated this content as shown by normalized yield above 1 (Table 4). As mentioned in Lebon et al. (Reference Lebon, Reiche, Gallet, Bellot-Gurlet and Zazzo2016), limitations in the estimation may exist. The presence of N-containing contaminants may lead to an underestimation of the nitrogen content within the sample. Another limitation should also be underlined, even if unusual: measurement of the amide I/PO4 ratio may be disturbed if another band overlaps the two absorption bands of interest. In this case, identification of the compounds followed by deconvolution of the bands, though a little more delicate and time consuming, could be considered.
Elemental Analysis: Quality of Extracted Collagen
To check the quality of collagen extracted and to assess its integrity in the different samples, %Ccollagen, %Ncollagen, and C:N ratios were measured. The results are shown in Table 4. Apart from protocol G, no significant difference was detected in %Ccollagen between protocols with values ranging from 37.0 to 45.2 for all the samples but SAN 7. In the case of BOUrod, protocol G leads to lower %C wt, even below the 30% limit for accurate collagen integrity (DeNiro Reference DeNiro1985; Ambrose Reference Ambrose1990; van Klinken Reference van Klinken1999). None of the extract from SAN 7 shows evidence of collagen preservation, confirming the results of FTIR prescreening. The same trends are observed for comparison of weight percentage of nitrogen: low (<10% wt) or no %N content was detected for samples extracted with protocol G. All samples but SAN 7 contained about 15% nitrogen, whatever the protocol considered. Therefore, the use of an alkali step (B, D, E, and F) or of an ultrafiltration step (C, D, and E) does not seem to affect %C and %N, confirming previous observations on very well-preserved human bones by Jørkov et al. (Reference Jørkov, Heinemeier and Lynnerup2007). Similarly, grinding (protocols F, G, and H) does not seem to affect the results either (Schoeninger et al. Reference Schoeninger, Moore, Murray and Kingston1989).
C:N ratios fall within the 2.9 and 3.6 limit defined for modern and archaeological bones (DeNiro Reference DeNiro1985; van Klinken Reference van Klinken1999), indicating that bones that passed other tests (FTIR, yield, %C wt, and/or %N wt) are suitable for 14C dating. Moreover, the C:N ratios obtained for VIRI E (between 3.20 and 3.24) are consistent with published values (Minami et al. Reference Minami, Yamazaki, Omori and Nakamura2013). With the possible exception of a slight increase in C:N ratio for BOU samples prepared according to protocol A, no significant difference between protocols was observed in our study. The use of EDTA in protocol A was shown to give slightly lower C:N ratios (VIRI E C:N ratio is 0.3 lower in Tuross Reference Tuross2012) but no significant difference was observed in our study. A lack of influence of ultrafiltration on C:N ratios was also noted in several studies performed on modern (Jørkov et al. Reference Jørkov, Heinemeier and Lynnerup2007) and ancient (Brock et al. Reference Brock, Geoghegan, Thomas, Jurkschat and Higham2013) bones.
IRMS: Influence of Extraction Protocols on Isotopic Results
Stable carbon (δ13C) and nitrogen (δ15N) isotopic values are reported in Table 2 and Figure 3. As expected, all isotopic values correspond to terrestrial species with δ15N value below 12‰ and δ13C below –17‰ and to non-carnivorous diet (Bocherens and Drucker Reference Bocherens and Drucker2003; Britton et al. Reference Britton, Müldner and Bell2008). For macrovertebrate bones, reproducibility of δ13C and δ15N values is within the analytical error (±0.2‰). As in Jørkov et al. (Reference Jørkov, Heinemeier and Lynnerup2007), most of the variability is for carbon, while nitrogen isotopic values remain constant. Moreover, for mammoth sample VIRI E, isotopic values are consistent with previously published ones (Minami et al. Reference Minami, Yamazaki, Omori and Nakamura2013).

Figure 3 Carbon (δ13Ccollagen) and nitrogen (δ15Ncollagen) isotope compositions of the collagen extracted from the bone test samples according to the different protocols. Each symbol corresponds to one protocol. Black and gray symbols correspond to the softer and harsher protocols, respectively. For greater clarity, points corresponding to the same sample are circled (either by solid or dotted lines).
On the contrary, an important isotopic variability was observed between protocols for small vertebrate samples. This is particularly significant for δ13C values, which showed a 2‰ variability. As such differences may lead to differences in dietary interpretation, understanding the origin of these discrepancies is important. This could indicate that, unlike macromammal bones, pretreatment protocols have an influence on the isotopic results for small vertebrate collagen. Contrary to Jørkov et al. (Reference Jørkov, Heinemeier and Lynnerup2007), we did not find any influence of NaOH or ultrafiltration on δ15N values. No influence of the choices made during the first acid step (HCl or EDTA, demineralization duration, acid strength) was noted, as previously reported for macromammals (Pestle Reference Pestle2010; Tuross Reference Tuross2012; Sealy et al. Reference Sealy, Johnson, Richards and Nehlich2014). Nevertheless, as no influence of the protocols has been observed on macromammals and as collagen is as well preserved in small vertebrate bones (same range of values of %C and %N as macrovertebrate bones), the observed variability cannot be related to the protocol chosen. Another interpretation may be proposed. Due to their small size, we had to use a different bone each time for each protocol. Therefore, the isotopic variability could in fact reflect interindividual differences in diet for these small vertebrates. DeNiro and Schoeninger (Reference DeNiro and Schoeninger1983) estimated that interindividual variability in δ13C values could reach 2‰. A similar variability (2‰) was observed for an assemblage of Cavia porcellus bones from Peru (Finucane et al. Reference Finucane, Agurto and Isbell2006). This variability may be linked to annual variability in plant δ13C values, differences in fractionation, and access to different foodstuffs even for individuals from the same taxa and coming from the same site. This result shows that analyzing individual bones from small vertebrates can provide information regarding the dietary variability within a given population.
Finally, it is noteworthy that modern rodent samples (PEL) exhibited the most negative δ13C values (about –3‰ between BOUrod and PEL). This could reflect the influence of the Suess effect affecting the isotopic composition of the atmospheric CO2 and ingested plants for the past 150 yr (Suess Reference Suess1955; Francey et al. Reference Francey, Allison, Etheridge, Trudinger, Enting, Leuenberger, Langenfelds, Michel and Steele1999).
CONCLUSIONS
This study compared the quality and quantity of small vertebrate collagen extracted using eight different protocols. On these types of samples that may undergo differential and important diagenesis, we confirm the efficiency of the FTIR prescreening method to select the samples that are best suited for 14C dating. Our comparative approach demonstrated that protocol B (after Stafford Reference Stafford2014; Waters et al. Reference Waters, Stafford, Kooyman and Hills2015), a soft protocol involving slow demineralization at low temperature, is the most suitable for rodent bone samples as it allows to recover the highest amount of material (>75% for micromammals) from archaeological bones while preserving the collagen integrity and isotopic values by efficiently removing nitrogen-rich contaminants. Even if this protocol is time consuming (demineralization can take up to 4 days), it is not more complicated than the conventional protocols and is relatively inexpensive as neither disposable filters nor ultrafilters are required. We also demonstrated that neither grinding nor ultrafiltration or the presence of an alkali step in the chosen protocol influence the elemental composition of the extracted collagen. Finally, we did not find any influence of the extraction protocol on the isotopic values of collagen extracted from macromammals. The differences observed for small vertebrate bones are most likely due to individual differences in dietary preferences. The conclusions drawn from our experiment will be validated soon with 14C dates on a larger sample set of small vertebrate bones from archaeological assemblages.
ACKNOWLEDGMENTS
The authors would like to thank S Baillon, T Cucchi, K Debue, S Grouard, and A Tresset (CNRS, UMR 7209) for access to the bone samples and for archaeozoological identifications. The authors also thank D Fiorillo for his assistance with stable isotope analysis at the Service de Spectrométrie de Masse Isotopique of the MNHN (SSMIM). Funding for this project is provided by a State aid, managed by the French National Research Agency (ANR), namely LabEx ANR-10-LABX-0003-BCDiv, within the framework of “Investissements d’avenir” program number ANR-11-IDEX-0004-02. Juan Rofes has a postdoc Marie Curie Fellowship (MCA-IEF FP7/2007-2013 Project nº629604) of the European Commission. We would finally express our gratitude to the anonymous reviewers for their constructive remarks, which contributed to improving the manuscript.


