


INTRODUCTION
Since ancient times, artworks have undergone restoration in order to preserve them. For the last 50–60 yr, many new conservation products have been developed, which are mainly based on synthetic materials produced through chemical polymerization processes primarily containing hydrocarbons (Horie Reference Horie2010). Restorers began to largely apply synthetic products, especially because those substances produce limited yellowing over time and they are not usually subjected to biodegradation (Cappitelli et al. Reference Cappitelli, Zanardini and Sorlini2004; Crisci et al. Reference Crisci, La Russa, Malagodi and Ruffolo2010). However, these products are rich in fossil carbon, and thus low in 14C, and so they contribute to decrease the measured 14C concentration if they are not correctly removed during sample preparation.
Since the 1960s, the acrylic resin Paraloid B-72® (Rohm and Haas Company, also known as Acryloid B-72®), a copolymer of ethyl methacrylate and methyl acrylate (70:30), has become one of the most used materials in the conservation field. It can be applied on a variety of supports including wood, bone, canvas, and painted surfaces. However, its characteristics can change over time because of cross-linking and time aging effects. For instance, its solubility in the typical solvents used for restoration, e.g. acetone, can strongly decrease and its removal can thus be very complicated.
When the sample has been treated with Paraloid B-72, the simple and quite standard acid-base-acid (ABA) procedure is clearly not sufficient to eliminate all the exogenous material (Fedi et al. Reference Fedi, Caforio, Liccioli, Mandò, Salvini and Taccetti2014). A typical approach to the problem is the well-known Soxhlet method (Bruhn et al. Reference Bruhn, Duhr, Grootes, Mintrop and Nadeau2001). At INFN-LABEC (Laboratorio ditecniche nucleari per l’Ambiente e per i Beni Culturali) in Florence, a new pretreatment procedure has been recently set up for wood and canvas samples. This method is based on the use of chloroform (CHCl3) (Fedi et al. Reference Fedi, Caforio, Liccioli, Mandò, Salvini and Taccetti2014). We selected this solvent because its main characteristics are a high solvent power and a high volatility, thus allowing contaminant removal without affecting the sample itself. The contaminated samples are soaked in chloroform for about 48 hr, during which four consecutive extractions are performed.
The present work aims to characterize the efficiency of this process. In particular, we have investigated whether there is a dependency of this efficiency with respect to the number of performed extractions. This has been studied especially in less advantageous conditions, where the applied resin is aged and thus its removal can be expected to be more difficult.
MATERIALS AND METHODS
In order to characterize the efficiency of the chloroform-based procedure, test samples were prepared by injecting different volumes of Paraloid B-72 into wooden pieces of known 14C concentration. In its typical form available on the market, Paraloid B-72 is not ready to use: it is sold in the form of pellets that have to be dissolved in a solvent such as ethanol, acetone, or butyl acetate. In our case, we chose acetone, which is one of the most common solvents in the artwork restoration field (Koob Reference Koob1986). The solution was prepared according to a volume ratio of acetone:Paraloid pellet of 90:10 (C Castelli, Opificio delle Pietre Dure, Florence, personal communication, 2015). The applied Paraloid B-72 was characterized both by accelerator mass spectrometry (AMS) to measure its 14C content and the Fourier transform infrared (FTIR) technique to identify the most representative adsorption bands.
Starting with a portion from a poplar (Populus) tree, three small slices of wood (20×10×1mm) were carefully cut in order to collect only one tree ring of known 14C concentration, as already measured (Fedi et al. Reference Fedi, Caforio, Liccioli, Mandò, Salvini and Taccetti2014). In the samples prepared in this way, different volumes of Paraloid B-72 (i.e. 0.15, 0.30, and 0.50 mL) were injected using a syringe. (In the following, test samples are referred to as Poplar 0.15, Poplar 0.30, and Poplar 0.50, respectively.) Using a syringe to inject the resin for consolidation purposes is a method employed by restorers themselves, especially in the case of point-like operations.
Since the solubility of Paraloid B-72 can decrease due to cross-linking and time aging effects, in order to simulate the resin degradation of restored artworks, the test samples were artificially aged using a climatic chamber, as is common in studies on polymer behavior (Chiantore and Lazzari Reference Chiantore and Lazzari2001; Capano et al. Reference Capano, Marzaioli, Passariello, Pignatelli, Martinelli, Gigli, Gennarelli, De Cesare and Terrasi2012). We used a CO.FO.ME.GRA Solarbox3000e, irradiating samples using a 550-W/m2 xenon lamp for about 500 hr, at a temperature of 60°C. The chamber was also equipped with an ultraviolet (UV) filter, cutting λ<290 nm, to simulate outdoor exposure.
At the end of the aging period, a fraction of each of the poplar samples was collected for 14C AMS measurement. Each fraction was cut into small chips and then pretreated only following the ABA procedure: 1M HCl at 80°C for 1 hr, 0.1 NaOH at room temperature for 30 min, and again 1M HCl at 80°C for 1 hr. Another fraction of each of the poplar samples was used to perform FTIR analysis (Traoré et al. Reference Traoré, Kaalb and Martínez Cortizas2016). The remaining material was treated using the chloroform-based process. Typically, each sample was first cut into small chips in order to permit a better interaction between the contaminated wood and the solvent, and then inserted in a closed tube where chloroform was added (5 mL per 10 mg of sample). The treatment was performed at room temperature, on a magnetic agitator, for about 48 hr. During this period, the solvent was replaced to perform up to four extractions: after each extraction, some fragments of the samples and the liquid extracts (mixtures of chloroform and possible removed Paraloid) were collected for AMS 14C and FTIR analyses, respectively. Finally, four wooden samples and four liquid extracts for each volume of added Paraloid were obtained.
For 14C measurements, each solid fraction was dried at room temperature under a fume hood for 48 hr, treated following the standard ABA method, and finally oven-dried at 100°C. Combustion and graphitization were performed using the typical procedures of LABEC (Fedi et al. Reference Fedi, Bernardoni, Caforio, Calzolai, Carraresi, Manetti, Taccetti and Mandò2013).
In order to verify the efficiency of the procedure with respect to the number of chloroform extractions on a historically restored wooden artwork, we again used the frame of the polyptych of Ambrogio Lorenzetti used in Fedi et al. (Reference Fedi, Caforio, Liccioli, Mandò, Salvini and Taccetti2014). Two samples were collected from the same areas already dated; for coherence, in the following, we will call the samples with the already known codes OPD5 and OPD7. They were 14C dated to 15th–17th centuries AD.
AMS 14C measurements were performed using the 3MV Tandem accelerator of LABEC (Fedi et al. Reference Fedi, Cartocci, Manetti, Taccetti and Mandò2007). During the same measurement batch, NIST oxalic acid II (SRM 4990C) samples were also measured for normalization and isotopic fractionation correction (by measuring the 13C/12C ratio in the accelerator beam line too). In addition, we also measured blank samples (Santis Analytical Cyclohexanone 2,4 PNPH) to correct for the background counts, and another standard of known 14C concentration (IAEA C-7), as a check of the accuracy.
FTIR spectra on the wood samples and on the extracted solutions were acquired using a Shimadzu FTIR-8400S spectrometer with a resolution of 2.0 cm–1 and 16 scans per sample. Samples from the contaminated wood were prepared each by mixing KBr powder with about 1 mg of wooden chips. The solutions collected during the extraction with chloroform were dried in a rotary evaporator, to remove the chloroform itself, and eventually the residues were deposited on KBr plates in order to prepare the samples for analysis.
EXPERIMENTAL RESULTS
Characterization of the Applied Paraloid B-72
The 14C concentration of the Paraloid pellets has been measured as 20.96±0.16 pMC. This result partly surprised us, since we had expected a lower concentration, i.e. a concentration roughly of the same order of magnitude as that of the blank samples. However, the results showed that it is clear that such an “old” resin strongly contributes to age a sample if not completely removed.
Figure 1 shows a FTIR spectrum acquired on a drop of the Paraloid solution after acetone evaporation. The most easily recognizable band, well separated from the others, is around 1740 cm–1. This is due to the C=O stretching bond of the ester group of monomeric units derived from methyl acrylate and methyl methacrylate that constitute Paraloid B-72 (Derrik et al. Reference Derrik, Stulik and Landry1999). Other characteristic bands are present, even though they may not be so helpful for the discrimination of the resin with respect to the possible substrate, e.g. wood, as in our case. In fact, some of them are present in most of the materials (see the C-H stretching at ~3000–2900 cm–1), while some others fall in the so-called fingerprint region, which is really peculiar for each matter, but it can be strongly modified by the interference of other compounds in the same sample (e.g. see the C-H bending occurring at ~1475–1445 cm–1 and 1385–1365 cm–1, and the C-O stretching in the range 1265–1145 cm–1 and at ~1025 cm–1).

Figure 1 FTIR spectrum of Paraloid B-72 obtained after evaporation of the solvent (acetone). The most easily recognizable band is around 1740 cm–1 due to the C=O stretching bond of the ester group (see the arrow in the graph). Other bands are present: in the region 3600–3400 cm–1 they are due to O-H stretching (and can be attributed to possible residual traces of acetone), while in the region 2350–2330 cm–1, stretching is due to residual atmospheric carbon dioxide. For the other bands, see the description in the text.
Wooden Test Samples
Figure 2 shows the FTIR spectra acquired on poplar samples (the raw wood, indicated as Poplar in the figure, and the contaminated pieces). Only a qualitative interpretation can be made, considering the difficulty of preparing very homogeneous KBr pellets starting from such small quantities of wood. A weak band at about 1740 cm–1 is visible in all samples, and in the raw wood spectrum, too; some ester groups could be also present in the wood structure. However, it is possible to observe that this band is clearly more noticeable when Paraloid B-72 is applied and it basically increases as the contamination itself increases, even though a direct proportionality cannot be found.

Figure 2 FTIR spectra of the test samples collected from poplar wood samples: raw (Poplar) and contaminated (Poplar 0.15, Poplar 0.30, and Poplar 0.50). The band around 1740 cm–1 (see the arrow in the graph) can be considered as a marker of the contamination due to Paraloid B-72.
14C data are listed in Table 1 and illustrated in Figure 3, where the differences between the measured concentrations and the reference poplar concentration (Fedi et al. Reference Fedi, Caforio, Liccioli, Mandò, Salvini and Taccetti2014) are plotted. As expected, it is clear that the simple ABA pretreatment is not sufficient to remove the old contamination due to the synthetic resin. The effect of the contamination does not appear to be dependent on the applied volume of Paraloid B-72. This can be explained by considering a non-homogeneous distribution of the resin inside the sample. The efficiency of the chloroform is evident, as expected. Data show that, already after the first extraction, measured 14C concentrations approach the expected value, independently from the amount of added Paraloid. We thus assume that the contamination effect and the difficulty of its removal are more dependent on some other parameters (e.g. the state of preservation of Paraloid) rather than on its mass. After the third and fourth extractions, all the measured concentrations are consistent with the expected value within 2σ.
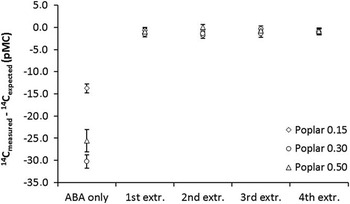
Figure 3 14C concentrations in the wood test samples contaminated with different volumes of Paraloid B-72 (0.15, 0.30, and 0.50 mL): the differences between measured values and the reference poplar concentration (Fedi et al. Reference Fedi, Caforio, Liccioli, Mandò, Salvini and Taccetti2014) are plotted.
Table 1 14C measured concentration of the wooden test samples. Uncertainties are quoted at the 1σ level. The reference 14C concentration for poplar was measured as 104.31±0.45 pMC (Fedi et al. Reference Fedi, Caforio, Liccioli, Mandò, Salvini and Taccetti2014).

Figure 4 shows the FTIR spectra acquired on the collected liquid extracts while processing the Poplar 0.50 sample. An intense band is visible around 1740 cm–1 in the spectra acquired after the first and second extractions, while in the spectra acquired after the third and the fourth extractions, the band cannot be discriminated with respect to the background noise. FTIR analyses are consistent with the 14C data: the third extraction does not contain any Paraloid, and, in fact, the 14C concentration measured in the associated wooden fraction is compatible with the expected value within 2σ, as already discussed. Another brief comment on the FTIR spectra is also relevant. The bands in the range around 2800 cm–1 and the several bands in the fingerprint region, which contribute to make it quite different from the typical Paraloid B-72 fingerprint, can be explained as interferences due to some silicone oils present in the syringe, which were used to collect the extracts and were actually dissolved by chloroform. FTIR spectra acquired on the Poplar 0.15 and Poplar 0.30 samples confirmed the aforementioned considerations (see Figures 5 and 6).

Figure 4 FTIR spectra acquired on the collected liquid extracts while processing the Poplar 0.50 sample. The band around 1740 cm–1 is very clear in the spectra acquired after the first and second extractions.

Figure 5 FTIR spectra acquired on the collected liquid extracts while processing the Poplar 0.15 sample.

Figure 6 FTIR spectra acquired on the collected liquid extracts while processing the Poplar 0.30 sample.
Samples from a Restored Artwork
In the case of the wooden samples taken from the Paraloid-contaminated frame of the Lorenzetti polyptych, it is evident that, contrary to the test samples discussed earlier, no a priori information on the “right” 14C concentration was available. However, the data presented in Fedi et al. (Reference Fedi, Caforio, Liccioli, Mandò, Salvini and Taccetti2014) showed that the 14C concentrations measured after four extractions in chloroform were consistent with the 14C concentrations we could expect on the basis of the historical attribution given by the restorers. This is the reason why, in this paper, we decided to show the concentrations now measured after 1, 2, and 3 extractions as differences with respect to those data (see Figure 7). The 14C data are also summarized in Table 2.

Figure 7 14C concentrations in wooden samples taken from a historical restored artwork: the differences between measured values and the expected concentration measured after the 4th extraction in chloroform are plotted (the data labeled as “ABA only” and “4th extr.” are taken from Fedi et al. Reference Fedi, Caforio, Liccioli, Mandò, Salvini and Taccetti2014).
Table 2 14C measured concentration of historical wooden samples collected from the frame Lorenzetti polyptych. Uncertainties are quoted at the 1σ level.

As can be observed in Figure 7, some removal of the contamination is visible already after the first extraction, even though it appears that four extractions are actually necessary to achieve a result consistent with the expected value. It can also be seen that the behavior of the measured 14C concentrations versus the number of extractions does not follow the expected trend. In fact, one could presume that the concentration increases as the number of extractions increases, with a trend roughly resembling an exponential curve. The measured behavior can be explained considering a non-homogenous distribution of Paraloid B-72 in the wood during the restoring process, as it can be likely. The possible non-homogeneity may be due either to a gradient of penetration or to a different aging of the resin from the surface into the bulk.
Comparing the results obtained on historical samples with those obtained on the test samples above, we note that there is a discrepancy. In the case of the test samples, we found that two extractions were sufficient to remove the contamination. This could be explained by considering some differences between the two cases. The test samples were prepared from quite recent wood, while the wooden restored framework is of course much older. It is well known that the older the wooden structure is, the more degraded it can be, so that the products used during restoration can penetrate deeper in the matter. Moreover, in the natural environment, many factors contribute to age the materials, both the artwork and the applied resin, e.g. fluctuations of relative humidity and temperature, and sun exposure. All these factors are fully understood, yet an artificial aging in a climatic chamber can only roughly reproduce these conditions. This is probably the best explanation for the results our test samples: the induced aging in the solar box did not degrade the wood and the resin to the same extent as natural process can do.
CONCLUSIONS
The effectiveness of the chloroform-based treatment to remove Paraloid B-72 from wooden samples to be dated by 14C has already been confirmed. In this work, we were interested in investigating the possible relationship between the removal efficiency and either the applied contaminant volume or the number of chloroform extractions. All the test wood samples (Poplar 0.15, Poplar 0.30, and Poplar 0.50) showed a similar behavior. This suggests that the removal of Paraloid B-72 is not dependent on the volume of contaminant applied on the sample. The same data also indicate that less than four extractions seem to be sufficient to remove the contamination. This would allow faster pretreatment procedures and thus permit a higher sample throughput. However, drawing the same conclusions in the case of a “real” restored artwork does not seem so straightforward. Actually, when dealing with such samples, the measurements reported herein indicate that at least four extractions are required. We can thus conclude that a very careful approach is always needed when an artwork suspected to be restored using Paraloid has to be dated, even though this can result in a reduced laboratory work rate.
ACKOWLEDGMENTS
We are grateful to Prof. Antonella Salvini, Department of Chemistry (University of Florence), for the fruitful discussion about the FTIR spectra interpretation.


