


INTRODUCTION
Radiocarbon (14C) can be used as a tracer for fossil-fuel-derived CO2 to estimate anthropogenic emissions because fossil fuels are 14C-free as a result of their age of several million years. The increase in the use of fossil fuels to cover the energy demand has altered the carbon isotopic composition of atmospheric CO2 especially in urban areas, making it possible to estimate the fossil CO2 contribution by an isotopic mass balance, comparing the 14C concentration in atmospheric CO2 (14CO2) in an urban area with the concentration of 14CO2 in “clean” air from areas isolated from anthropogenic CO2 sources (Levin et al. Reference Levin, Kromer, Schmidt and Sartorius2003; Turnbull et al. Reference Turnbull, Miller, Lehman, Tans, Sparks and Southon2006). This can be achieved either by monitoring the 14CO2 in the urban and clean atmospheres (Levin et al. Reference Levin, Kromer, Schmidt and Sartorius2003; Graven et al. Reference Graven, Stephens, Guilderson, Campos, Schimel, Campbell and Keeling2009) or by analyzing the 14C concentrations found in annual plants (Hsueh et al. Reference Hsueh, Krakauer, Randerson, Xu, Trumbore and Southon2007) or tree rings (Rakowski et al. Reference Rakowski, Nakamura and Pazdur2008; Capano et al. Reference Capano, Marzaioli, Sirignano, Altieri, Lubritto, D’Onofrio and Terrasi2010; Djuricin et al. Reference Djuricin, Xu and Pataki2012). Further, it has been demonstrated that tree rings are good biomonitors of the 14C concentration of atmospheric CO2 with annual, or even sub-annual, time resolution (Grootes et al. Reference Grootes, Farwell, Schmidt, Leach and Stuiver1989; Hua and Barbetti Reference Hua and Barbetti2004).
The Mexico City Metropolitan Area (MCMA) is a complex urban area with more than 21 million inhabitants located in a high-altitude (~2300 m asl) closed basin covering an area of 7800 km2. Considered the biggest megacity in North America, it produces high volumes of gases and aerosols derived from a variety of emission sources, including more than 5.9 million vehicles, 30,000 industries, 5.8 million households, 3 landfills, and around 900 km2 of rural, forest, and shrub-land soils (SEDEMA 2016). The rapid population growth that began in the 1950s (Escamilla-Herrera and Santos-Cerquera Reference Escamilla-Herrera and Santos-Cerquera2012) resulted in a significant deterioration of the environment, which is reflected in poor air quality. The frequency of extremely high pollution events during the last years of the 1980s encouraged the implementation of a series of environmental policies through the PICCA (Primer Programa Integral contra la Contaminación Atmosférica) and PROAIRE (Programa para Mejorar la Calidad del Aire en el Valle de México) programs (DDF 1990, 1996).
Some of the environmental strategies included the decentralization of the industrial sector, the closure in 1991 of a refinery with capacity of 7500 barrels of petroleum per day, emission controls for industry, introduction of catalytic converters in motor vehicles and the addition of oxygenated compounds to gasoline to improve the combustion efficiency and reduce contaminants, as well as circulation restriction once a week for private motor vehicles, among others (DDF 1990, 1996). With the introduction of these environmental programs, the number of days with air quality worse than the local standards reduced significantly, improving energy efficiency and reducing CO2 emissions during the 1990s (SEDEMA 2012). However, the MCMA continued its unplanned growth during the first decade of the 21st century, further deteriorating the environment despite the programs implemented in the 1990s. It becomes relevant not only to continue the pollution monitoring programs and produce emission inventories, but also to try to reconstruct the CO2 emissions history to evaluate the effect of the environmental policies.
The few previous studies of atmospheric 14CO2 in the MCMA have reported anomalously high 14C levels. Vay et al. (Reference Vay, Tyler, Choi, Blake, Blake, Sachse, Diskin and Singh2009) reported Δ14C values of up to 75‰ higher than the background for CO2 samples collected in MCMA during March 2006. They attributed this to an important contribution from 14C-enriched CO2 sources, such as burning of biomass with a mean age of 35 yr and Δ14C of around 500‰, or even other hotter sources including burning of radioactive wastes from hospitals and 14CO2 emitted by the Laguna Verde nuclear power plant on the Gulf of Mexico coast, 290 km from MCMA. Further, a study of spatial variations of 14CO2 in integrated atmospheric CO2 samples also reported values higher than background for samples taken during the dry-warm season. This was attributed to emissions of 14C-enriched CO2 during the frequent forest fires in the mountains during the sampling period (Beramendi-Orosco et al. Reference Beramendi-Orosco, Gonzalez-Hernandez, Martinez-Jurado, Martinez-Reyes, Garcia-Samano, Villanueva-Diaz, Santos-Arevalo, Gomez-Martinez and Amador-Muñoz2015). Initial results for tree rings were reported in the same work, with an apparent higher 14C-dilution during the 1960s than in the recent years, despite the population increase and thus the growth in the consumption of fossil fuels since the 1970s. From these works it becomes evident that the 14C dynamics in such a complex city makes the direct use of 14C as a tracer fossil CO2 a difficult task that deserves attention.
This work is part of a research program that aims to understand the 14C dynamics in the MCMA and identify CO2 emission sources, and eventually contribute to validation of the emissions inventories. Here we report 14C concentrations in tree rings from an urban forest within the MCMA and a reconstruction of the fossil CO2 concentration for the last five decades.
MATERIALS AND METHODS
Sampling Sites
The sampling site within the MCMA was Bosque de Chapultepec, the largest public park in the city. It is an urban forest located within the downtown district in the northwest area of Mexico City (from 19°23′40″ to 19°25′45″N and 99°10′40″ to 99°14′15″W, Figure 1). The vegetation includes 130 native and introduced species, with ahuehuete or sabino (Taxodium mucronatum Ten.) as one of the dominant native tree species. This sampling site was selected based on the fact that this location has been inside the urban area for centuries, and because it opens the possibility of sampling trees that are exposed to a more representative atmosphere of the city and not directly exposed to a main emission source, as would be trees growing adjacent to main avenues. Further, a master T mucronatum Ten. dendrochronology has been previously reported for this site (Villanueva-Diaz et al. Reference Villanueva-Díaz, Stahle, Therrel, Cleaveland, Camacho Morfín, Núñez Díaz de la Fuente, Gómez Chávez, Sánchez Sesma and Ramírez García2003). The climate in MCMA is tempered by altitude and influenced by tropical air masses during summer (May to October) and mid-latitude cold air masses from North America during winter (Jauregui 2004). The mean annual temperature is 16°C and the annual precipitation, concentrated during the summer months, is 700–1200 mm in the central and southern parts (Jauregui 2004; INEGI 2014). The dominant wind direction in the sampling area is from the NW (Figure 2).
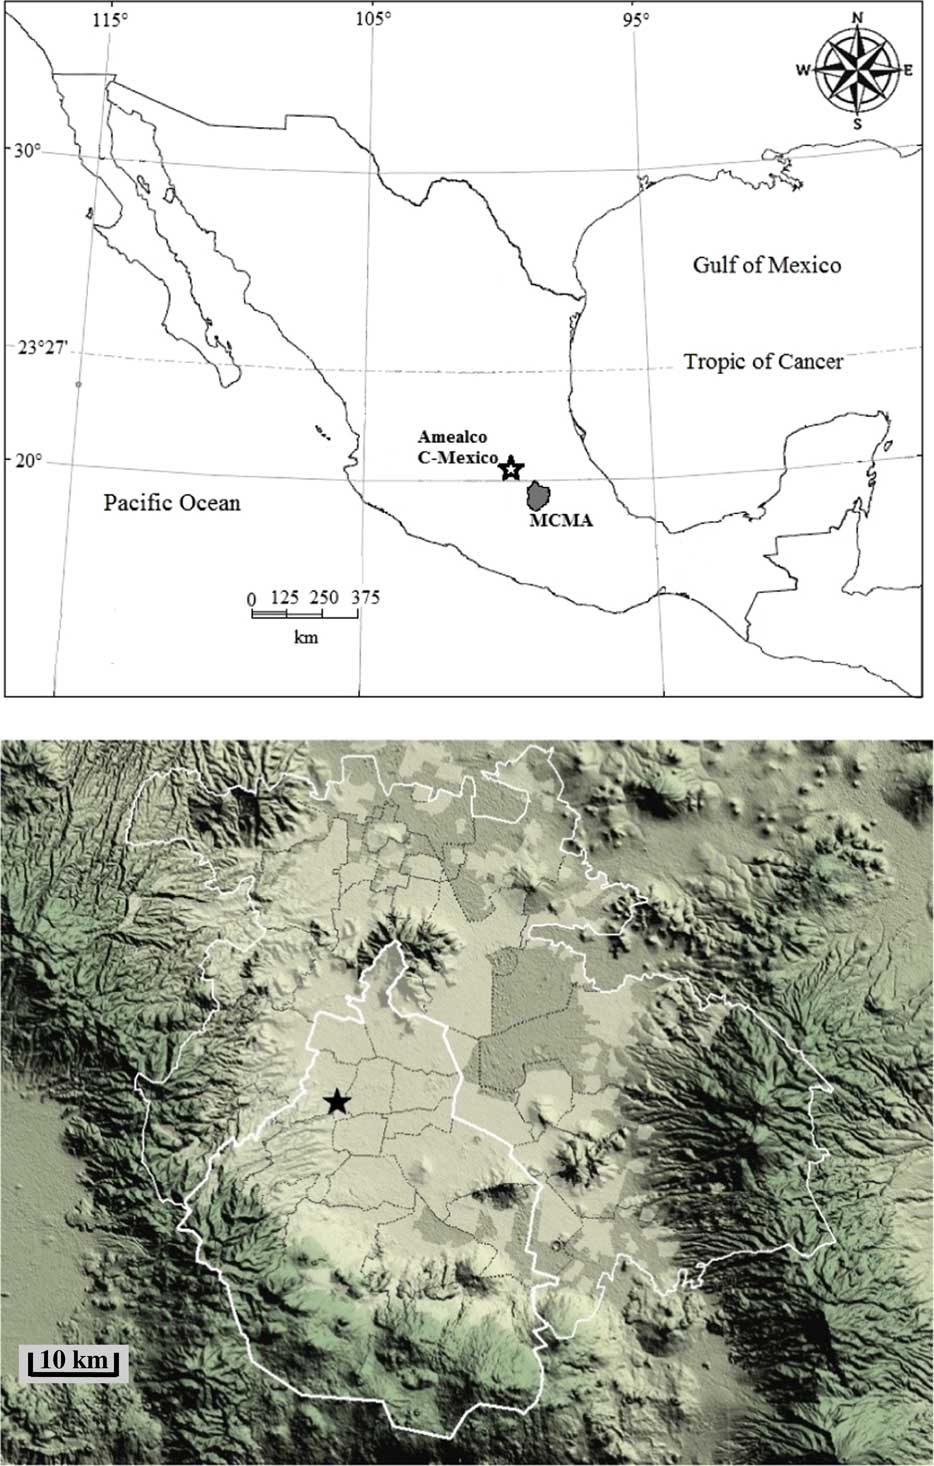
Figure 1 (Top) Map of Mexico showing location of Mexico City Metropolitan Area (grey area) and the background site in central Mexico (black star); (bottom) relief map of the MCMA showing sampling site (black star) and the limits of Mexico City and the Metropolitan Area (white lines). Maps modified from INEGI (2016) (http://cuentame.inegi.org.mx/mapas/nacional.aspx?tema=M).
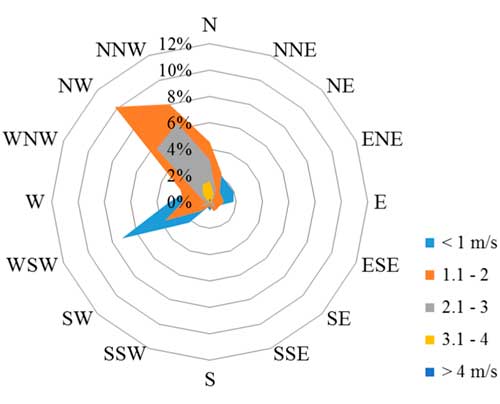
Figure 2 Wind rose for the sampling area in MCMA for 2010 (data correspond to Tacuba meteorological station, located 4 km to the NNW of Chapultepec Park, available from http://www.aire.cdmx.gob.mx/default.php?opc=%27aKBhnmI=%27&opcion=Zw==).
The sampling site selected as a background area representative for latitudes close to Mexico City corresponds to Barranca de Amealco, Querétaro (20°21′50″N, 100°06′22″W, Figure 1), a steep gorge located in an uncontaminated area away from the influence of urban areas, 140 km from Mexico City. This site was selected because the same tree species is present and a master tree-ring chronology has already been reported (Stahle et al. Reference Stahle, Villanueva-Diaz, Burnette, Cerano-Paredes, Heim, Fye, Acuña-Soto, Therrell, Cleaveland and Stahle2011).
Tree-Ring Sampling and Dendrochronological Dating
Healthy and relatively young specimens of T mucronatum Ten., the dominant native species present at both sampling sites, were sampled using a 12-mm Pressler incremental borer at about 1.5 m height, taking three increment cores from each tree to assure an accurate dating and avoid false or missing rings. Trees were selected based on the diameter at breast height to have a similar age and to cover a time period back to at least 1950. Sampling in the Bosque de Chapultepec site was performed in May 2012 and in Barranca de Amealco during March 2013.
Samples were mounted on wooded core mounts, dried for 48 hr at 60°C, and sanded with increasing grit number sandpaper (400–1500) to expose cell structures (Stokes and Smiley Reference Stokes and Smiley1968). To avoid cross-ring contamination, the generated dust was removed with a brush and vacuum. The annual rings were counted under stereoscopic microscopes and the chronologies were established by comparison with the master chronologies already reported for this species (Villanueva-Diaz et al. Reference Villanueva-Díaz, Stahle, Therrel, Cleaveland, Camacho Morfín, Núñez Díaz de la Fuente, Gómez Chávez, Sánchez Sesma and Ramírez García2003; Stahle et al. Reference Stahle, Villanueva-Diaz, Burnette, Cerano-Paredes, Heim, Fye, Acuña-Soto, Therrell, Cleaveland and Stahle2011).
Sample Preparation and Analysis
Rings exactly dated to their years of formation, from a single tree from each sampling site, were separated using a stainless steel blade and cut into small pieces to facilitate the pretreatment procedure. Sample pretreatment and accelerator mass spectrometry (AMS) analyses were performed at the Centro Nacional de Aceleradores, Seville, Spain. Samples were cleaned by Soxhlet extraction using a solvent sequence of hexane, acetone, and ethanol, followed by cellulose extraction applying the procedure reported in Nemec et al. (Reference Nemec, Wacker, Hajdas and Gäggeler2010). Prior to analysis, samples were graphitized using an automated graphitization equipment (AGE) system (Wacker et al. Reference Wacker, Nemeç and Bourquin2010a), which couples an elemental analyzer to the graphitization unit. Approximately 3 mg of clean and dry cellulose was combusted in an elemental analyzer using tin foils to wrap the sample. The gases produced during the combustion are released sequentially as the temperature in a chromatographic column increases. When CO2 is released, the gas is injected into the corresponding reactor in the graphitization unit, containing Fe as a catalyst. Finally, H2 is added to the reactor. Once all the reactors have been filled, the reaction takes place. Ovens heat the lower part of the reactor where the CO2 is reduced to graphite and adheres to the iron, and Peltier coolers are used to freeze the water produced in the reaction. The system prepares samples of ca. 1 mg C.
Analyses were performed using the MICADAS system (Synal et al. Reference Synal, Stocker and Suter2007). The MICADAS uses a 200 kV power supply to accelerate ions to the stripper, selecting charge state 1+ after the stripping process, for a total ion energy of 440 keV. 14C ions are counted in an ionization chamber, and stable isotopes are measured in corresponding Faraday cups at the high energy side. The major interference in the identification of 14C is the scattered molecular fragment 13C coming from the 13CH molecule, which cannot be identified by the signal in the ionization chamber. Thus, a special Faraday cup located next to the others measures the current from this molecular fragment, allowing a correction in the number of counts given by the detector. Samples were measured for 1 hr and data were analyzed using the BATS tool software (Wacker et al. Reference Wacker, Christl and Synal2010b). Oxalic acid II (SRM 4990C) was used as the normalization standard. The 14C results are reported as F14C and Δ14C corrected for both isotopic fractionation and decay (Stuiver and Polach Reference Stuiver and Polach1977; Reimer et al. Reference Reimer, Brown and Reimer2004).
Fossil CO2 Calculations
The rationale for estimating the concentration of fossil CO2 ([CO 2 ] fossil ) through an isotopic mass balance has been reported previously by other research groups (see for example Levin et al. Reference Levin, Kromer, Schmidt and Sartorius2003, Reference Levin, Hammer, Kromer and Meinhardt2008; Turnbull et al. Reference Turnbull, Miller, Lehman, Tans, Sparks and Southon2006, Reference Turnbull, Graven and Krakauer2016). The concentration of fossil CO2 was estimated using Equation 1, considering that fossil fuels do not contain 14C (F14C = 0).
 $$\left[ {CO_{2} } \right]_{{fossil}} {\equals}\left[ {CO_{2} } \right]_{{Bkg}} \left( {{{F^{{14}} C_{{Bkg}} {\minus}F^{{14}} C_{{sample}} } \over {F^{{14}} C_{{Bkg}} }}} \right){\plus}\left[ {CO_{2} } \right]_{{Other}} \left( {{{F^{{14}} C_{{Other}} {\minus}F^{{14}} C_{{Bkg}} } \over {F^{{14}} C_{{Bkg}} }}} \right)$$
where [CO 2 ] fossil is the estimated mole fraction, in ppm, of CO2 derived from fossil emissions sources, [CO 2 ] Bkg is the atmospheric CO2 mole fraction in the background area, F 14 C Bkg and F 14 C sample are the 14C concentrations in tree rings from the background and the MCMA sampling sites, respectively. The second term of the equation corresponds to the CO2 contributions from non-fossil sources, including heterotrophic respiration, biomass burning and emissions from nuclear industry (i.e. nuclear power plants and combustion of radioactive medical wastes), among others, where [CO 2 ] Other is the mole fraction of this non-fossil CO2 in the local atmosphere and F 14 C Other is the weighted mean radiocarbon concentration in these sources (Turnbull et al. Reference Turnbull, Graven and Krakauer2016). Despite that the contribution from this term to the calculated [CO 2 ] fossil is usually small, especially in urban areas, it should be accounted for (Turnbull et al. Reference Turnbull, Miller, Lehman, Tans, Sparks and Southon2006; Levin et al. Reference Levin, Hammer, Kromer and Meinhardt2008). In the MCMA, the main non-fossil CO2 sources are heterotrophic respiration and biomass burning, with a negligible contribution from nuclear industry. The heterotrophic respiration and biomass burning can have similar F14C, as both derive from organic matter with a mean age of the same order, and their contribution to the [CO2] mole fraction can be variable, with heterotrophic respiration being larger during the raining summer months and biomass burning during the dry season (winter–early spring) either from forest fires and/or from biomass combustion as fuel. Because the period when the tree fixes most of the carbon in the growth-rings is the summer, we consider heterotrophic respiration as the main factor in this term. Regarding the nuclear industry sources, we consider this is smaller than the overall uncertainty of the [CO 2 ] fossil because the only nuclear power plant in Mexico (Laguna Verde, Veracruz on the Gulf of Mexico coast) is located 300 km to the E of the MCMA, and it has been reported that the effect from these sources to the estimated [CO 2 ] fossil is of the order of −0.25 ppm over large regions, becoming significant (higher than the overall uncertainty) only in the vicinity of nuclear sites (Graven and Gruber, Reference Graven and Gruber2011). With these considerations, we estimated [CO 2 ] Other to be 5 ppm, which corresponds to the value proposed by Turnbull et al. (Reference Turnbull, Miller, Lehman, Tans, Sparks and Southon2006) for summer and F 14 C Other was calculated assuming a terrestrial carbon mean residence time of 10 yr. With these assumptions, the magnitude of this term ranges between –1 and 0.4 ppm, with values for the 1960–1980 period being negative because the organic matter was 14C-depleted as compared to the atmosphere, indicating that not considering respiration would result in overestimating the calculated [CO 2 ] fossil , whereas the positive values obtained for the las decades indicate that if not considered, the fossil CO2 mole fraction would be sub-estimated because for the post-1980 the heterotrophic respiration became a 14C source to the atmosphere (Randerson et al. Reference Randerson, Enting, Schuur, Caldeira and Fung2002). However, the magnitude of this contribution is smaller than the overall uncertainty of [CO 2 ] fossil .
The overall uncertainty of the calculated [CO 2 ] fossil was estimated by considering the combination of component errors according to the following model (Doebelin Reference Doebelin1990):
 $$\Delta \left[ {CO_{2} } \right]_{{fossil}} {\equals}\left| {\Delta u_{1} {{\partial \left[ {CO_{2} } \right]_{{fossil}} } \over {\partial u_{1} }}} \right|{\plus}\left| {\Delta u_{2} {{\partial \left[ {CO_{2} } \right]_{{fossil}} } \over {\partial u_{2} }}} \right|{\plus}\left| {\Delta u_{3} {{\partial \left[ {CO_{2} } \right]_{{fossil}} } \over {\partial u_{3} }}} \right|{\plus}\left| {\Delta u_{4} {{\partial \left[ {CO_{2} } \right]_{{fossil}} } \over {\partial u_{4} }}} \right|$$
where Δ denotes uncertainty, u 1 corresponds to [CO 2 ] Bkg , u 2 to F 14 C Bkg , u 3 to F 14 C sample , and u 4 to F 14 C Other . The terms with strongest influence on the overall error are F 14 C Bkg and F 14 C sample , resulting in uncertainties higher than ± 2.5 ppm.
Finally, the [CO 2 ] Bkg has not been measured in the background sampling area, so we assume this corresponds to the annual mean values reported for Mauna Loa monitoring station, considered as representative of global clean air (Tans and Keeling Reference Tans and Keeling2016).
RESULTS AND DISCUSSION
Radiocarbon concentrations in tree rings from both sampling sites are plotted in Figure 3 and tabulated in Table 1. Tree ring 14C data from the Northern Hemisphere zone 2 curve (NH-2) compiled by Hua et al. (Reference Hua, Barbetti and Rakowski2013) are plotted for comparison and assessment of the results obtained.
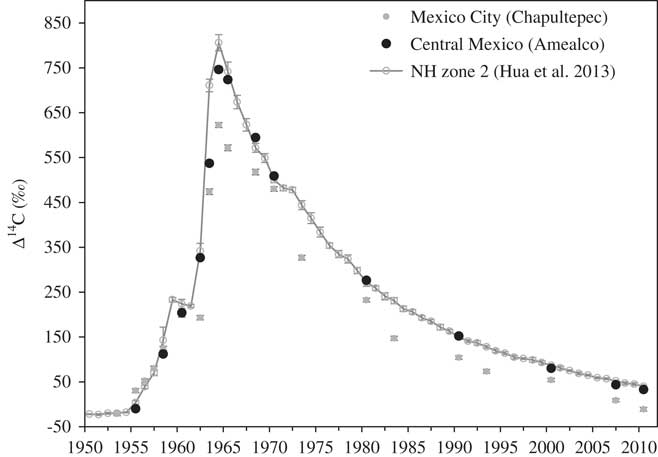
Figure 3 Δ14C values for tree rings from Chapultepec Park, Mexico City (grey circles), and tree rings from Amealco (Central Mexico background, black circles). Background values from NH zone 2 (Hua et al. Reference Hua, Barbetti and Rakowski2013, line with open circles) are plotted for comparison. Vertical error bars correspond to ±1σ, but for most of the samples symbols are bigger than the error.
Table 1 Radiocarbon values for Taxodium mucronatum Ten. tree-ring samples from Chapultepec Park (Mexico City) and from Amealco, Querétaro (Central Mexico, background site).
Establishing Background Atmospheric 14C Concentrations for Central Mexico—14C Variations in Amealco
The results obtained for Amealco (C-Mexico) tree rings are in good agreement with the NH-2 curve (Figures 3 and 4), with a highly significant correlation coefficient (r = 0.987, P<0.001) and the bomb peak centered during 1964. These results demonstrate the annual nature of T mucronatum growth rings and indicate that the dendrochronological dating was accurate. However, there are significant differences in the magnitude of the 14C excess during the sharp increase of the bomb peak years (1963 and 1964, Table 2), with values for the Amealco tree rings significantly lower than the NH-2 curve by 174 and 60‰, respectively. These differences may be a consequence of atmospheric circulation in Central Mexico, characterized by winds from the south, carrying 14C-depleted air during the summer months (Beramendi-Orosco et al. Reference Beramendi-Orosco, Gonzalez-Hernandez, Villanueva-Diaz, Santos-Arevalo, Gomez-Martinez, Cienfuegos-Alvarado, Morales-Puente and Urrutia-Fucugauchi2010). Values for post-1970 years are in close agreement with the NH values, as a consequence of the global distribution of excess 14C; however, because the NH-zone 2 values do not include 14C data from North America and the compilation considered only datasets that were not strongly influenced by regional fossil CO2 emissions (a dilution within the ±1σ of analytical uncertainty; Hua et al. Reference Hua, Barbetti and Rakowski2013), the selection of the background dataset is a relevant issue in order to make a better estimate of the local radiocarbon dilution (Turnbull et al. 2015). The C-Mexico 14C values for 1970, 1980, and 1990 tree rings are within ±1σ of the Hua et al. (Reference Hua, Barbetti and Rakowski2013) compilation, but values for 2000, 2007, and 2010 tree rings, despite being within ±2σ, C-Mexico values are lower than the mean values for the NH hemisphere (Table 2), reflecting some dilution as a result of regional fossil CO2 emissions over Central Mexico. Because our aim is to estimate the local [CO 2 ] fossil for the central area of the MCMA, using NH-zone 2 data as background would result in overestimating the radiocarbon dilution, as it would consider the local emissions the tree is exposed to but also the regional fossil emissions (Turnbull et al. 2015). With this consideration, the Amealco tree ring 14C data would seem a more appropriate regional background for Central Mexico, and was further evaluated by HYSPLIT model back trajectories (Stein et al. Reference Stein, Draxler, Rolph, Stunder, Cohen and Ngan2015; Rolph et al. Reference Rolph, Stein and Stunder2017) for the beginning and end of the growing season (March and September) for years 1990, 2000, and 2010, confirming that this dataset is indeed appropriate as background for the MCMA as both sites receive air mases from similar regions (Figure 5).
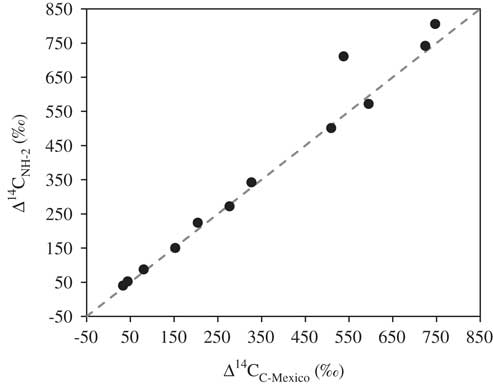
Figure 4 Δ14C values for Central Mexico tree rings versus NH zone 2 values. The dashed line represents the line of identity.
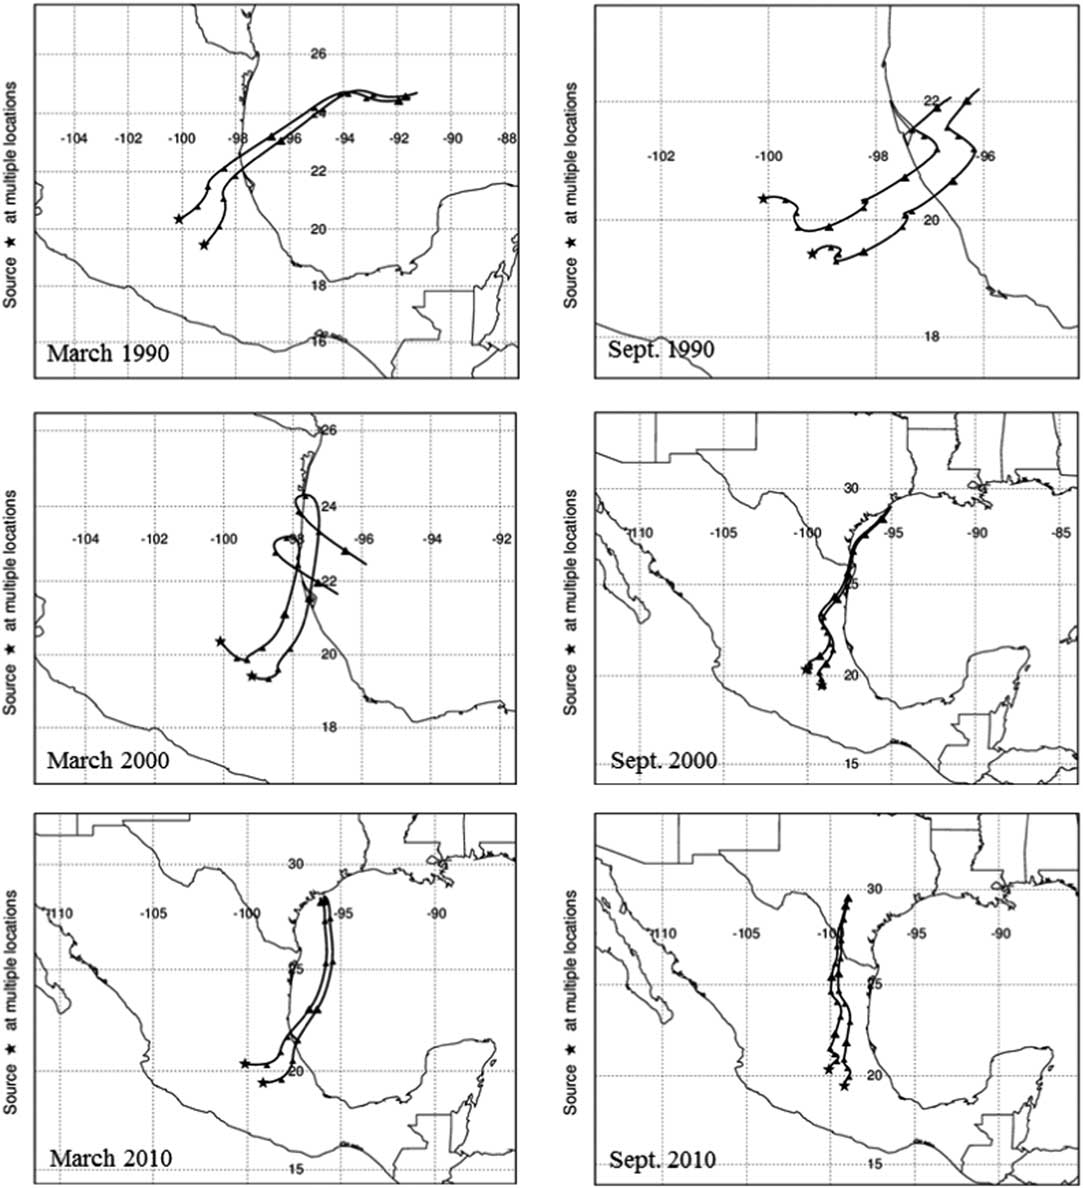
Figure 5 Three-day air back-trajectories for the beginning and ending of the growing season at MCMA and Central Mexico produced by HYSPLIT (Stein et al. Reference Stein, Draxler, Rolph, Stunder, Cohen and Ngan2015; Rolph et al. Reference Rolph, Stein and Stunder2017) at 10 m above ground level using the REANALYSIS dataset.
Table 2 Difference between Δ14C values obtained for Amealco, Central Mexico, and data from the NH-zone 2 curve (Hua et al. Reference Hua, Barbetti and Rakowski2013). Significant differences are marked in bold.
Temporal Variations of 14C in Tree Rings from the Mexico City Metropolitan Area
An important feature of the Mexico City record is that the bomb-peak is centered during 1964, confirming the accurate dating of the annual growth bands of T. mucronatum. The Δ14C values are lower than values from both background records (C-Mexico and NH-2), except for the 1955–1957 period. Although the 14C depletion in the Mexico City record was expected as it is an urban area with vast volume of fossil-fuel-derived CO2 emissions; it appears that the 14C dilution is not constant. During the 1960s the Δ14C values are up to 134‰ lower than the C-Mexico values, whereas for the 1970–2010 period the values for the Mexico City tree rings are between 26 and 49‰ lower than the background values. A possible explanation for the high 14C dilution found for the 1960s may be related to different factors such as the heterogeneity of the excess 14CO2 during those years and the geography of the Mexico City Basin, and not to a higher volume of fossil CO2 emissions, which was not a dominant factor of the Δ14C spatial variability during the years of the sharp increase of atmospheric radiocarbon (Turnbull et al. Reference Turnbull, Graven and Krakauer2016). Furthermore, during the first years of the 14C perturbation, heterotrophic respiration was relatively depleted in 14C as compared to the local atmosphere, because it derived from pre-bomb organic matter, and became relatively enriched during the 1980s as it derived from organic matter that had assimilated the bomb 14C (Randerson et al. Reference Randerson, Enting, Schuur, Caldeira and Fung2002). This may also explain the higher 14C dilution during the peak years (1962–1967) that have been reported for tree rings from other urban areas (Rakowski et al. Reference Rakowski, Pawelczyk and Pazdur2001, Reference Rakowski, Nakamura and Pazdur2008; Beramendi-Orosco et al. Reference Beramendi-Orosco, Sergio Hernandez-Morales, Gonzalez-Hernandez, Constante-Garcia and Villanueva-Diaz2013).
Fossil CO2 Concentration and Possible CO2 Emission Sources in MCMA
The reconstruction of the fossil CO2 concentration was evaluated excluding the bomb-peak years in order to avoid the years with high atmospheric 14C heterogeneity (Figure 6). As discussed above, the [CO 2 ] fossil were calculated using C-Mexico data as background to estimate the local contribution of fossil CO2. The obtained values range between 5.5 and 16.5 ppm (overall uncertainties range between ±2.9 and ±3.2), with a general increasing trend; however, a fossil-CO2 decrease between 1990 and 2000 is apparent with a further increase between 2000 and 2010. The increase in fossil CO2 mole fraction since 1960 was expected, as the population grew from 9 million inhabitants to 14.9 million in 1990, and to more than 20 million in 2010 (Escamilla-Herrera and Santos-Cerquera Reference Escamilla-Herrera and Santos-Cerquera2012). The population growth increased the energy demand and thus fossil fuels consumption, as well as CO2 emission sources containing 14C, such as biomass burning, either as a fuel or in fires intentionally set to clear land for the expanding urban area, and heterotrophic respiration. Biomass burning, however, is assumed to have a not significant effect in the tree ring Δ14C values, as they integrate mainly carbon fixed during the summer months, when this is not a significant source of CO2. By contrast, heterotrophic respiration may have increased as a result of deforestation for expanding the urban area because the effect of such disturbance may result in transforming the ecosystem from a C sink to a CO2 source to the atmosphere (Harmon et al. Reference Harmon, Bond‐Lamberty, Tang and Vargas2011), thus could have an effect during the summer months; however, the contribution from this source to the estimated [CO 2 ] fossil is smaller than the overall uncertainty.
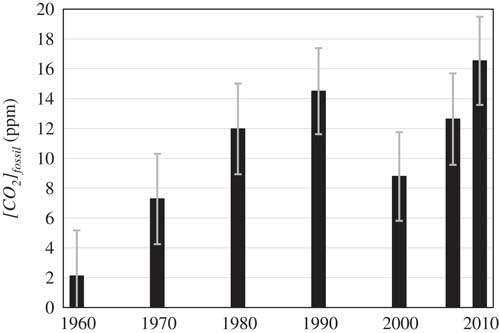
Figure 6 Reconstruction of the fossil CO2 mole fraction (in parts per million, ppm) in Mexico City using Central Mexico (C-Mexico) Δ14C values as background. Error bars represent the overall uncertainty and range between 2.9 and 3.2 ppm.
Notwithstanding the tree ring Δ14C values and the corresponding estimated [CO 2 ] fossil reflect only the local CO2 the tree is assimilating, the fact that the sampling site is located in the downtown district enables us to consider these values as representative of the central urban area. The apparent decrease in [CO 2 ] fossil between 1990 and 2000, although being of the same magnitude as the associated uncertainty, may reflect the implementation of the environmental policy programs implemented during the 1990s (PICCA in 1991 and PROAIRE in 1996), even though total fossil fuel consumption in the MCMA increased from 34,632 thousand barrels/year in 1990 to 43,365 thousand barrels/year in 2000, mainly as a result of the population increase in peripheral urban areas (SEDEMA 2000). Among the measures that may have had an effect in the local fossil CO2 mole fraction are the closure of the refinery in 1991 and the mandatory one-day per week no-circulation program, which reduced by 20% the number of private vehicles circulating in the area every weekday. The refinery was located 5 km NNW from the tree-ring sampling site, downwind in the path of the dominant wind direction (Figure 2), so it was presumably a significant fossil CO2 source in the tree sampling area. In contrast, from 2000 to 2010 the carbon economy intensified, resulting in a significant increase in motor vehicle usage, doubling the number of registered private vehicles between 2000 and 2010 and increasing the time spent in road traffic, especially in the central urban area (OECD 2013). This made transportation the main energy-demanding and polluting sector in the last decade, despite the cleaner technologies and fuels implemented during the 1990s (SEDEMA 2012). These changes seem to be reflected in the F14C of tree rings and the estimated fossil CO2 mole fraction, which nearly doubled in the 2000s decade.
Variability of atmospheric transport may be another factor having influence on the variations of estimated [CO 2 ] fossil , changing the contribution from the different CO2 sources available to the tree (Levin and Rödenbeck Reference Levin and Rödenbeck2008; Keller at al. Reference Keller, Turnbull and Norris2016). However, the fact that the sampling site is an urban forest immersed in the city and surrounded by important avenues, making traffic the main CO2 source, suggests that changes in the wind direction would have a small impact on the variations we are finding.
Finally, as mentioned in the introduction, previous studies have found higher than background F14C values for instantaneous and monthly integrated atmospheric CO2 samples from the MCMA during the dry warm season (March–April), suggesting considerable CO2 emissions from 14C-enriched sources, such as burning of biomass and topsoil organic matter during forest fires (Vay et al. Reference Vay, Tyler, Choi, Blake, Blake, Sachse, Diskin and Singh2009; Beramendi-Orosco et al. Reference Beramendi-Orosco, Gonzalez-Hernandez, Martinez-Jurado, Martinez-Reyes, Garcia-Samano, Villanueva-Diaz, Santos-Arevalo, Gomez-Martinez and Amador-Muñoz2015). However, the contribution from these 14C-enriched CO2 sources to the tree rings Δ14C values and the [CO 2 ] fossil estimated here seems to be not significant because the tree rings integrate the local CO2 assimilated mainly during the wet summer months, when these sources are smaller because forest fires are not common.
CONCLUSIONS
The F14C values obtained indicate that tree rings of Taxodium mucronatum Ten. are good biomonitors of the atmospheric 14CO2 concentration with annual resolution, allowing not only the reconstruction of the 14C bomb-peak variation for C-cycle studies, but also the estimation of fossil CO2 concentration in urban areas. This is relevant because this tree species is widely distributed in North America, particularly in Mexico, where there has been a lack of information on the 14CO2 concentration throughout the 20th century.
Establishing background atmospheric 14C concentrations for Central Mexico is important because the NH-2 curve does not include data from North America, and previous studies had reported that the 14C bomb-peak variation for NW Mexico was significantly lower than the NH-2 values. Further, having a background representative for Central Mexico enables a more accurate estimation of the local fossil CO2 concentration in Mexico City.
The reconstruction of the fossil CO2 concentration for Mexico City suggests there was a positive impact of the implementation of environmental programs in the 1990s, but highlights the worrying increase since 2000, this presumably as a result of the increase in motor vehicle usage in the MCMA. More work is needed to gain a better understanding of the factors that influence the [CO 2 ] fossil variations we are finding, including changes in atmospheric transport. Improving the resolution of the data and analyzing 14C in tree rings from other sites within the MCMA would help toward this.
The integration of the results presented here with the previous data obtained in the research program of 14C dynamics in the MCMA are a step forward to understand the impact of different CO2 emission sources in this complex urban area.
ACKNOWLEDGMENTS
This research was funded by DGAPA–UNAM (project PAPIIT-IN106113). Scholarships from CONACyT and Instituto de Geología for AMR are gratefully acknowledged. Thanks are also due to the authorities of Bosque de Chapultepec for granting permission for sampling the tree-ring sequences. The authors gratefully acknowledge the NOAA Air Resources Laboratory (ARL) for the provision of the HYSPLIT transport and dispersion model and/or READY website (http://www.ready.noaa.gov) used in this publication. Comments by Jocelyn C Turnbull and an anonymous reviewer helped to improve this article.


