


INTRODUCTION
The analysis of radiocarbon (14C) activity in the environment reveals its changes, which can be correlated with the influence of the natural carbon cycle processes and anthropogenic activity. 14C is produced in upper layers of the atmosphere by cosmic rays activating mainly the nitrogen atoms. Production of atmospheric 14C is counteracted with slow removal by the radioactive decay (half-life is 5730 yr) and rapid processes of global carbon cycle due to the CO2 exchange. CO2 is removed by the oceans due to chemical transformation into the carbonates and by the capture and incorporation into organic materials of the 14CO2 by the autotrophic organisms, mainly plants. These processes are responsible for the fast removal of 14CO2 excess (Stuiver and Polach Reference Stuiver and Polach1977; Stuiver Reference Stuiver1983) from the atmosphere after the nuclear weapon tests of 1950s and 1960s. One remarkable mechanism of 14C activity (per gram of C) reduction in the atmosphere is the Suess effect, which is the dilution of the 14C due to admixture of 14C-free CO2 from fossil fuel burning installations, mainly transport and industry (Suess Reference Suess1955). This phenomenon can be used to detect the CO2 emissions of the fossil fuel origin coming from thermal power plants or, e.g., leakages of carbon capture and storage (CCS) installations (Turnbull et al. Reference Turnbull, Keller, Norris and Wiltshire2017).
Nuclear power plants (NPP) are also sources of 14C release to the environment, along with other radionuclides, mostly of noble gasses, iodine, tritium. The 14C in nuclear reactors is generated mainly by neutron reactions with 17O, 14N and 13C isotopes present in the reactor core, moderator and coolant. The main source of 14C in light water reactors is the coolant and graphite moderator in High temperature gas-cooled (HTGR), Advanced gas-cooled (AGR), Magnox and High power channel-type reactors (RBMK) (Kunz Reference Kunz1985; Yim and Caron Reference Yim and Caron2006). From pressured water reactors (PWR), the 14C is released mainly in the chemical form of hydrocarbons, such as methane or ethane, as well as carbon dioxide (13–30%) (Veres et al. Reference Veres, Hertelendi, Uchrin, Csaba, Barnabás, Ormai, Volent and Futó1995; Van der Stricht and Janssens Reference Van der Stricht and Janssens2001; Povinec et al. Reference Povinec, Šivo, Šimon, Holý, Chudý, Richtáriková and Morávek2008). In boiling water reactors (BWR) and reactors with graphite moderator (HTGR, AGR, Magnox, RBMK) dominant 14C releases are in the form of carbon dioxide (Gaiko et al. Reference Gaiko, Korablev, Solovev, Trosheva, Shamov, Umanets and Shcherbina1985; Stenström et al. Reference Stenström, Erlandsson, Mattsson, Thornberg, Hellborg, Kiisk, Persson and Skog2000; Yim and Caron Reference Yim and Caron2006; Mažeika et al. Reference Mažeika, Petrošius and Pukienė2008). Once generated, the gaseous chemical compounds containing 14C are released to the environment either through special venting equipment during the operation or during reactor shutdowns. In particular, RBMK type reactors have ejectors for the separation and release of gaseous products from the turbine condensers to the ventilation system and finally to the atmosphere (Remeikis et al. Reference Remeikis, Juodis, Plukis, Vyčinas, Rožkov and Jasiulionis2012). Although the ventilation system of the RBMK reactors is equipped with special filters (aerosol, activated carbon, zeolite absorber and mechanical filters), some fraction of the 14C is released to the environment. e.g., the total 14C release to the environment was 2.2·1010 Bq for the year 2008, 80% of this was released from the Unit 2 reactor building 101/2 as an airborne discharge when Unit 2 was still in operation (VATESI 2009).
The release of 14C can be confirmed by tree-ring analysis of the samples collected from the vicinity of a NPP, as the slight increase of 14CO2 concentration in the air is recorded as a pattern in the tree rings due to photosynthesis process and incorporation of 14CO2 into cellulose matrix of tree wood. The airborne releases are responsible for the slight increase of the 14C concentration, which can be detected with modern measurement equipment, mainly by accelerator mass spectrometry (AMS). E.g., in Žlkovce (monitoring station situated 5 km away from Bohunice NPP) Δ14C was measured up to 300‰ (130 pMC), however near Dukovany NPP (Chech Republic) this was negligible resulting in 5‰ (0.5 pMC) increase in Δ14C (Svetlik et al. Reference Svetlik, Fejgl, Turek, Michalek and Tomaskova2012; Povinec et al. Reference Povinec, Šivo, Ješkovský, Svetlik, Richtáriková and Kaizer2015). A slight increase was also observed at Barseback nuclear power plant (Sweden) and the vicinity of Paks nuclear power plant (Hungary) (Stenström et al. Reference Stenström, Thornberg, Erlandsson, Hellborg, Mattsson and Perssoni1998; Janovics et al. Reference Janovics, Kern, Güttler, Wacker, Barnabás and Molnár2017).
In our previous study (Ežerinskis et al. Reference Ežerinskis, Šapolaitė, Pabedinskas, Juodis, Garbaras, Maceika, Druteikienė, Lukauskas and Remeikis2018), 14C activity was analysed in the tree rings from one site close to the INPP located in northeastern part of Lithuania (geographical coordinates 55º61’86”N, 26º58’22”E). The background activity of 14C was measured in the tree rings in Vaikšteniai village area (54º46’92”N, 24º77’81”E), located 165 km away from INPP in opposite to the predominant wind direction. That study revealed the local influence of the operating INPP. Moreover, the elevated 14C activity levels were also measured in the tree rings corresponding to the period after the shutdown of Unit 1 on December 31, 2004 and Unit 2 on December 31, 2009. This observation was attributed to post-shutdown activities related to the dismantling of the plant equipment and management operations of radioactive waste at the INPP. Also, the precise measurement with the AMS provided evidence of the additional influence of the maintenance activities of the reactors at Ignalina NPP during the operational period of the plant.
In this article we provide a deeper insight into 14C distribution in the tree rings in the close vicinity of Ignalina NPP. In this study, the pine trees have been investigated providing the net of the monitoring points around INPP. The main idea was to check whether the radiocarbon can be used as a natural indicator of the airborne releases during the NPP operation which is recorded as an activity pattern in the tree rings. Moreover, this is of particular importance for the past practices of NPP operations when 14C releases were not registered and therefore the indirect measurement method like the tree-ring analysis serves as the unique possibility for the retrospective assessment.
Application of the highly sensitive 14C measurement technique combined with environmental modeling can be used as a powerful tool for the NPP anthropogenic impact assessment.
SAMPLING AND METHODS
Sample Collection
In order to evaluate the impact of Ignalina NPP (Lithuania) operation on the environment, 11 tree cores were collected in total. RBMK1500 reactor unit was designed with a 150 m high ventilation stack. Both INPP reactors used their own stack for efficient ventilation. The plume released at this height does not reach the ground and cannot be detected closer than a specific distance depending on atmospheric dispersion characteristics. Therefore, for optimal detection of the INPP releases, tree core samples were collected farther than about 1.5 km from the INPP stacks. The distance, where the maximal ground activity in the air is reached, was assessed by a Gaussian plume model assuming atmospheric stability class C.
Due to the limitation to the proximity of the NPP and possible sampling locations (availability of and accessibility to the pine trees), we were constrained to collect samples from strict distance band and positions around the NPP stacks.
Eight core samples were collected: 5 at the best available sampling sites around INPP (see Table 1), the other 3 samples from background site-village Vaikšteniai, located (54º46’92”N, 24º77’81”E) 165 km away from Ignalina NPP. The locations were recorded by GPS coordinates and are shown in Figure 1.
Table 1 Sampling point locations.

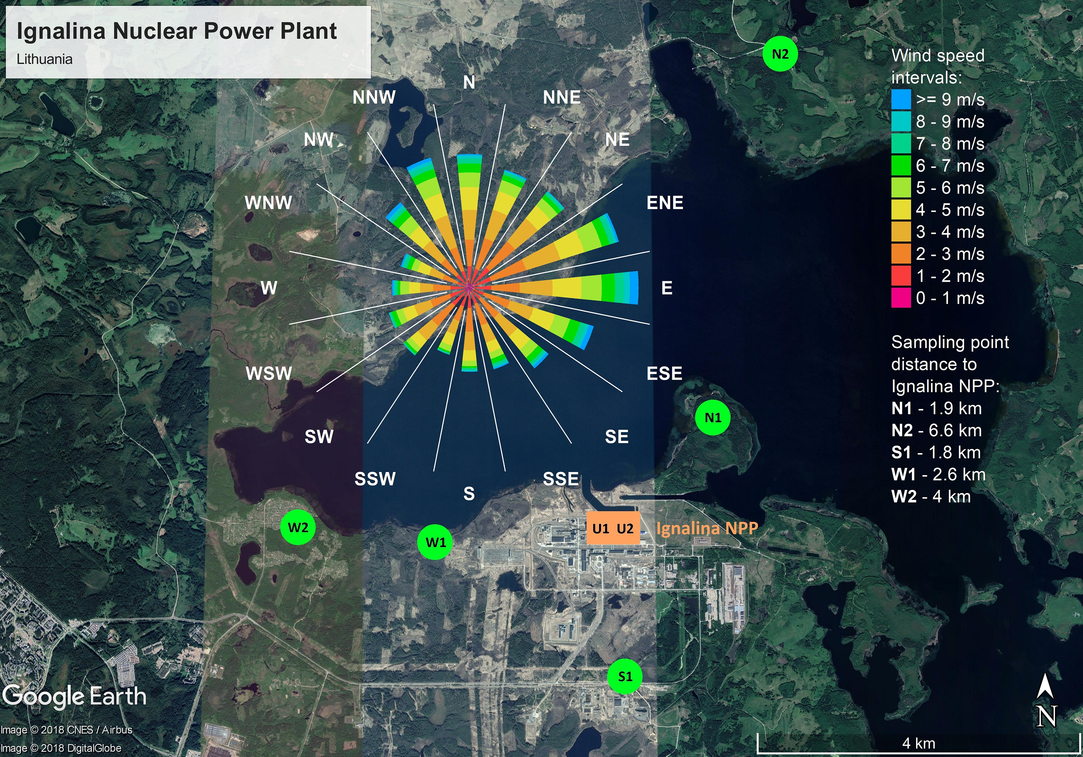
Figure 1 Location of the sampling sites around Ignalina NPP and dominant wind rose during warm and light (vegetation) period in 2004–2017 (wind direction off INPP).
The majority of tree core samples (total 4) were taken at one site 1.9 km northeast of the INPP. This site was crucial to our study due to its geographic location and dominant downwind direction (geographical coordinates 55º61’86”N and 26º58’22”E). In our previous study, we observed a significant increase in atmospheric 14C concentration in the peninsula of Drūkšiai lake during the period of Ignalina nuclear plant operation, from 1983 to 2009 (Ežerinskis et al. Reference Ežerinskis, Šapolaitė, Pabedinskas, Juodis, Garbaras, Maceika, Druteikienė, Lukauskas and Remeikis2018). To evaluate distance effect in north-northeast direction, one more sample was collected at the site 6.6 km away from NPP (55º39’36”N, 26º35’50”E). The Other 3 locations were selected to cover different directions with different distances from NPP. Samples from west side from NPP where collected at 2.2 km (55º36’1”N, 26º31’38”E) and 4 km (55º36’16”N, 26º29’58”E) distances and one from south side 1.8 km (55º35’18”N, 26º33’50”E) away. A Background location at the village of Vaikšteniai was selected to avoid possible local anthropogenic atmospheric pollution from INPP, Vilnius city and other towns.
Each tree for sampling was selected using these requirements: species (Pinus Sylvestris), age >40 yr, no visible diseases, no physical damage to strain and branches, similar soil and humidity conditions to background area.
Sample Preparation and 14C Analysis
More than 400 wood and reference samples were prepared from the 11 tree cores collected in order to evaluate the impact of INPP operation on the environment. Our previous investigation (Ežerinskis et al. Reference Ežerinskis, Šapolaitė, Pabedinskas, Juodis, Garbaras, Maceika, Druteikienė, Lukauskas and Remeikis2018) was extended by adding samples from 4 new locations and increasing sampling area to 5 spots. Trees, corresponding to above mentioned requirements, were selected and marked for further sampling. Pinus Sylvestris tree cores were extracted with 5 mm-diameter Swedish tree-core borer (Haglof®). From each tree, we extracted a minimum of 2 cores from different angles around tree trunk to reduce tree-ring counting errors and to get some insight into sample variety from the same tree. Furthermore, the most representative core sample used for further annual tree-ring preparation was selected from each tree. Moist and soft tree rings were separated and dried. Earlywood and Latewood from single tree ring were not separated.
The cellulose fraction was extracted performing BABAB (base-acid-base-acid-bleach) method (Němec et al. Reference Němec, Wacker, Hajdas and Gäggeler2010). The end result of chemical pre-treatment is pure holocellulose.
Graphitization procedure was performed with AGE3 equipment (Ežerinskis et al. Reference Ežerinskis, Šapolaitė, Pabedinskas, Juodis, Garbaras, Maceika, Druteikienė, Lukauskas and Remeikis2018, Wacker et al. Reference Wacker, Němec and Bourquin2010). Prepared graphitized samples were used to produce SSAMS targets for radiocarbon analysis. Typical SSAMS system parameters can be found in the paper Ežerinskis et al. (Reference Ežerinskis, Šapolaitė, Pabedinskas, Juodis, Garbaras, Maceika, Druteikienė, Lukauskas and Remeikis2018).
The measurements are reported in units of pMC obtained by the abc program (version 7.0) from NEC. This ratio is constant over time accordant to this definition (Stuiver and Polach Reference Stuiver and Polach1977; Donahue et al. Reference Donahue, Linick and Jull1990):
 $$pMC = {{{A_{SN}}} \over {{A_{ON}}}} \,\cdot\, 100{\rm{\% }}$$
where ASN is the specific activity of the sample, As, normalized to δ13 C = −25%; AON is the normalized activity of the standard.
Meteorological Observation Data
Dispersion of the atmospheric 14C releases from NPP and availability for the assimilation by local plants is determined by meteorological conditions. Fortunately, local meteorological data was available from records of meteorological station at Ignalina NPP site for the period of 2004–2017. Meteorological readings were systematically taken at ground level and at the top of 40 m height meteorological tower. The data was recorded every 3 hr and it included: wind direction, average and maximum wind speeds, temperature, humidity, atmospheric pressure and the amount of precipitation. In our study data records were used to establish local wind roses and to determine vegetation periods for every year during 2004–2017. Correlations between wind blowing frequency towards sampling site and 14C contamination in tree rings are examined further.
Local Scale 14C Atmospheric Transport Modeling
During routine operation of INPP atmospheric discharges were released via the main ventilation stacks at the height of 150 m and are composed dominantly by radioisotopes of noble gases 85 m,87Kr, 41Ar, 133,135Xe, but also contain significant amounts of 3H, 131I, and 14C. INPP operated two RBMK-1500 reactors: Unit 1, 1983–2004; Unit 2, 1987–2009. Since the very end of 2009 all INPP units have been in final shutdown condition and dismantling and decontamination activities of some less-contaminated equipment (turbine hall building equipment, emergency core cooling equipment, etc.) have been initiated.
The single circulation circuit design of RBMK leads to a continuous release from the coolant and discharge of 14C through the stack mainly in the form of CO2. A part of 14C from the coolant is purified by ion-exchange resins or released as liquid discharges. Radiocarbon releases may also occur occasionally during reactor maintenance (e.g. due to changing of fuel channels [Ežerinskis et al. Reference Ežerinskis, Šapolaitė, Pabedinskas, Juodis, Garbaras, Maceika, Druteikienė, Lukauskas and Remeikis2018]) or dismantling works.
The classical Gaussian transport model is suitable for the short-range dispersion modeling of the atmospheric discharges from the elevated source at steady state meteorological conditions. In case of varying weather during prolonged discharges, the model can still be applied if taking a superposition of sets of steady state events with averaged atmospheric conditions. The following Gaussian model equation determines the time-integrated atmospheric concentration of gas at any point in space, on the grid of x-axis, directed to the downwind from the release point, and y-axis in crosswind direction (according to Gifford Reference Gifford1960):
 $$C\left( {x,y,z,H} \right) = {Q \over {2\pi {\sigma _y}\left( x \right){\sigma _z}\left( x \right)u}}exp\left[ { - {1 \over 2}{{\left( {{y \over {{\sigma _y}\left( x \right)}}} \right)}^2}} \right]\left\{ {exp\left[ { - {1 \over 2}{{\left( {{{z - H} \over {{\sigma _z}\left( x \right)}}} \right)}^2}} \right] + exp\left[ { - {1 \over 2}{{\left( {{{z + H} \over {{\sigma _z}\left( x \right)}}} \right)}^2}} \right]} \right\}$$
where: C is time-integrated atmospheric concentration (Bq s)/(m3); Q is source term (Bq); H is effective release height H = 150 (m); x is downwind distance (m); y is crosswind distance (m); z is vertical axis distance (m); σy is standard deviation of the integrated concentration distribution in the crosswind direction (m); σz is standard deviation of the integrated concentration distribution in the vertical direction (m); u is average wind speed at the effective release height (m/s).
Depletion and radioactive decay of 14C is neglected because the near field around the source is considered (< 6.6 km). Briggs equations (Briggs Reference Briggs1973) are commonly used to determine σx and σy for A to F Pasquill atmosphere stability classes. Basing on (2) formula course of distance dependent near ground integrated air activity was calculated on plume centreline for some hypothetical amount of gas, released from the stack of Ignalina NPP at H = 150 m, and it is presented in Figure 2 for different atmosphere stability classes. Calculations were performed by using HotSpot Version 3.0 software.
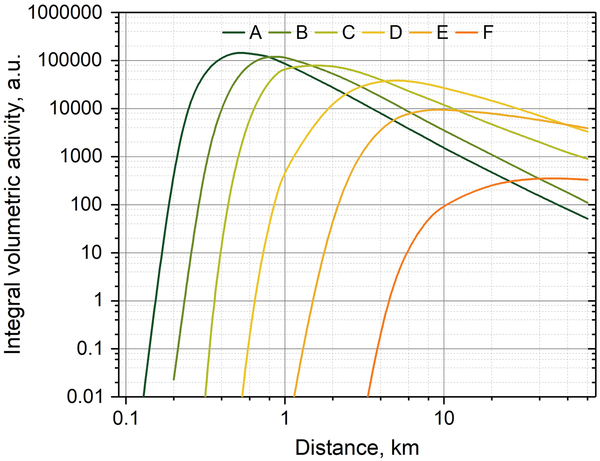
Figure 2 Distance dependent near ground integrated air activity assessed by Gaussian model for hypothetical gas amount releases from Ignalina NPP stack H = 150 m for the cases of A to F atmosphere stability classes.
The actual amount and manner of 14C releases from INPP (the source term in Bq) is not known for the whole studied period, because systematic measurements of radiocarbon discharges were implemented at INPP only from 2008. When operated, the maximal permissible level of 14C release to atmosphere from INPP was set as 2.3·1014 Bq/yr by the normative document (LAND 42 2007). Declared annual 14C atmospheric discharges were about 1.3·1011 Bq/yr (U1DP0 EIAR 2007) in the period of INPP two reactors operation before 2004. Since 2008 systematic measurements of the 14C releases are available and the levels of 14C annual discharges to the atmosphere are presented in the Table 2 (European Commission 2016).
Table 2 Ignalina NPP declared annual discharges of 14C to atmosphere (European Commission 2016).

Annual discharges ranging from 2.18·1010 to 3.09·1010 Bq/yr in the years of 2008–2009 when only the second reactor unit was in operation, and from 1.15·109 to 4.39·109 Bq/yr after INPP last reactor final shutdown at the end of 2009. Unfortunately, the time series of the 14C release during the year was not provided.
Once released from the stack, 14C undergoes the process of transportation and dispersion in the atmosphere and then it is assimilated by the pine trees. The input data for the dispersion assessment was taken from the meteorological records database. Every 3 hr duration data record (i), corresponding to the warm period (Tair ~+5°C ÷ +35ºC) and light time of the day (6 hr until 21 hr), was considered. Total number of suitable data records in 2004-2017 was N = 15081. Space around NPP was divided into 16 directional sectors, having 22.5º angular width. All annual individual meteorological data records i of the certain year n light and warm period were grouped, corresponding to wind blowing to the certain sector j- ui→sector_j. The annual (n) integrated activity at any distance x from INPP in the sector j at the near ground level z = 1.5 m on the plume centreline y = 0 m can be assessed by the following formula:
 $${C_{secto{r_j},n}}\left( x \right) = {1 \over {2\pi {\sigma _y}\left( x \right){\sigma _z}\left( x \right)}}\mathop \sum \nolimits_{i = 1}^N {{{Q_{i,n}}} \over {{u_{i \to secto{r_j},n}}}}\left\{ {exp\left[ { - {1 \over 2}{{\left( {{{z - H} \over {{\sigma _z}\left( x \right)}}} \right)}^2}} \right] + exp\left[ { - {1 \over 2}{{\left( {{{z + H} \over {{\sigma _z}\left( x \right)}}} \right)}^2}} \right]} \right\}$$
Prevailing atmosphere stability class was identified based on the 14C tree-ring measurements taken in the same direction but at different distances from the source (N1, N2 and W1, W2 points). According to the Gaussian model, pattern of the activity change with the distance being unique for every class, therefore actual activity ratios N1/N2 and W1/W2 would correspond to the certain atmosphere stability class. Comparison of the calculated theoretical and measured activity ratios is presented in Table 3.
Table 3 14C activity ratios for average atmosphere stability class identification from the tree-ring measurements and Gaussian model calculations.

The results obtained for the N1/N2 and W1/W2 14C activity measurements gave median values of 3.79 and 0.92, correspondingly, which refer to an averaged dilution typical between C and D stability classes. Our choice was to admit prevailing stability class C and to use corresponding σx and σy values in the further assessment with the Gaussian model.
Actual course of the releases from the INPP stack Qi,n (every 3 hr during the year n) is not known, so, the only relative directional and distant dependent integral air activities  $\widehat{{C_{secto{r_j},n}}\left( x \right)} ={{{C_{secto{r_j},n}}\left( x \right)} \over {\mathop \sum \nolimits^ {Q_{i,n}}}}$, which is proportional to the dilution factor) in INPP vicinity can be obtained by Gaussian modeling for every year at every sampling site. Such relative annual measure allowed to eliminate influence of Q term, but preserved distance and direction specifics.
Further correlations between excessive 14C measured in tree rings and normalized annual integrated air activity, assessed by using Gaussian model basing on meteorological data for 2004–2017 period of time, was studied for the sampling locations.
RESULTS AND DISCUSSION
The radiocarbon analyses provided critical data about radiocarbon releases and atmospheric transport from Ignalina NPP and gave the opportunity to estimate its environmental impact and to couple with the Gaussian model.
The results showed a pronounced increase of 14C up to about 15 pMC (1999 y) in the tree rings during INPP operation period (Unit 1, 1983–2004; Unit 2, 1987–2009) as well as during decommissioning periods (see in Figure 3). We observe that from the beginning of INPP operation (1984–1994), the excess of 14C was minor. An average excess of 3 pMC in this period was observed reaching a maximum value of 6 pMC. Year 1995 is a clear breaking point in INPP curve. From this point, the excess of 14C almost doubles and lasts up to the shutdown of the second INPP reactor in 2009.

Figure 3 Trend of 14C activity measurements in the tree rings from the background location in Vaikšteniai and sampling points around Ignalina NPP.
As expected, the effect of contamination reduction with distance was observed in average by 6 pMC by increasing distance from 2 to 6.6 km from the INPP. Directional and annual variations were also apparent.
Correlations between measured excess 14C in tree rings and corresponding assessed annual radiocarbon relative integral air concentration at the sampling location were studied. The derived correlation coefficients for 2004–2015 are presented in the Table 4. Selected typical scatterplots for the several years of INPP exploitation (2004, 2007) and decommissioning (2009, 2012) periods are shown in the Figure 4.
Table 4 Correlations between measured 14C excess activity in tree rings and assessed by Gaussian model annual air integral activities  $\widehat{{C_{secto{r_j},n}}\left( x \right)}$.


Figure 4 Typical scatterplots between measured 14C excess activity in tree rings and assessed by Gaussian model annual air integral activities Csectorj,nx for the sampling locations around Ignalina NPP.
A good correlation between measured and calculated 14C activity was observed. The correlation coefficient R varied from 0.56 (2013) up to 0.98 (2005). This affirms, that the radiocarbon discharges from the Ignalina NPP atmosphere were done in a quite constant manner and can be well predicted by Gaussian model considering local wind rose. It also confirms, that 14C measurements of the pine tree rings can be used as a tool of the retrospective monitoring of the radiocarbon discharges from the nuclear power plants.
Assessment of the Effective Dose to the Public
According to the data provided by the INPP and our measurement results, we can confirm that the INPP discharges 14C into environment during its normal operations and also after the final shutdown of the both units due to the dismantling operations and management of radioactive waste. Thus, the additional effective dose to the local public can be estimated. We followed the effective dose due to 14C assessment method using models that employ a specific activity approach which is proposed in IAEA publication Annex III (IAEA 2001). The models assume, that the 14C released is associated with CO2 molecules and is subsequently fixed within plant tissues during photosynthesis and are transported along with stable 12C through food chains into the human body. Ingestion of carbon originating from the atmosphere is the primary mode of exposure (all other pathways of exposure will contribute less than 1% of the total dose). This method provides a conservative dose estimate, because an individual is assumed to be in complete equilibrium with maximum levels of environmental specific activity of 14C and the ratio between the radionuclide and its stable counterpart is fixed. According to the method, the dose rate at equilibrium will be directly proportional to the concentration of 14C in air relative to the concentration of stable carbon at a given location x, multiplied by the fraction of total dietary carbon derived from this location (IAEA 2001):
 $${D^{max}} = (A)_x^{max} \cdot {({F_{c,a}})_x} \cdot g$$
where: Dmax is the effective dose rate (Sv/a); (A)xmax is the maximum specific activity (Bq 14C/g C) to which food products at location x will be chronically exposed; (Fc,a)x is the fraction of total dietary carbon derived from location x by the representative member of the critical group (conservatively assumed to be unity); g is the effective dose rate factor that relates the annual dose rate (Sv/a) to the concentration of 14C per gram of carbon in people (Bq/g) (recommended value for screening is 5.6·10–5 Sv/a per Bq/g C (IAEA 2001).
Values of specific activity (A)xmax in Bq 14C per gram of C can be derived from the tree-ring 14C measurements in pMC by using the relationship of 1 pMC as equivalent to 0.00226 Bq/g C (Stuiver and Polach, Reference Stuiver and Polach1977). This would provide an effective dose estimate of about 0.12 µSv/yr per 1 pMC. This value is similar to conservative estimate of 0.18 µSv/yr per 14C excess by 1 pMC (Mažeika et al. Reference Mažeika, Petrošius and Pukienė2008), obtained by combining 14C release rate from INPP assessment by Gaussian plume model backward calculations with the nuclide-specific atmospheric routine release dose conversion factor, representing the ratio of the annual effective dose for a farmer critical group member (Sv/yr) at the location x of the highest predicted radionuclide concentration in air, to the activity released from the INPP 150 m height stack (Bq/yr) (Motiejūnas et al. Reference Motiejūnas, Nedveckaitė, Filistovič, Mažeika, Morkeliūnas and Maceika1999; LAND 42 2007).
The effective dose rate caused by INPP discharges of 14C were estimated to be for 1984-1993: 0.4 µSv/yr; 1994-2009: 0.8 µSv/yr; 2009-2015: 0.6 µSv/yr. An average effective dose rate for the time period of 1984-2015 is equal to 0.6 µSv/yr. The maximum value of 1.8 µSv/yr was reached in 1999. These effects were caused by INPP repair works, mostly by replacing nuclear reactor core channel tubes. The core modernization started in 1998, then 3 reactor channel tubes were replaced. In 1999, 100 channel tubes; in 2000, 7; in 2001, 50; in 2002, 75; and in 2003, 10 (Ežerinskis et al. Reference Ežerinskis, Šapolaitė, Pabedinskas, Juodis, Garbaras, Maceika, Druteikienė, Lukauskas and Remeikis2018). Later on, INPP dismantling activities contributed significantly to 14C releases. Therefore, in time span 1995–2009, we have observed elevated 14C activities in tree rings with a maximum of 15 pMC and an average value of 7 pMC.
Monitoring results acquired by Xu et al. (Reference Xu, Cook, Cresswell, Dunbar, Freeman, Hastie, Hou, Jacobsson, Naysmith, Sanderson, Tripney and Yamaguchi2016) showed a maximum of 15.8 pMC increases in radiocarbon activity near the Fukushima boiling water reactors in tree rings from 2000, with estimated additional effective dose of 2.0 µSv/yr.
Concerning 14C releases from other type reactors (PWR), Roussel-Debet et al. (Reference Roussel-Debet, Gontier, Siclet and Fournier2006) reported results from 14 sampling sites around French NPPs. Results from those measurements shows that discharges made a very slight effect on 14C activity, Δ14C varying from 101‰ (110.1 pMC) in the non-influenced zone to 123‰ (112.3 pMC) in the influenced zone. This increase in dose is negligible and contributes less than 0.1 µSv/yr.
Janovics et al. (Reference Janovics, Kern, Güttler, Wacker, Barnabás and Molnár2017) performed research to determine the effects of Paks NPP (PWR type reactor of VVER design) operation to environment before and after a third-level incident (INES-3). Tree samples measurements did not show a noticeable increase in 14C background. This could be due to the short-term manner of accidental release and dominant routine releases of 14C from PWR in organic form which is not assimilated by plants. Besides, sampling sites were located to close (250 m and 400 m) to Paks NPP for elevated plume (130 m) to reach ground with the highest concentration.
Furthermore, atmospheric radiocarbon has been monitored around Jaslovské Bohunice NPP (VVER) and relatively higher excess exposure dose of 3 μSv/yr to local public was evaluated (Povinec et al. Reference Povinec, Šivo, Šimon, Holý, Chudý, Richtáriková and Morávek2008). A higher value was obtained, presumably, as a result of extracting 14C depleted background level, which was considerably affected by use of fossil fuels. In any case, the resulting dose was negligibly small as to compare with the natural exposure background and demonstrated that radiocarbon releases from NPPs did not pose radiological hazard to the public.
CONCLUSIONS
This study reports the annual 14C variations in Lithuanian pine tree rings from 1957–2015. The Ignalina nuclear power plant (Ignalina NPP) operation time period was studied in more detail. Results demonstrate that the first 12 yr (1983–1995) during normal INPP operation the excess of 14C was negligible with an average value of 3 pMC. However, the excess of 14C during the time span (1995–2009) almost doubles to maximum of 15 pMC (the average value enhances to 7 pMC) and the absence of the correlation with the background in this period lets us assume that the additional 14C contamination source makes a significant contribution to the total 14C discharges from Ignalina NPP.
The estimated effective dose rate caused by the INPP operations for the time period 1984–2009 on average was 0.6 µSv/yr, which is negligible compared to the natural background dose of 2.5 mSv/yr.
Distance correlation analysis shows a significant decrease of 14C concentration in farther distances from NPP units highly corresponding to wind direction. Implementing wind speed and directional data from different heights provides the necessary information for 14C distribution and dissipation model around NPP. Gaussian 14C dispersion model reconstructs how radiocarbon was released from NPP in definite time span, recreating historical events of Ignalina NPP. The analysis of wind rose data and 14C concentrations around Ignalina NPP shows a high correlation, indicating greater flora sensitivity for 14C emissions and model eligibility.
The results of correlation analysis of wind direction and 14C concentration in the tree rings provide confirmation that 14C measurements in the tree rings can be used as a tool of indirect assessment of gaseous discharges from NPP during its operation as well as post-operational periods. The data of our study could be used for estimations of future 14C release from NPP as well as for the modeling of environmental impact of 14C on inhabitants, fauna, and flora.


