INTRODUCTION
Any interpretations of radiocarbon dates obtained on the remains of organisms from aquatic biotopes need to take into account that a restricted exchange in CO2 between water and the atmosphere maintains a depletion of 14C in water bodies compared to the atmosphere (Lanting and van der Plicht Reference Lanting and van der Plicht1998), a phenomenon known as the reservoir effect. This effect operates in both marine and freshwater environments. The marine reservoir effect (MRE) is roughly similar throughout the world’s surface oceans, amounting to about 400 years (Stuiver and Braziunas Reference Stuiver and Braziunas1993), while the local variations that are known to exist are mostly moderate (see http://calib.org/marine/). The freshwater reservoir effect (FRE) is more complicated. In freshwater bodies, the depletion of 14C is the result of groundwater input into an aquatic biotope. This groundwater can have a significant residence time and can have undergone an input of 14C-depleted sources (Drucker et al. Reference Drucker, Valentin, Thevenet, Mordant, Cottiaux, Delsate and Van Neer2016), such as fossil inorganic carbonates (Geyh et al. Reference Geyh, Schotterer and Grosjean1998) or fossil organic carbon (Boaretto et al. Reference Boaretto, Thorling, Sveinbjörnsdóttir, Yechieli and Heinemeier1998). Additionally, some rivers are characterized by a high FRE through the input of ancient glacial meltwater (Hall and Henderson Reference Hall and Henderson2001). This input of carbon from many different organic and inorganic sources, which is then dissolved into the water, is highly variable, making it nearly impossible in hydrogeological studies to radiocarbon date the age of the groundwater, in the sense of establishing the amount of time that has elapsed between the precipitation of water in a recharge area and its arrival in a discharge area (Fontes Reference Mook1992; Mook Reference Fontes1992; International Atomic Energy Agency 2013).
Data on the FRE are lacking for many river systems and lakes, and where data are available, they show that values can differ markedly between water bodies (see Fernandes et al. Reference Fernandes, Rinne, Nadeau and Grootes2016, for Germany) or even within the same freshwater aquatic system; that the FRE differs between species in an aquatic system (Svyatko et al. Reference Svyatko, Reimer and Schulting2017), possibly as a function of the organism’s position in the foodweb (see Fernandes et al. Reference Fernandes, Dreves, Nadeau and Grootes2013; Philippsen Reference Philippsen2013); and, finally, that due to changes in climate, hydrogeography, etc., at a given location, the FRE can—and will—fluctuate through time (e.g. Zhou et al. Reference Zhou, He, Wu, Zhang, Zhang, Liu and Yu2015). It has been stated that the FRE generally does not exceed several hundred years (Keaveney and Reimer Reference Keaveney and Reimer2012), but exceptions are known, e.g. from Iceland (Ascough et al. Reference Ascough, Cook, Church, Dugmore, McGovern, Dunbar, Einarsson, Friðriksson and Gestsdóttir2007; see also further).
Reservoir effects have a dramatic impact on the interpretation of radiocarbon dates obtained on aquatic organisms, including when these dates are used to date cultural deposits (e.g., Culleton Reference Culleton2006; Motuzaite-Matuzeviciute et al. Reference Motuzaite-Matuzeviciute, Lillie and Telizhenko2015). Reservoir effects also have a marked impact on radiocarbon dates obtained on the archaeological remains of humans (or other organisms) having consumed aquatic organisms as part of their diet. In the case of human remains, interpretations are further complicated because any interpretation of the radiocarbon dates has to take into account the relative contributions of marine and freshwater organisms to the diet, as each are characterized by their own reservoir ages.
In the case of the Schelde basin (Belgium, northwestern Europe), this archaeological problem still prevails, especially because the FRE remained unstudied for the river system. The archaeological record of this part of the world is rich and varied, and is characterized by a long prehistoric occupation, four centuries of Roman domination, and early (and dense) urbanization in Medieval and early Post-medieval times. Archaeozoological and historical data indicate that the consumption of freshwater and marine fish was important and that it fluctuated significantly through time and among groups within society (Van Neer and Ervynck Reference Van Neer and Ervynck2004; Reference Van Neer and Ervynck2016), making the absolute dating of human remains especially challenging.
This study aims to assess the FRE within the river Schelde and its affluents, and to document the inter- and intra-species variability for a number of fish taxa, by evaluating the radiocarbon dates obtained on archaeological freshwater fish remains. The study involves (1) radiocarbon analysis of freshwater fish and terrestrial mammal bones from a single archaeological context of which the historical date is known, (2) radiocarbon analysis of freshwater fish and terrestrial mammal bones from a context lacking a historical date but having a cultural-archaeological date, again allowing for the comparison of radiocarbon dates between terrestrial and freshwater organisms from a single deposit, (3) radiocarbon analysis of freshwater fish bones from two contexts having cultural-archaeological dates but lacking radiocarbon data from terrestrial organisms (due to options taken during the analysis of the former excavations), and (4) N and C stable isotope analysis for most of the samples that have been radiocarbon dated, to interpret the ecology and diet of the specimens sampled. This stable isotope dataset is enlarged with the results of a previous study on archaeological fish remains from the Schelde basin (Fuller et al. Reference Fuller, Müldner, Van Neer, Ervynck and Richards2012).
In what follows, first the study area will be introduced, after which the analysis of the archaeological animal remains, the radiocarbon and stable isotope results, and possible interpretations will be presented.
THE SCHELDE RIVER BASIN
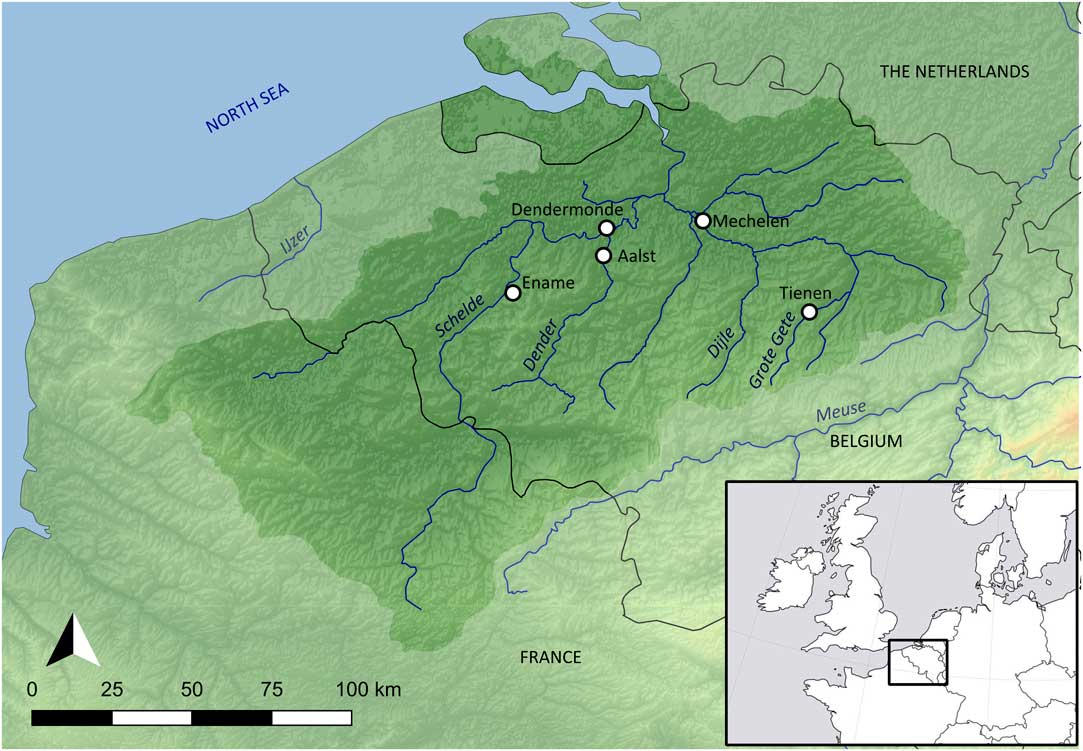
The general hydrogeography of the Schelde basin (Figure 1) has been described in different publications (e.g., Bayens et al. Reference Bayens, van Eck, Lambert, Wollast and Goeyens1998; Breine et al. Reference Breine, Maes, Quataert, Van den Bergh, Simoens, Van Thuyne and Belpaire2007; Reference Breine, Quataert, Stevens, Ollevier, Volckaert, Van den Bergh and Maes2010; Deforce Reference Deforce2014; Meire et al. Reference Meire, Ysebaert, Van Damme, Van den Bergh, Maris and Struyf2005; Reference Meire, Amery and Decleer2015; Van Strydonck and De Mulder Reference Van Strydonck and De Mulder2000). The basin covers an area of about 22,000 km² and drains water from most of Flanders (northern Belgium). While the source of the river Schelde is located in northern France (near Saint-Quentin), most of its basin is located in Flanders. The Schelde basin is a typical slow-moving lowland river system, with the source of the main river (Schelde) located about 100 meters above sea level. This main river has a length of 355 km. The basin sheds its waters into the North Sea and is subject to tidal influence, which nowadays is still observable upstream as far as Gent, where the incoming salt water is blocked by a sluice. Before the construction of sluices, tidal influence extended farther upstream. At any point within the part of the basin under tidal influence, salinity fluctuates seasonally (due to differences in precipitation), but in general, it can be stated that the sites from the study area (see below) are located in the oligohaline (salinity range 0.5–5‰) and freshwater (salinity <0.5‰) zones of the river.

Figure 1 The Schelde basin (Belgium), with the location of the sites mentioned in the text: Aalst, Dendermonde, Ename, Mechelen, Tienen.
The direct runoff of surface (i.e. rain) water does not sufficiently explain the volume of discharge of the river system. It is therefore thought that the Schelde and its affluents realize their flow rate mainly through the input of groundwater derived from precipitation. Because it can take a considerable amount of time for groundwater to travel from the recharge areas within the basin to the discharge areas, the presence of so-called old water can be expected in the river. In addition, the groundwater discharging into the Schelde basin will have taken up organic and inorganic carbon from different sources (each with their own radiocarbon date), further increasing the likelihood of a reservoir effect in the river system. Unfortunately, precise data about this “contamination” with old carbon are not available.
In ecological terms, the freshwater fish fauna investigated here mainly belongs to the zone defined by Huet (Reference Huet1954) as the “bream zone”. This zone harbors the fish fauna from slow-moving or still waters (stream velocity 0–10 cm/s), in a broad river bed with a sandy or silty bottom, and water temperatures sometimes exceeding 20°C. Typical species for this zone are bream (Abramis brama), roach (Rutilus rutilus), carp (Cyprinus carpio f. domestica), rudd (Scardinius erythrophthalmus), tench (Tinca tinca), pike (Esox lucius), perch (Perca fluviatilis) and eel (Anguilla anguilla).
Over the past two millennia, the Schelde river and its basin have experienced significant alterations on Flemish territory, mainly linked to changes in the geography of the Schelde estuary (i.e., the shortening of the distance to the sea) and the construction of dikes (affecting the breadth of the river valley, the depth of the river, its stream velocity and the impact of the tides). The Schelde of Roman times was thus a different river system than that of Medieval and Post-medieval times (Van Strydonck and De Mulder Reference Van Strydonck and De Mulder2000).
MATERIAL AND METHODS
Sites
For this study, radiocarbon dates and stable isotope measurements were obtained from four archaeological sites in the Schelde basin (Figure 1), ranging from the Roman period (1st to 4th century AD) to the early Post-medieval period (16th century AD). A number of stable isotope data previously obtained from the study area (Fuller et al. Reference Fuller, Müldner, Van Neer, Ervynck and Richards2012) has been included in the analysis and interpretations. Because only those species that also appear in the current study have been taken into account, use of the Fuller et al. (Reference Fuller, Müldner, Van Neer, Ervynck and Richards2012) data has resulted in the inclusion of only a limited number of additional sites (see below).
Both freshwater fish and domestic mammal bone samples have been analyzed from a cesspit excavated at the Hopmarkt site in the town of Aalst. This deposit has been linked to historical information about the activities of a crossbow maker between 1489 and 1498 AD on the basis of specific archaeological finds (De Groote et al. in press). Aalst is located on the river Dender, an affluent of the Schelde.
Both freshwater fish and domestic mammal bone samples have been analyzed from a ritual deposit from the Roman site known as Grijpenveld, now in the town of Tienen, interpreted as an event representing a single moment in time, associated with the cult within a temple of Mithras (Martens Reference Martens2004; Lentacker et al. Reference Lentacker, Ervynck and Van Neer2004). The context has been dated archaeologically to the third quarter of the 3rd century AD on the basis of the characteristics of the ceramic finds (Martens Reference Martens2004). Tienen is located on the Grote Gete, a small river in the eastern part of the Schelde basin.
A small number of fish remains were analyzed from a cesspit in the late Medieval prison tower in the town of Mechelen (the Steen), of which the fill has been dated archaeologically to the early 14th century based on the ceramic finds (Troubleyn et al. Reference Troubleyn, Kinnaer, Ervynck, Beeckmans, Caluwé, Cooremans, De Buyser, Deforce, Desender, Lentacker, Moens, Van Bulck, Van Dijck, Van Neer and Wouters2009). Mechelen is situated on the river Dijle, which is in the eastern part of the Schelde basin.
The majority of the fish remains in this study derive from a cesspit excavated in a house (De Cop) near the market square of the town of Dendermonde, of which the fill has been dated archaeologically to the first half of the 16th century based on cultural artefacts (Beeckman and Van Hecke Reference Beeckman and Van Hecke2017). Dendermonde is located at the confluence of the rivers Dender and Schelde, ca. 14 km downstream from Aalst.
The stable isotope data included from Fuller et al. (Reference Fuller, Müldner, Van Neer, Ervynck and Richards2012) derive from two contexts that are further explored here (Dendermonde–De Cop, Mechelen–Steen), from two additional sites within one of the towns already included in this study (Mechelen–Lamot: 9th–12th century, Mechelen–Veemarkt: 14th–15th century), and from a location that is not covered by the new data from this study, namely, the abbey of Ename, near Oudenaarde (comprising a context dated archaeologically to around 1500 AD and a context dated archaeologically to the 17th century) (Figure 1). References to these additional contexts can be found in Fuller et al. (Reference Fuller, Müldner, Van Neer, Ervynck and Richards2012).
Species
The domestic mammals (pig, cattle, sheep) on which radiocarbon dates were obtained need no introduction. It is not expected that the diet of these animals, in the periods and regions considered in this study, was influenced by a significant input of either marine or freshwater organisms. Even for the omnivorous pig, stable isotope studies from Flanders show no significant consumption of aquatic organisms in historical times (Ervynck et al. Reference Ervynck, Lentacker, Müldner, Richards and Dobney2007). In contrast, the ecology and life cycle of the freshwater fish species studied are key to the interpretation of the results obtained. The ten fish taxa that have been included in this study are representative of the freshwater species typically encountered in archaeological sites along the oligohaline and freshwater zones of the Schelde basin (Van Neer and Ervynck Reference Van Neer and Ervynck1994). For each of these species, when possible, bones representing different length classes were selected, as it is known that feeding habits change as fish grow larger and that this markedly influences their stable isotope ratios (e.g., Häberle et al. Reference Häberle, Fuller, Nehlich, Van Neer, Schibler and Hüster Plogmann2016a; Reference Häberle, Nehlich, Fuller, Schibler, Van Neer and Hüster Plogmann2016b).
In terms of number of finds and species richness, the carp family (Cyprinidae) is the major freshwater fish group in the study area. It should be noted that species identifications of isolated skeletal elements are not always easy to achieve, in particular when these elements are from smaller individuals. At the site of Tienen–Grijpenveld, the few available cyprinid bones (rare finds for the Roman period) were not species diagnostic, but they cannot be carp, as the species had not yet been introduced in Roman times. For the other sites, only bones of cyprinids that were identified to species have been included in the present study. Most of the cyprinid material is from bream (Abramis brama; n=7) and roach (Rutilus rutilus; n=7), while less material was available from carp (Cyprinus carpio f. domestica; n=3), ide (Leuciscus idus; n=2) and silver bream (Blicca bjoerkna; n=1). Most of the bones correspond to fish that were larger than 20 cm SL (standard length, i.e. the length of the fish measured from the tip of the snout to the base of the tail). In the case of roach, it was possible to obtain a single sample of smaller fish (between 8 and 15 cm SL) with sufficient mass to enable analysis, but for the remaining cyprinid species, a sufficient bone mass for length classes below 20 cm SL could not be accumulated.
The second group of fish consists of three carnivorous species, namely, pike (Esox lucius; n=21), perch (Perca fluviatilis; n=5), which inhabit exclusively freshwater environments, and eel (Anguilla anguilla; n=5), which is catadromous. In the case of pike, the length classes varied between 20–30 cm SL and >50 cm SL, and for the length classes above 30 cm, most samples consisted of a single bone. Similarly, for perch, no samples were available for fish below 20 cm SL. Each of the six samples of eel was made up of numerous bones, mainly vertebrae, that each have a relatively small bone mass. Because estimation of fish length on the basis of isolated eel vertebrae is not always very precise (Thieren et al. Reference Thieren, Wouters, Van Neer and Ervynck2012), there is a wide range of fish lengths indicated for each of these samples. However, in general, it can be said that the eel remains represent medium-sized individuals.
The third group of fish consists exclusively of flounder (Platichtys flesus; n=11), of which both small individuals, measuring 10–20 cm SL, and larger individuals, measuring 20–30 cm SL and 30–40 cm SL, were available for sampling. All the flounder specimens come from the site of Dendermonde–De Cop, and they appear to represent young fish that may have been captured in local freshwaters, as well as larger, imported fish that typically would have lived in the Schelde estuary and in coastal waters.
Considering the interpretations intended to make use of these data, it should be stressed that in the case of the smallest fish, a number of data points does not represent single individuals, but, rather, a mixture of specimens, albeit still from the same size class (except for eel, see above) and from the same individual archaeological context. It has been assumed that, within the specific archaeological contexts sampled, specimens from these smaller, economically less important size classes derive from the same environment. In the case of the larger specimens, attention has been paid to avoiding the selection of bones from the same individual, either by taking single bone elements from different archaeological units, or by selecting the same skeletal element from within the same unit. In the case of flounder, for instance, the os anale (an unpaired element) and the cleithra (a paired element) were preferentially used for sampling, and the roach is only represented by the highly species-diagnostic pharyngeal plates. Because of this sampling strategy, we are rather confident that the selected bones are from different individuals. However, in the case of the larger pike from Dendermonde it was not possible to follow that procedure as bones of large individuals were rare and derive from only two different archaeological find units within the same cesspit.
Two further confounding factors have to be considered regarding this dataset. First, it is assumed that all of the fish sampled were caught locally, from the main rivers running near or through the sites. However, it must be taken into account that a trade in fish products may have occurred. In general, the historical sources are not very informative about such trade at the site level, making it impossible to exclude sites or assemblages from the analysis based on their involvement in the freshwater fish trade. However, it can be assumed that, because most freshwater fish was consumed fresh and was locally available everywhere, the trading distances cannot have been substantial (see Theurot Reference Theurot2004 for a case study from France), with the exception of eel, which can easily be transported alive and was also traded in a processed form (smoked), and carp, which can also easily be transported alive. Second, there is the possibility in Medieval and later periods of fish having derived from fish farming, and these farmed fish, living in a different environment, often enriched by the anthropogenic input of nutrients, can be expected to have different isotopic signatures than individuals of the same species living in the river system. Again, historical information does not provide enough detail on this economic activity at the site level. Late Medieval texts, for instance from France, mention the species that were most commonly harvested from fish ponds. The major species is carp, but in most cases pike is also mentioned as another highly valued species (Monvoisin Reference Monvoisin2004; Rouillard Reference Rouillard2004). A wide variety of other species, mainly cyprinids, are suspected to also sometimes have been reared in ponds to be marketed (Beck Reference Beck2004), although, with the exception of bream (Mattéoni Reference Mattéoni2004), they are usually not named. Sometimes large quantities of bream are mentioned in the accounts (Mattéoni Reference Mattéoni2004) and there are historical references to ponds stocked with both carp and bream (Berthier Reference Berthier2004).
Sample Pretreatment
Collagen extraction was performed following Longin’s (Reference Longin1971) method. Between 100 and 500 mg of fragmented bone was demineralized in 10 ml 8% HCl for 20 minutes at room temperature and subsequently rinsed with milliQ-water. After that, the sample was immersed for 15 minutes in 1% NaOH and again rinsed with milliQ-water. Subsequently, 1% HCl was added for neutralization, after which the sample was again washed with milliQ-water. For all the steps mentioned above, Ezee-filters were used. Gelatinization of the extract was done in a solution of pH = 3, at 90°C for 12 hours. The resulting gelatin was filtered with a Millipore 7 micrometer glass filter and subsequently freeze-dried. 14C, stable isotopes (δ 13C and δ 15N), %C, %N and the atomic C:N ratio were analyzed on the bone collagen.
Stable Isotope Ratios (δ13C and δ15N), %C, %N, and Atomic C:N Ratio Analyses
Carbon and nitrogen stable isotope compositions were measured as the ratios of the heavy isotope to the light isotope (13C/12C or 15N/14N) and are reported in delta (δ) notation as parts per thousand (‰), where δ13C or δ15N = ([Rsample/Rstandard] – 1) × 1000, and R is 13C/12C or 15N/14N, relative to internationally defined standards for carbon (Vienna Pee Dee Belemnite, VPDB) and nitrogen (Ambient Inhalable Reservoir, AIR).
Analyses were performed in duplicate on a Thermo Flash EA/HT elemental analyzer, coupled to a Thermo DeltaV Advantage Isotope Ratio Mass Spectrometer via ConfloIV interface (ThermoFisher Scientific, Bremen, Germany) at the Department of Earth and Environmental Sciences of the KU Leuven, Belgium. Standards used were IAEA-N1, IAEA-C6, and internally calibrated acetanilide. Analytical precision was 0.25‰ for both δ13C and δ15N based on multiple measurements of the standard acetanilide.
Carbon and nitrogen concentrations in bone gelatin in relation to the bulk weight were also determined; these will be referred to as weight percentage of carbon and nitrogen (%C and %N). These two quality indicators provide information on protein degradation. Ambrose (Reference Ambrose1990) cites a collagen weight %C and %N range for well-preserved collagen of 15.3–47% and 5.5–17.3%, respectively. The atomic C:N ratio of the bone collagen samples was used to classify the collagen samples as uncontaminated or contaminated (DeNiro Reference DeNiro1985; Ambrose Reference Ambrose1990). Samples providing results outside the 2.9–3.6 range were regarded as being contaminated.
Radiocarbon Analysis
All samples were transformed into graphite using the automatic graphitization device AGE (Němec et al. Reference Němec, Wacker and Gäggeler2010; Wacker et al. Reference Wacker, Němec and Bourquin2010; Boudin et al. in press), and 14C concentrations were measured with accelerated mass spectrometry (AMS) at the Royal Institute for Cultural Heritage (Brussels) (Boudin et al. Reference Boudin, Van Strydonck, Van den Brande, Synal and Wacker2015). 14C results are expressed in pMC (percentage modern carbon) and indicate the percentage of modern (1950) carbon corrected for fractionation using the δ13C AMS measurement.
Calibration, modeling and statistical analysis of the radiocarbon dates were executed with the Oxcal 3.10 program (Bronk Ramsey Reference Bronk Ramsey2005), using atmospheric data from Reimer et al. (Reference Reimer, Baillie, Bard, Bayliss, Beck, Blackwell, Bronk Ramsey, Buck, Burr, Edwards, Friedrich, Grootes, Guilderson, Hajdas, Heaton, Hogg, Hughen, Kaiser, Kromer, McCormac, Manning, Reimer, Richards, Southon, Talamo, Turney, van der Plicht and Weyhenmeyer2009). The same program and calibration curve were also used to transform archaeological and historical calendar dates into radiocarbon data (BP). The FRE offsets (in 14C years) were calculated as “14C freshwater fish – 14C terrestrial material”, with the latter measurement being the Oxcal combination (R_Combine function) (Ward and Wilson Reference Ward and Wilson1978) of all terrestrial mammal dates obtained for a given archaeological context or the Oxcal transformation of an archaeological or historical date. The uncertainty of a FRE offset was calculated using σFREO = √ (σa2 + σb2), where σa and σb are 14C age uncertainties for the fish samples and the combined or transformed terrestrial mammal samples.
RESULTS AND INTERPRETATION
Success Rate of the Analysis
All new lab results derived from this study are listed in Table 1. Some samples did not yield enough collagen to enable to conduct both stable isotope and 14C analyses. When there was less than 1mg collagen, only stable isotope analyses were performed.
Table 1 Stable isotope (δ13C and δ15N) and radiocarbon data for four archaeological sites from the Schelde basin (Belgium) (SL: standard length, see text, n.a.: not available, n.r.: not relevant, *: outlier, °: C:N ratio too high).
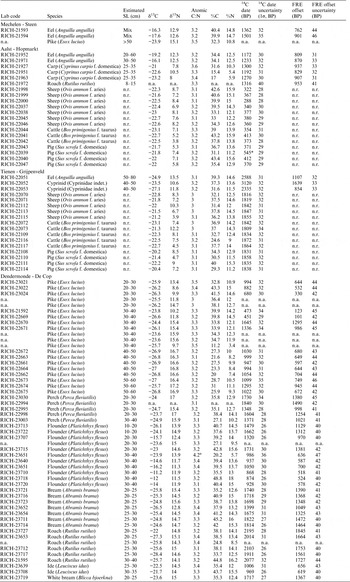
Of the 95 samples analyzed, 92 yielded results. The terrestrial mammal samples all had a good success rate. Of the 67 fish samples analyzed, 3 samples, from Dendermonde–De Cop, did not yield any collagen; these are not listed in Table 1 and are excluded from the interpretations. One additional sample (lab code RICH-23651) had an atomic C:N ratio (=5.7) that falls outside the range of 2.9–3.6 proposed by DeNiro (Reference DeNiro1985) and thus indicates contamination. This sample is listed in Table 1 but was also excluded from the interpretations. All the other fish samples (n=63) have an acceptable atomic C:N ratio (see Table 1). The %C and %N of all these samples indicate well-preserved collagen.
The success rate of collagen extraction for the fish samples was 94% in this study, while it was only about 40% in the Fuller et al. (Reference Fuller, Müldner, Van Neer, Ervynck and Richards2012) study—even though both projects used samples from archaeological contexts that are similar in terms of chronology, taphonomy and preservation conditions. The difference can be explained by the alkaline wash, used in this study between the demineralization and the hydrolysis steps, while Fuller et al. (Reference Fuller, Müldner, Van Neer, Ervynck and Richards2012) applied ultrafiltration after the demineralization. Because the failed samples of Fuller et al. (Reference Fuller, Müldner, Van Neer, Ervynck and Richards2012) all had atomic C:N ratios that exceeded 3.6, it is likely that the majority of the contamination is the result of the impact of soil components, such as humic and fulvic acids, from the archaeological context. In addition, all the bone material used by Fuller et al. (Reference Fuller, Müldner, Van Neer, Ervynck and Richards2012) (and in this study) was excavated from refuse contexts and cesspits rich in organic material, which represent aggressive environments in terms of post-depositional chemical alteration of bone. This could have resulted in humic substances becoming bound or cross-linked to the collagen matrix and thus difficult to eliminate. Adding an alkaline step helps to remove basic soluble organics, such as humic acids (although not completely: Arslanov and Svezehentsev Reference Arslanov and Svezehentsev1993; Van Klinken and Hedges Reference van Klinken and Hedges1995), which explains the high success rate in this study. Ultrafiltration of bone collagen, dissolved as gelatin (molecular weight ~100,000 Dalton), has received considerable attention as a method to obtain more reliable 14C dates and stable isotope signatures (Brown et al. Reference Brown, Nelson, Vogel and Southon1988; Bronk Ramsey et al. Reference Bronk Ramsey, Higham, Bowles and Hedges2004; Higham et al. Reference Higham, Bronk Ramsey, Karavanic, Smith and Trinkaus2006; Mellars Reference Mellars2006). It is indeed an effective method for removal of low-molecular weight contaminants from bone collagen. However, it does not remove high-molecular weight contaminants, such as cross-linked humic-collagen complexes (Brock et al. Reference Brock, Bronk Ramsey and Higham2007).
Dating the Sites
The date range established from historical documents for the context from Aalst–Hopmarkt was tested through radiocarbon analysis of 14 bones from terrestrial domestic mammals. All radiocarbon dates showed similar values except one (RICH 22039, Table 1). Because this sample was considerably older than the others, it may represent a residual find and it has therefore been excluded from the analysis. The remaining 13 dates could be combined [X² test: df=12, T=16.4 (5% 21.0)] into one date (363 ± 8 BP), which, after calibration with 95.4% probability, results in an age range of 1460 to 1520 AD (62.7%) or 1590 to 1620 AD (32.7%). The first range coincides perfectly with the historical date range of 1489 to 1498 AD.
The archaeological date range for the ritual deposit excavated at Tienen–Grijpenveld was tested through radiocarbon analysis of 14 terrestrial domestic mammal bones. They could be reliably combined [X² test: df=13, T=4.2 (5% 22.4)] into the single date of 1841±8 BP, which, after calibration with 95.4% probability, yields a date range of 125–225 AD. This is considerably older than the original archaeological interpretation of the ceramics from the deposit, but new information about the chronological distribution of the pottery types now allows the excavator to accept an older starting date for the assemblage (Martens, pers. comm.).
The fill of the cesspit in the late Medieval prison tower of Mechelen–Steen has only been dated on the basis of the ceramic finds. In order to allow an evaluation of the radiocarbon dates from the freshwater fish remains, the cultural date range has been transformed into a simulated radiocarbon date of 600 ± 30 BP. A similar exercise has been performed for the contents of a cesspit excavated at Dendermonde–De Cop; a date of 350 ± 30 BP will be used to compare the radiocarbon dates of the freshwater fish remains against.
Stable Isotopes of the Freshwater Fish
Figures 2, 3 and 4 depict the 99 stable isotope measurements for the carnivorous fish species, flounder and cyprinids analyzed in this study. To this dataset are added the measurements published by Fuller et al. (Reference Fuller, Müldner, Van Neer, Ervynck and Richards2012, see Table S1 in the online Supplementary Material), which allows to increase the sample size for eel and small roach.
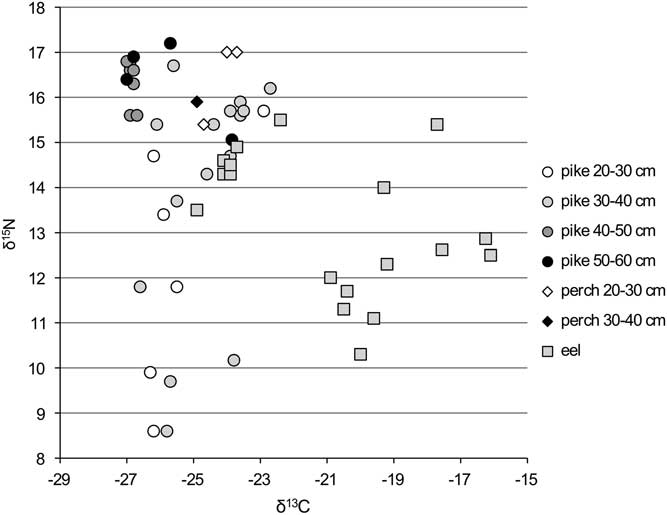
Figure 2 δ13C and δ15N ratios for the carnivorous fish from the Schelde basin (n=54).

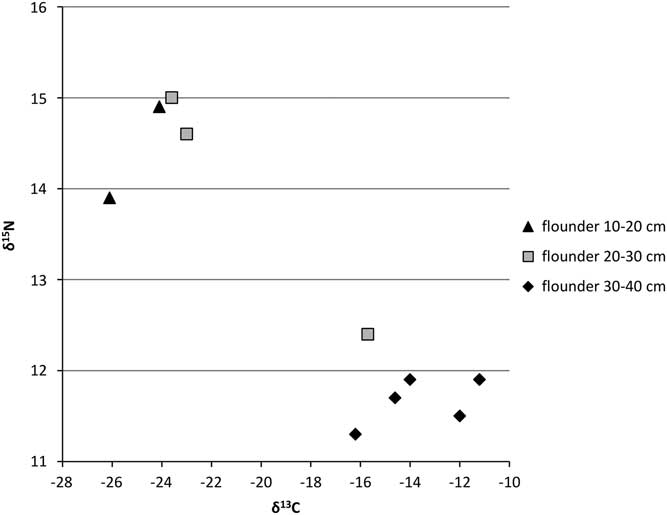
Figure 3 δ13C and δ15N ratios for flounder from the Schelde basin (n=10).

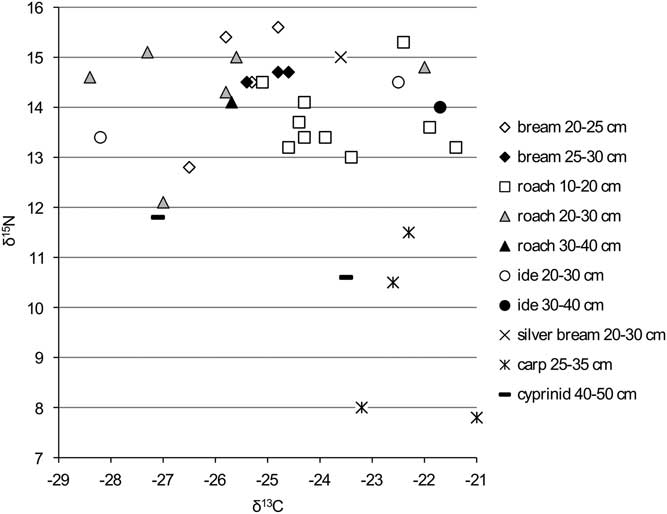
Figure 4 δ13C and δ15N ratios for the cyprinids from the Schelde basin (n=35).
The scatter of data for eel suggests the existence of two populations: one with high δ15N and low δ13C values, showing limited variation, and one with less negative δ13C and lower δ15N values, showing more pronounced variation in both parameters (Figure 2). As explained in Fuller et al. (Reference Fuller, Müldner, Van Neer, Ervynck and Richards2012), this divergence is due to the fact that the second population derives from more estuarine waters than the first one. The most 13C-depleted specimens are from Tienen–Grijpenveld, Ename and Mechelen–Lamot (Table 1), and these are interpreted as fish that were caught locally, away from the Schelde estuary. One eel from Mechelen–Lamot has a more estuarine signature, however, and that is also the case for the eel remains from the other sites at Mechelen (Steen and Veemarkt), from Aalst–Hopmarkt and from Dendermonde–De Cop. Those will have been imported to the local markets from fishing grounds farther downstream.
The stable isotope signatures of perch and (larger) pike are similar to those of the samples that were argued to be “freshwater eel” (Figure 2). Both size classes of perch show similar values, but in the case of pike, there is a clear shift in the isotope signals in animals that are older (and thus larger), a phenomenon that has recently been discussed in studies on Swiss freshwater species (Häberle et al. Reference Häberle, Fuller, Nehlich, Van Neer, Schibler and Hüster Plogmann2016a, Reference Häberle, Nehlich, Fuller, Schibler, Van Neer and Hüster Plogmann2016b). For the smaller size classes of pike, variation is high, with animals showing a range of low to elevated δ15N values. The largest specimens (>40 cm SL), however, show limited variation and consistently high δ15N values. This small variability in isotope value is strking for the larger pike and in retrospect, it cannot be excluded that some of the bones pertained to the same individual. It is possible that perch undergoes a similar shift in isotope signals during its life cycle, but because the smallest size classes are lacking in the dataset, this cannot be evaluated. For pike and perch, the dataset also does not allow to observe differences in isotopic signatures between sites.
Flounder also appears to undergo a shift in isotope signature during its life cycle (Figure 3). The smaller fish show isotope values that closely resemble those of the “freshwater eel” but do not reach the elevated δ15N values of perch and large pike (Figure 2). The larger flounder, however, show lower δ15N and less negative δ13C values and could, just like the “estuarine eel” population, represent animals living more downstream, in brackish waters. It should be noted that the lower δ15N values for these “estuarine flounder” most probably are not caused by a lower position in the food chain, but, rather, by a shift to a diet consisting of organisms from the estuary that themselves have low δ15N values. Early in life, flounder feed on small crustaceans and worms, whereas later on they mainly feed on snails and bivalves and, in freshwater, also insect larvae (Duncker Reference Duncker1960: 328). The shift towards more mollusks in older flounder explains the lower δ15N values seen in the larger size classes (cf. Riget et al. Reference Riget, Møller, Dietz, Nielsen, Asmund, Strand, Larsen and Hobson2007: fig. 2).
The cyprinids show large variation in δ13C values and rather high δ15N values for all size classes (Figure 4) compared with the flatfish and the carnivorous fishes; higher than would be expected from herbivores versus carnivores within the same food chain. The only exceptions are carp and the unidentified (large) cyprinids from Tienen–Grijpenveld (which, as noted above, cannot be carp). No marked shifts in isotope signatures between the size classes of a single species are observed. In the case of the δ15N values, this is possibly due to the fact that small specimens are virtually lacking in the dataset (cf. Häberle et al. Reference Häberle, Nehlich, Fuller, Schibler, Van Neer and Hüster Plogmann2016b).
Dating the Fish
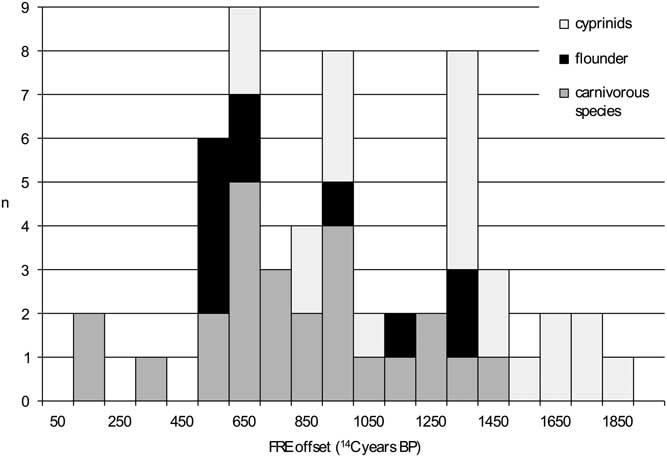
When the 56 radiocarbon dates obtained on the freshwater fish remains are evaluated against, on the one hand, the combined dates on the terrestrial mammals and, on the other hand, the simulated radiocarbon dates representing the cultural date of an assemblage, the following marked differences become clear. The minimum FRE offset for the 56 specimens analyzed is 101 14C years (for a pike from Dendermonde–De Cop), while the maximum offset is 1845 14C years, for a roach from the same site. The distribution of the FRE offsets is irregular, which must of course be the result of the (uneven) presence of different species, ecological subgroups and size classes. The distribution covers almost all of the histogram classes between the minimum and the maximum (Figure 5). There are no marked differences in the ranges of FRE offsets between carnivorous species, flounder and cyprinids, but there are differences in the end points of the absolute values, with the lowest values being attained by the carnivorous group and the highest by the cyprinids.

Figure 5 Distribution of the FRE offset for the radiocarbon dated freshwater fish remains from the Schelde basin (n=56).
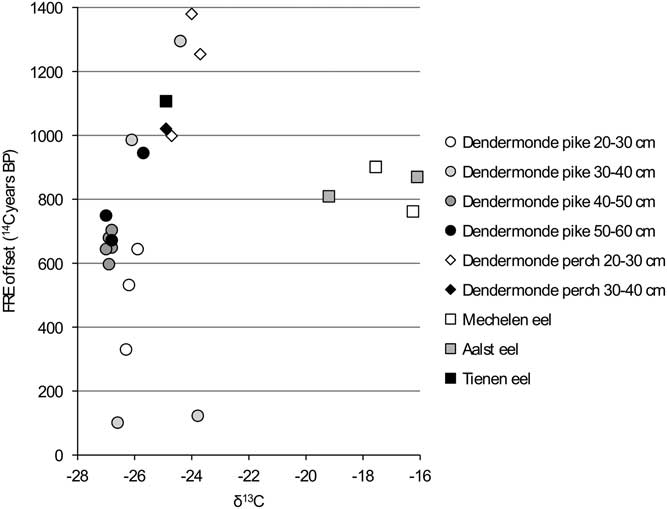
In order to facilitate the interpretation of the variation in the FRE offsets, the values are compared against the isotope measurements for each group within the dataset (carnivores, flounder, cyprinids) (Figures 6 to 11). When the “estuarine eel” are left aside, the graph of δ13C versus FRE offset for the carnivorous fish (Figure 6) suggests a relationship between the two parameters, although this cannot be proven statistically. For the most part, less negative δ13C values seem to coincide with higher FRE offsets, although the largest pike do not follow the pattern of the smaller pike exactly. In general, the large variation within a single size class of pike is surprising: amongst the animals of 30–40 cm SL, which consists of two specimens from the same assemblage from Dendermonde–De Cop, one has a FRE offset of 101 14C years, while the other attains 1295 14C years. The comparison between δ15N values and FRE offsets for the carnivorous fish (Figure 7) shows more or less the same pattern as the previous graph, with large pike again forming a distinct group.

Figure 6 FRE offset versus δ13C ratio for the carnivorous fish from the Schelde basin (n=25).
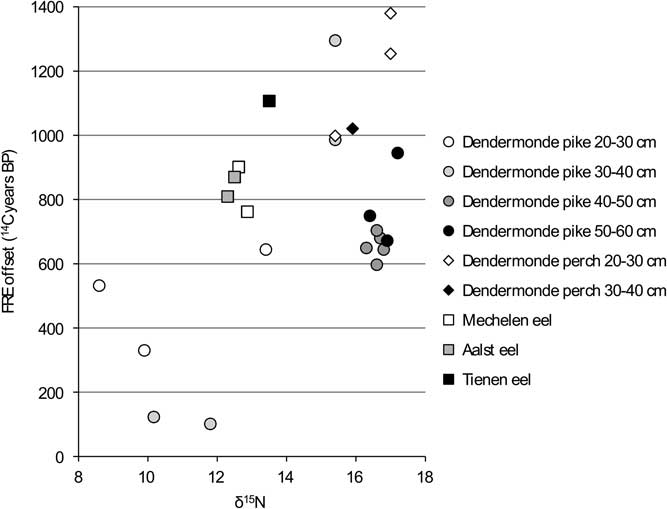
Figure 7 FRE offset versus δ15N ratio for the carnivorous fish from the Schelde basin (n=25).

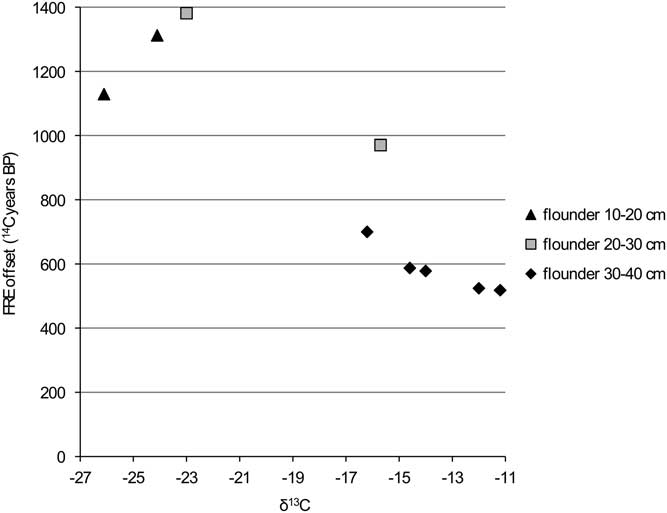
Figure 8 FRE offset versus δ13C ratio for flounder from the Schelde basin (n=9).
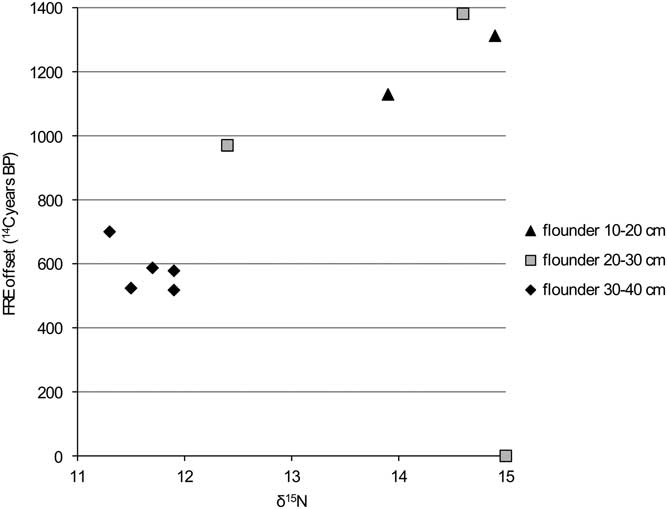
Figure 9 FRE offset versus δ15N ratio for flounder from the Schelde basin (n=9).
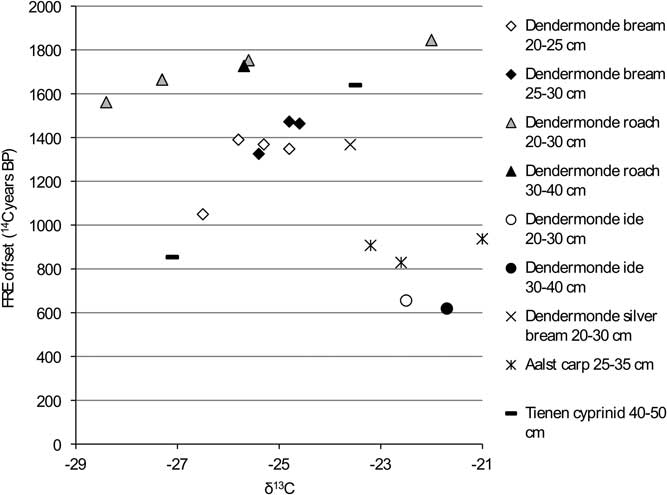
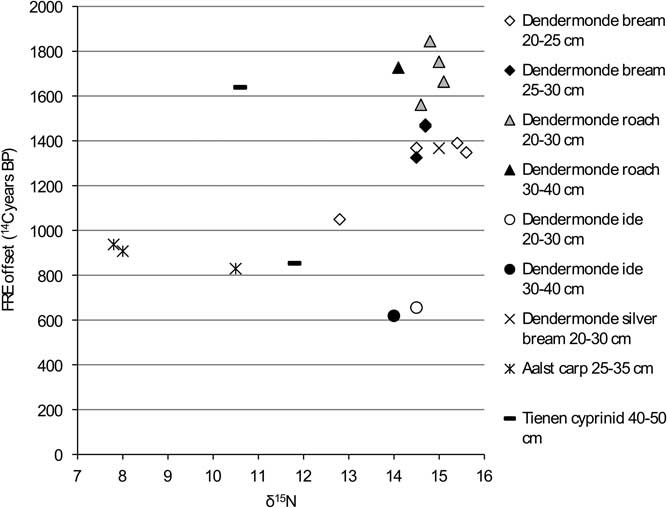
Figure 10 FRE offset versus δ13C ratio for the cyprinids from the Schelde basin (n=21).

Figure 11 FRE offset versus δ15N ratio for the cyprinids from the Schelde basin (n=21).
The comparison of the isotope values with the reservoir data for flounder (Figures 8 and 9) clearly shows that the larger animals have a lower FRE offset than the smaller ones. This difference can easily be explained by the fact that the larger animals would have lived in an environment with more input of marine water (with a reservoir offset of only 400 14C years). A shift in diet associated with the change in biotope may also have had an impact, but this is difficult to evaluate.
The graphs for the cyprinids (Figures 10 and 11) show no clear patterns except for carp and ide, which have markedly lower FRE offsets than the other cyprinids, although within that general pattern of lower offsets, the isotopic signatures of the two species are clearly different (see Figure 4).
DISCUSSION
This study has proven useful in several respects. The fact that the 14C dates of the terrestrial animals from Aalst–Hopmarkt and Tienen–Grijpenveld could be statistically combined into a single date, which in the case of Aalst coincided with the date range based on historical sources, proves that none of these species are subject to an FRE offset—not even the omnivorous pig. The stable isotope data for all of the terrestrial animals point to the same conclusion (Table 1).
More importantly, the results obtained in this study confirm the observations made by Fuller et al. (Reference Fuller, Müldner, Van Neer, Ervynck and Richards2012) concerning the high variability of δ13C and δ15N values within the group of freshwater fishes, and within individual species of fish. They also corroborate the findings of Häberle et al. (Reference Häberle, Fuller, Nehlich, Van Neer, Schibler and Hüster Plogmann2016a, Reference Häberle, Nehlich, Fuller, Schibler, Van Neer and Hüster Plogmann2016b) that the isotopic signature changes over the lifetime of a freshwater fish. In the case of pike, the same pattern has been found in the population from the Schelde basin, that had been demonstrated in the Swiss specimens studied by Häberle et al. (Reference Häberle, Nehlich, Fuller, Schibler, Van Neer and Hüster Plogmann2016b, fig. 3). A similar comparison for perch could not be made because the dataset from the Schelde basin lacks the smaller size classes (<20 cm SL) included in the Swiss study.
In general, the δ15N values of the species examined here are 4–5‰ higher than those of equivalent prehistoric remains from northern Europe (e.g. Fischer et al. Reference Fischer, Olsen, Richards, Heinemeier, Sveinbjörnsdóttir and Bennike2007; Schmolcke et al. Reference Schmölcke, Meadows, Ritchie, Bērziņš, Lübke and Zagorska2016), which may suggest a strong anthropogenic influence, rather than differences in the ecology of the river basins or climatic fluctuations. Most probably, especially the onset of severe soil erosion from the beginning of agriculture (see below) is the cause of a shift in isotope values between fish from prehistoric sites versus those from later sites. Fish farming cannot provide the whole explanation because carp (the cyprinid most likely to have been farmed) has lower δ15N values than the other cyprinids (Figure 4), a group that was presumably less likely farmed.
From this project, it is clear that the FRE offset of aquatic fish can attain high values in the Schelde basin. Aquatic environments with large FRE offsets were already known, e.g. from Lake Mývatn, northern Iceland (1300 to 1700 14C years: Ascough et al. Reference Ascough, Cook, Church, Dugmore, McGovern, Dunbar, Einarsson, Friðriksson and Gestsdóttir2007), the Caspian lowlands (1477 ± 52 and 1037 ± 52 14C years: Shishlina Reference Shishlina2010), the Lake Baikal region, in the Upper Lena river basin (1981 ± 30 14C years: Schulting et al. Reference Schulting, Bronk Ramsey, Bazaliiskii and Weber2015), and the Karachay-Cherkess Republic, on the Podkumok river in Russia (3819 ± 39 14C years: Higham et al. Reference Higham, Warren, Belinskij, Härke and Wood2010). Less elevated FREs have been assessed for Łańskie Lake in northeastern Poland (740 14C years: Pospieszny Reference Pospieszny2015), for different water bodies in Germany (Fernandes et al. Reference Fernandes, Rinne, Nadeau and Grootes2016). Studies from the Minusinsk basin, southern Siberia, possibly suggest that for that area the influence of a FRE on archaeological human 14C dates is negligible (Svyatko et al. Reference Svyatko, Schulting, Poliakov, Ogle and Reimer2016).
In many of the examples cited, the underlying mechanisms that have resulted in high or low FREs are not completely clear (Ascough et al. Reference Ascough, Cook, Church, Dugmore, McGovern, Dunbar, Einarsson, Friðriksson and Gestsdóttir2007), and that is also the case for the Schelde basin. It could be that groundwater reaching the river system had spent a long time travelling from the recharge to the discharge areas, especially when it became part of the system of deep and old geological aquifers that characterize the area (see Borremans Reference Borremans2015). Probably more importantly, it could be that ancient organic material, stored within soils and sediments (Abbott and Stafford Reference Abbott and Stafford1996; Hall and Henderson Reference Hall and Henderson2001; Moreton et al, Reference Moreton, Rosqvist, Davies and Bentley2004) was transported into the river via percolating rain and groundwater or directly deposited into the river by erosion, a process that became increasingly important with the deforestation linked with the onset of agriculture (see Butman et al. Reference Butman, Wilson, Barnes, Xenopoulos and Raymond2015, for an actualistic study). Or it could be that when the river cut through ancient peat layers, these same oxidation and deposition processes manifested themselves. Today, the Schelde river is characterized by a high amount of dissolved inorganic carbon (Hellings et al. Reference Hellings, Dehairs, Van Damme and Baeyens2001). Of course, the situation will have been quite different prior to modern-day pollution and quite different again in prehistoric times, prior to agriculture and other anthropogenic impacts, yielding the possibility that the FRE may also have been different in those days (see Meylemans et al. Reference Meylemans, Bogemans, Storme, Perdaen, Verdurmen and Deforce2013 for the evolution of the river system).
This study shows not only that the FRE in the Schelde basin reaches high absolute values, but also that the FRE is highly variable, both between species and between size classes in a single species. Within a single species, it can be assumed that the observed variation is caused by shifts in diet related to the growth of the fish or to a move towards another aquatic biotope. It would be expected to see this pattern replicated in the stable isotope data, but in most cases, the stable isotope dataset does not reveal any clear relationships between FRE offset and δ13C and δ15N values, a conclusion that was also reached by a similar study for the Eurasian steppe (Svyatko et al. Reference Svyatko, Reimer and Schulting2017). Most probably, for the Schelde basin, the unknown origin of the archaeological freshwater fish sampled plays an obscuring role. It seems likely that the archaeological freshwater fish in this study originated from different water sources and that this has complicated the picture, as water from local brooks, ponds or the main rivers is expected to have markedly different chemical composition and 14C age. Fish trade and fish farming would further complicate the picture. The current dataset, unfortunately, does not allow to investigate these complicating factors, but they certainly deserve a future study in their own right. For the same reasons (uncertainty over the fishes’ origin, large intra- and inter-species variation), differences in FRE offsets between sites could not be observed, and the evaluation of a possible diachronic evolution will remain out of reach until a much larger dataset is obtained.
The FRE offsets measured here certainly must be taken into account when interpreting radiocarbon dates on archaeological human skeletons. It has been evaluated for the marine reservoir effect in archaeological human material from Belgium (Ervynck et al. Reference Ervynck, Boudin, Van den Brande and Van Strydonck2014) that this phenomenon seems not to influence the radiocarbon dates obtained from human skeletons. However, for the FRE, the issue has been raised in a number of specific case studies, such as the radiocarbon analyses of the relic of Saint Waldetrudis (Van Strydonck et al. Reference Van Strydonck, Ervynck, Vandenbruaene and Boudin2009) and of the skeletons of two historically known bishops buried in the cathedral of Tournai (Boudin et al. Reference Boudin, Boeckx, Vandenabeele and Van Strydonck2014). The FRE offsets measured in this study will also have to be taken into account if and when skeletons from monastic graveyards in the Schelde basin are radiocarbon dated (a type of analysis not yet undertaken in Belgium), since it is known that the food rules followed in abbeys promoted the frequent consumption of both marine and freshwater fish (Ervynck Reference Ervynck1997). In general, however, corrections of the dates will be very difficult to make. First of all, the isotopic signature of a human skeleton can be the result of very different combinations of food products (plants versus meat, aquatic versus terrestrial, marine versus freshwater) (Grupe Reference Grupe2014; Phillips et al. Reference Phillips, Inger, Bearhop, Jackson, Moore, Parnell, Semmens and Ward2014), and, within the group of freshwater organisms, of combinations of many different species, size classes and ecological groups, all with their own FRE offset, as this study shows. That these freshwater organisms’ wide variety of isotope signals hardly shows a clear relationship with their FRE offset, further complicates any correction of a human radiocarbon date.
CONCLUSION
This study has shown that the FRE offsets of fish from freshwater and brackish biotopes within the Schelde basin can reach high values (up to almost two millennia) and can be very varied. Differences occur between species, between size classes within a species, between eco-groups within a species, and within all of these categories. It is likely that this large variability is responsible for the fact that any clear differences between sites or chronological periods could not be observed on the basis of the current dataset.
The observations in this study serve as a warning against assessing FREs for a particular aquatic system on the basis of only a limited sample size comprising only a limited number of species and size classes, as this may lead to the variability in FRE being significantly underestimated. It is also clear that, at least in the case of the Schelde basin, it will be extremely difficult to establish a correction factor for these FREs when dating archaeological human remains from the area, not only because the FRE offsets themselves are so variable, but also because the high inter- and intra-species variation in the freshwater fish isotope signatures observed will hamper any dietary reconstruction using inferences from the bulk stable isotopes. Even if this problem could be overcome, the lack of statistical relationship between the isotopic values and the FRE offsets will make the correction of 14C ages of human bones with a dietary FRE extremely complex, if not impossible. It should also not be forgotten that these same human bones may also be affected by reservoir effects related to the presence of estuarine or marine organisms in the diet, making the task of correcting radiocarbon dates even more challenging. Of course, all of these considerations will also be relevant when radiocarbon dating certain other categories of finds incorporating aquatic organisms, such as residues of fish remains in pottery (see Boudin et al. Reference Boudin, Van Strydonck, Crombé, De Clercq, van Dierendonck, Jongepier, Ervynck and Lentacker2010; Teetaert et al. Reference Teetaert, Boudin, Saverwyns and Crombé2017).
Finally, the suggestion that there is a significant direct (farming) or indirect (soil erosion) anthropogenic influence on the data (on the isotopes and most probably also on the FRE offsets) should serve as a warning against using data from present-day fish populations to interpret archaeological phenomena during the historic period (i.e. before the Industrial Revolution), and even more so during the prehistoric period.
ACKNOWLEDGMENTS
The authors wish to thank Tess Van den Brande and Marco Bonafini (Royal Institute for Cultural Heritage) for their contribution to the laboratory work, Mark Van Strydonck for critically reading a draft of the manuscript and Eva Kaptijn (Royal Belgian Institute of Natural Sciences) for preparing Figure 1. Two anonymous reviewers made comments that substantially helped to improve the interpretation of the results of this project.
Supplementary material
To view supplementary material for this article, please visit https://doi.org/10.1017/RDC.2017.148