


INTRODUCTION
An essential tool for studies on coastal evolution during the Quaternary is the reconstruction of relative paleo-sea levels through space-time indicators (Strachan et al. Reference Strachan, Finch, Hill and Barnett2014). For the construction of precise and accurate curves, it is necessary to establish large and reliable datasets (Baker and Haworth Reference Baker and Haworth2000; Martin et al. Reference Martin, Dominguez and Bittencourt2003; Leorri et al. Reference Leorri, Fatela, Drago, Bradley, Moreno and Cearreta2013). Relative sea level variations may be studied through geological (beach rocks and marine abrasion terrace), archaeological (shell mounds) and biological proxies (fossil vermitids and barnacle incrustation) (Laborel and Laborel-Deguen Reference Laborel and Laborel-Deguen2005; Pirazzoli Reference Pirazzoli2005; Edwards et al. Reference Edwards, Cheng, Cutler, Gallup and Richards2013). These indicators can be divided in two categories: the simple, which provide space and time information when associated to a dating method, enabling the determination of mean paleo-sea levels, and the compound, which need to be associated to other indicators, since they only provide a rough estimate of past sea level (Pirazzoli Reference Pirazzoli2005; Angulo and de Souza Reference Angulo and de Souza2014). Dating charcoal and shells from archaeological sites, for example, requires additional information that relates the depositional environment to its relation to the sea level (Pluet and Pirazzoli Reference Pluet and Pirazzoli1991; Kelletat Reference Kelletat2006; Angulo and de Souza Reference Angulo and de Souza2014).
Among the most used indicators are the fossil vermetids. Since they live in a narrow range within the mean tide, they provide precise information on the relative sea level. Their structure generally comprises high magnesium calcite (HMC), low magnesium calcite (LMC), and aragonite. Following Burton and Walter (Reference Burton and Walter1987), LMC and HMC are defined as a calcite that has <5 mol% and 5–20 mol% of MgCO3 respectively. Living individuals are mostly constituted of aragonite and HMC, most likely biogenic calcite. All three polymorphs have the same CaCO3 chemical composition with differences in the crystalline lattice. Such material is susceptible to diagenesis and depending on the environmental conditions a rearrangement of the crystalline structure may take place. Aragonite and HMC tend to dissolve and recrystallize into the more stable LMC form (secondary calcite). During this process, Ca2+ cations exchange position as CO3 2– anions rotate, causing an increase of ca. 8% in volume (Bathurst Reference Bathurst1972). Several factors can influence the process and most of them depend on the chemistry of the fluid containing the fossil (Morse et al. Reference Morse, Wang and Tsio1997). Kinetic and biological factors can also interfere (Douka et al. Reference Douka, Hedges and Higham2010).
Fyfe and Bischoff (Reference Fyfe and Bischoff1965) and Taft (Reference Taft1967) studied the transformation of aragonite into calcite in aqueous media and reported patterns of thermodynamical parameters during the reaction. Diagenesis is a matter of great concern for the scientific community as exogenous carbon may become included in the crystal structure and in the case of radiocarbon (14C) dating, incorporation of recent carbon may affect the age determination. The standard method for carbonate samples preparation consists in removing the external layer of the sample by means of acid etching or sandblasting. Screening techniques such as the use of Fiegl solution (Friedman Reference Friedman1959; Brock et al. Reference Brock, Higham, Ditchfield and Ramsey2010), X-ray diffraction (XRD) (Douka et al. Reference Douka, Hedges and Higham2010) or FTIR (Loftus et al. Reference Loftus, Rogers and Lee-Thorp2015) to detect the presence of calcite have been used to evaluate the extent of recrystallization and also the effectiveness of pretreatment prior to accelerator mass spectrometry (AMS) dating.
A previous pilot study (Jesus et al. Reference Jesus, Dias, de Azeredo Muniz, Macário, Seoane, Quattrociocchi, Cassab, Aguilera, de Souza and Alves2017), which aimed to reconstruct sea-level curves in Brazil, found that 14C ages of samples before and after acid etching were up to 1 14C kyr different. Moreover, the sample structure indicated that for some samples the acid etching was ineffective in the removal of secondary calcite. Considering that the age difference was already large, these results were discarded as they would affect the sea-level curve due to the lack of accuracy in age determination.
Impact of Inaccurate Dating on Sea-Level Curves: An Example
In order to demonstrate the importance of accuracy of vermetid 14C dates and potential impact on sea-level curves reconstructions, we have built hypothetical depth/time curves for contaminated and uncontaminated vermetids. In Figure 1, the curve (solid red line) resembles the accepted sea-level variation pattern, with sea-level rise up to 5 kBP followed by decrease to present level (Jesus et al. Reference Jesus, Dias, de Azeredo Muniz, Macário, Seoane, Quattrociocchi, Cassab, Aguilera, de Souza and Alves2017). In this example, we assume recrystallization was minimum and the standard chemical pretreatment with HCl etching would be sufficient to remove calcite from all samples. The best fit for this curve would be a 5th degree polynomial representing the rise in sea-level up to 2.5 m above the present level with a decrease after 4.5 kBP.

Figure 1 Hypothetical paleo-sea level curves. Assuming two vermetid samples with 50% contamination with average 1kBP old calcite (dashed black line) and assuming real vermetid age (solid red line). Blue arrows indicate changes in 14C ages of contaminated samples. (Please see electronic version for color figures.)
Considering an alternative scenario where two samples have 50% of calcite formed due to recrystallization and assuming 1 kBP for the average age of such contamination, the result would be apparent ages of more than 2 14C kyr younger. This shift in the ages of two samples would result in a very different curve, with oscillations in the mean sea-level around 3 kBP. It is important to notice that a curve derived from empirical data would be based on calibrated ages and the larger the dataset the lesser it would be affected by a shift in two points. Inaccuracy in 14C dates due to inadequate removal of contaminants could be responsible for the interpretation of oscillations in sea-level during the Holocene, which have resulted in a significant point of disagreement between researchers.
Two different interpretations stem from the work of Suguio et al. (Reference Suguio, Martin and Bittencourt1985), Angulo et al. (Reference Angulo, Pessenda and de Souza2002) and Jesus et al. (Reference Jesus, Dias, de Azeredo Muniz, Macário, Seoane, Quattrociocchi, Cassab, Aguilera, de Souza and Alves2017). After the last progressive maximum around 5 kBP, sea level would either have (a) gently decreased until present day (Angulo et al. Reference Angulo, Pessenda and de Souza2002; Jesus et al. Reference Jesus, Dias, de Azeredo Muniz, Macário, Seoane, Quattrociocchi, Cassab, Aguilera, de Souza and Alves2017), or (b) decreased but with oscillations between 3 and 2 kBP (Suguio et al.Reference Suguio, Martin and Bittencourt1985).
This question affects the morphogenetic evolution of coastal plains and influences archaeological and paleontological research, as well as many other disciplines. A few equivocal results have already been noticed in literature that may compromise the construction of sea-level curves (Castro et al. Reference Castro, Suguio, Seoane, Cunha and Dias2014). These include (1) mistaken age determination of the samples forming the curves, (2) lack of clarity in the interpretation of geological data in relation to paleo-sea levels, and (3) inappropriate calibration of 14C data.
Changes in the results caused by the underestimation of ages may result in equivocal interpretations of the reconstructed paleoenvironment for a given region. According to Walker and James (Reference Walker and James1992), a set of sedimentary facies follow sea-level variations in response to both transgressions and regressions. Of course, other parameters can influence the sedimentary record, such as the sedimentary rates (Suguio Reference Suguio1999), coastal declivity and waves (Psuty Reference Psuty1988) but sea-level variations are responsible for the majority of coastal transformations. Figure 2 shows possible changes in coastal morphology, which can be evaluated from the two resulting sea-level curves (Figure 1). In Figure 2b, where the difference in sea level exceeds 2.5 m, there is a significant impact to coastal and lowland areas. Coastal dynamics and processes that impact the coastal line may further increase the magnitude of any possible environmental alteration.

Figure 2 Coast of Rio de Janeiro. Simulation of possible coastal flooding at 3 kBP based on the two hypothetical curves in Figure 1. Sea level 0.5 m above present value (A) and 2.5 m above present value (B).
Up to now, XRD has been used to evaluate the degree of recrystallization in vermetids and samples are discarded when replacement calcite is within the shells (Yates Reference Yates1986). Considering the importance of accurately dating vermetids and the inefficiency of the standard sample preparation protocols to remove secondary calcite, we decided to investigate the use of density separation methods in this context. Douka et al. (Reference Douka, Hedges and Higham2010) developed a protocol (CarDS) based on a known density liquid to separate recrystallized from original fractions of a sample, resulting in a demonstrably age estimation for carbonate samples subjected to diagenesis. In this paper, we analyze 10 vermetid samples collected on islands on the coast of Rio de Janeiro with the aim of comparing the routine (acid etching) and CarDS preparation protocols and evaluating the impact of these different protocols on sea-level reconstructions.
METHODS
Sampling
Vermetid samples were collected in two different locations: eight from Ilha Grande Bay and two from Armação de Búzios (Figure 3). Fossil vermetid incrustations can be found in breaches of coastal rocks, protected from the waves action and above the present sea-level (Figure 4).

Figure 3 Sampling location on the coast of Rio de Janeiro. Samples A01 and A02 were collected in Armação de Buzios (1) and samples A03-A10 were collected in Ilha Grande Bay.

Figure 4 Vermetids on coastal rock at Ilha Grande Bay.
Sample preparation was performed at the radiocarbon laboratory of the Fluminense Federal University (LAC-UFF). In order to evaluate the fraction of preserved aragonite and the recrystallized calcite, samples were crushed in a mortar and pestle (grain size less than 150 µm) and were analyzed using an XRD. Part of the powdered sample was pretreated with hydrogen peroxide (H2O2) to remove any organic fraction. We added 5 mL of 30% H2O2 with heat (60°C), repeating the process once every 2 hr or until no more gas was evolved.
Overall, 10 samples were divided in five different subsamples: (1) untreated sample (bulk raw); (2) after 50% etching with HCl 0.1 M (bulk HCl); (3) bulk after H2O2 (bulk H2O2); (4) aragonite fraction (separated from bulk H2O2 by density); and (5) calcite fraction (separated from bulk H2O2 by density).
Density Separation
The CarDS protocol uses a heavy liquid (in our case sodium polytungstate, SPT) of known density to separate original aragonitic structures from secondary calcite ones, prior to AMS dating. The powder SPT was weighed and added to ultrapure water, dissolved with the aid of a magnetic agitator. The density was measured with a digital densimeter and approximately 300 mL of 2.80 g/cm3 solution was prepared. 300 mg of sample was weighed in a 15-mL falcon tube and 5 mL of SPT solution was added. The mixture was blended using a vortex for 30 s then sonicated for 10 min at room temperature and finally centrifuged for 15 min at 3000 rpm. This resulted in separation of two phases, a supernatant floating phase and a pellet at the bottom of the tube. With care, not to accidentally mix the separated phases, we froze the bottom part with liquid nitrogen and removed the supernatant with a Pasteur pipette, while slowly adding water. Again, we added 5 mL of SPT solution and repeated the separation process. Finally, we added 5 mL of ultrapure water, vortexed for 30 s, centrifuged for 10 min at 3000 rpm and removed the supernatant with pipette. This step was repeated two more times to ensure the total removal of SPT residues. Additionally, the supernatant was kept and washed with water to remove SPT residues. The final samples were frozen for 24 hours and lyophilized for 48 hr. After separation, both phases were in the form of a fine powder.
X-Ray Diffraction Analysis
Both separated phases and bulk samples were analyzed using XRD. Sample preparation and analysis were undertaken at the Laboratório de Difração de Raios X of the Fluminense Federal University (LDRX – UFF). A Bruker AXS 84 D8 Advance (Cu Kα radiation, 40 kV, 40 mA) model was operated in a Bragg–Brentano θ/θ 85 configuration, with the diffraction patterns being collected in a flat geometry with steps of 0.02 degrees and accumulation time of 2.0 s per step using a PSD detector (Bruker AXS LynexEye model). The XRD data were refined following the Rietveld method with the GSAS-II software (Toby and Von Dreele Reference Toby and Von Dreele2013).
Accelerator Mass Spectrometry
Bulk samples and subsamples were chemically treated to extract carbon dioxide and were then converted to graphite. Solid samples were placed in vials with septum covers and were connected to a vacuum system pumped out through a needle. 1.0 mL phosphoric acid was injected into evacuated tubes with a gastight syringe and left overnight at room temperature to hydrolysis reaction to occur. The tubes were connected back to the line and the gas was transferred in order to be purified. Dry ice/ethanol traps were used to remove water from samples while liquid nitrogen was used to trap the CO2 so that non-condensable gases could be removed. CO2 samples were then transferred to 9-mm Pyrex tubes for graphitization. These tubes were previously prepared with titanium hydride and zinc on the bottom and iron powder inside a 6-mm inner tube. Tubes were sealed with an oxy-acetylene torch and heated to 550ºC for 7 hr so that CO2 could be reduced to graphite (Xu et al. Reference Xu, Trumbore, Zheng, Southon, McDuffee, Luttgen and Liu2007; Macario et al. Reference Macario, Oliveira, Carvalho, Santos, Xu, Chanca, Alves, Jou, Oliveira and Pereira2015, Reference Macario, Alves, Moreira, Oliveira, Chanca, Jou and Diaz2017). Graphite samples were pressed in aluminum cathodes and their 14C concentration was measured at the Center for Applied Isotopes Studies at the University of Georgia (samples A01, A02 and A10) or at the NEC SSAMS system of the Fluminense Federal University (samples A03–A09). Information on the UGA and the UFF systems are reported elsewhere (Cherkinsky et al. Reference Cherkinsky, Culp, Dvoracek and Noakes2010 and Linares et al. Reference Linares, Macario, Santos, Carvalho, dos Santos, Gomes, Castro, Oliveira and Alves2015, respectively).
RESULTS AND DISCUSSION
For the subsamples that underwent H2O2 treatment we compared the weight before and after pretreatment to estimate the amount of organic matter (OM) in the samples. The results are shown in Table 1. These values are approximations only as there is always some loss of carbonate powder during the treatment and transferring of samples.
Table 1 Estimate of organic matter % in each sample based on weight before and after H2O2 treatment.

In order to validate the density separation method for the vermetid samples, we evaluate the crystallographic features of all subsamples. Figure 5 displays the X-ray diffractograms for sample A10, before and after density separation. On the top, A10 (bulk H2O2) shows the high percentage of calcite indicating strong recrystallization of the original aragonitic structure and on the bottom, A10_CSPT shows the presence of HMC, which is part of the original composition of non fossil shell samples (Lowenstam and Weiner Reference Lowenstam and Weiner1989) and insignificant concentration of LMC, the stable form of calcium carbonate (Jamieson Reference Jamieson1953). The X-ray diffractograms for all other samples are presented in Figure 6.

Figure 5 X-ray diffractograms of sample A10 before SPT (top) and after SPT (bottom).

Figure 6 X-ray diffractogram showing removal of calcite (circled in green) for the 10 samples. In black the untreated sample, in red the sample after pretreatment with CarDS.
As shown in Table 2, the extraction of calcite by density separation was successful. It should be noticed that the XRD method is semi-quantitative, the proportion being estimated in comparison to a reference standard. However, the obtained precision in the percent rates is enough to demonstrate decrease (samples A07 and A10) or total removal of the calcite peaks (Figure 6).
Table 2 Percentages of the aragonite and calcite fractions in the different samples.

Accelerator Mass Spectrometry
The AMS results for vermetids samples with different chemical treatments are shown in Table 3 and Figure 7.
Table 3 Results of AMS analysis at the University of Georgia (UGA lab codes) or at the Fluminense Federal University (LACUFF lab codes). The aragonite and calcite fractions are obtained after treatment with the CarDS protocol.

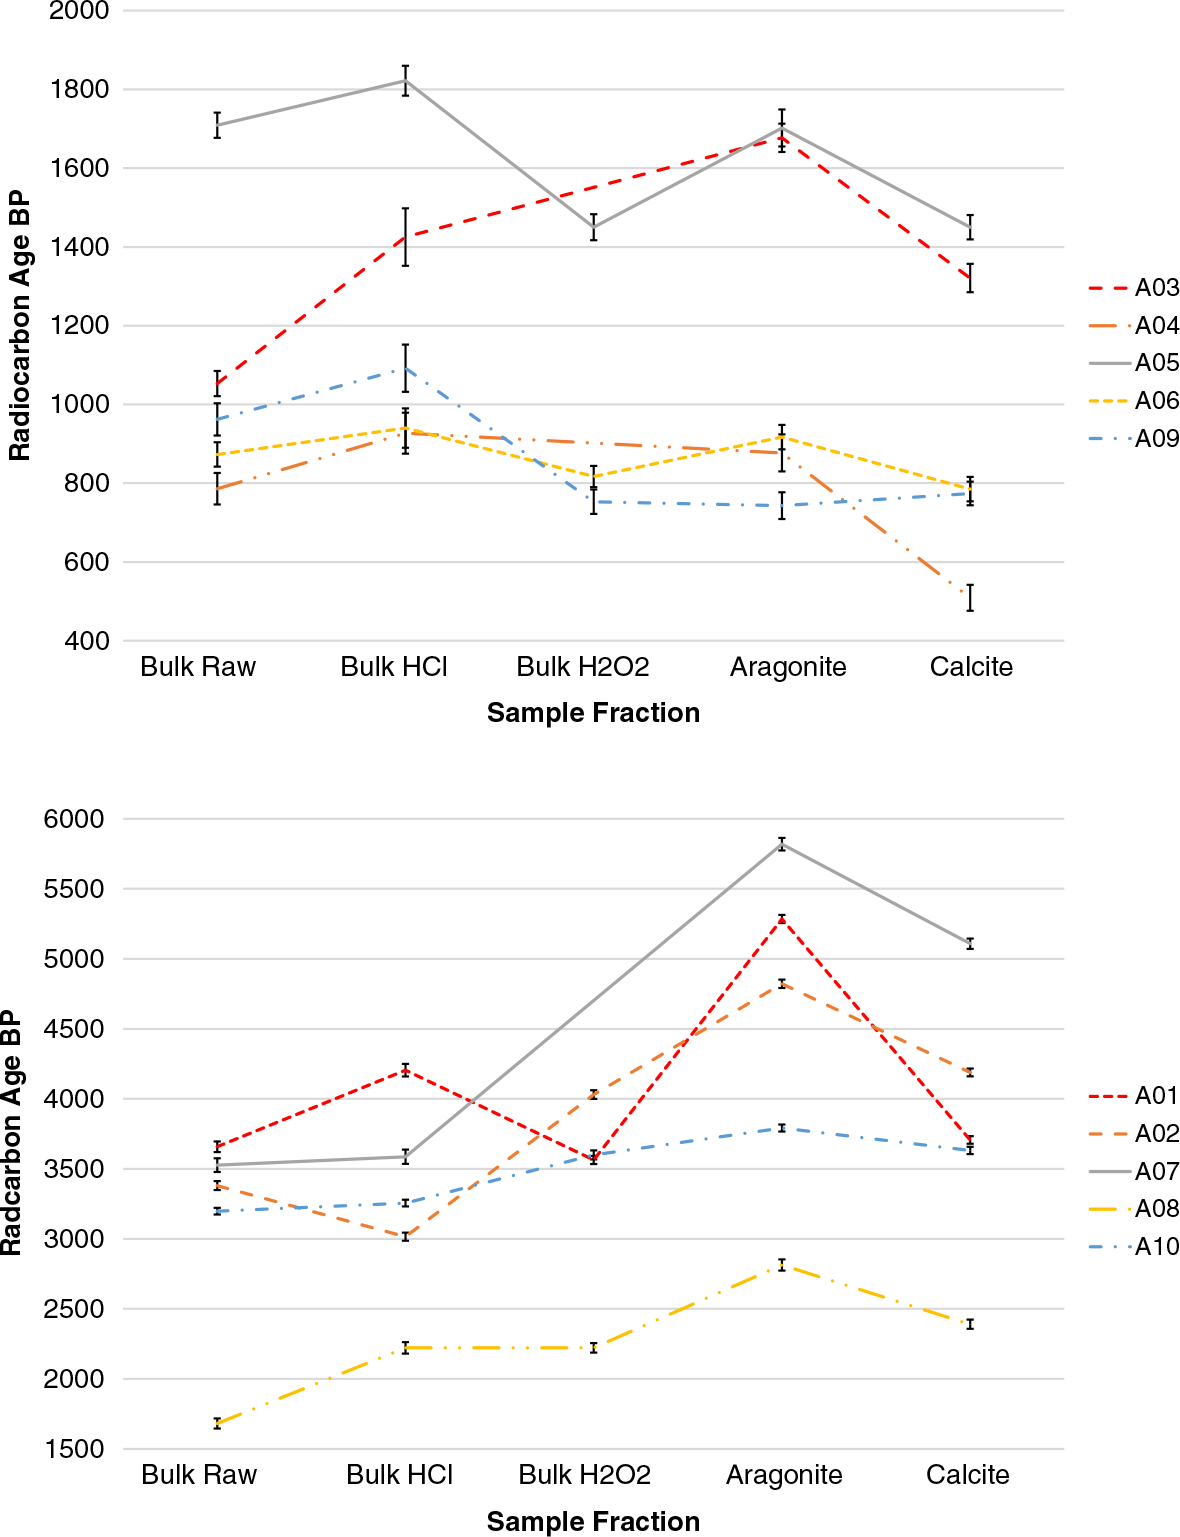
Figure 7 14C ages obtained from each chemical fraction for vermetid samples with aragonite fraction older than 2 kBP (bottom) and younger than 2 kBP (top).
Comparison of results (Table 3) between bulk H2O2 and bulk HCl (50% etching with 0.1 M HCl) treatments for each sample shows a significant discrepancy in ages in most cases. This indicates the presence of surface contamination that the etching protocol manages to remove. These contaminants could originate from recrystallized calcite, encrustation with other organisms, or any material that could have accumulated to the surface of the shell. Physical pretreatment includes removing any visible contamination prior to chemical treatment. However, vermetids have internal surfaces which are not accessible. In the standard etching protocol, we assume that it is more likely that carbon contamination is caused by recrystallization on the external surface of the sample. This protocol, however, does not remove organic material, visible in some samples that have lime residue on the surface, which is also observed on the diffractograms. Therefore, samples followed to organic matter oxidation by means of H2O2 treatment.
In some cases, however, the XRD result revealed a slight increase in the calcite concentration of samples treated with H2O2 (Bulk H2O2), and the 14C analysis of this fraction also resulted in slightly younger ages when compared to ages on bulk samples. This contamination may be related to partial dissolution of the oldest carbonate fraction during H2O2 treatment as its pH was about 3.
In the cases where aragonite and calcite were separated using CarDS, we see that in most cases the aragonite fraction yielded older ages compared to the Bulk H2O2 sample. Notwithstanding, although the age shift is not in itself an indication of the right age, the method we describe above has proved to be efficient in removing contamination of carbonate samples and crucial for obtaining more reliable dates of vermetids.
Comparison of Methods
Table 4 shows the differences between the protocol originally described by Douka et al. (Reference Douka, Hedges and Higham2010) and the one we used in the current work. The differences include the initial preparation of samples, and the use of a single solution of SPT with density of 2.80 g/cm3 in this work.
Table 4 Protocol originally described by Douka et al. (Reference Douka, Hedges and Higham2010) and the one used in the present work.

In the present work, we report complete separation of calcite for samples with up to 57% recrystallization. Above this concentration, remaining calcite was observed (Table 2) and repetition of the separation could not be performed as there was no more sample available. The 14C results show significant differences in more than half of the samples, indicating the importance of the application of such protocol to vermetid samples prior to AMS dating. In particular, for samples older than 3 kBP, with calcite contents over 50% (Figure 8), the impact of contamination through the incorporation of exogenous carbon during recrystallization was very relevant.

Figure 8 Percent of original aragonite against the 14C age of the aragonite fraction.
CONCLUSIONS
The impact of crystallization in the case of vermetid AMS dating has been understudied, yet its effect in the construction of past sea-level curves, is detrimental. Here, we successfully separate primary and secondary carbonate fractions of vermetid shells using a density protocol further verified by XRD analysis. Both aragonite and calcite fractions were directly dated, allowing us to evaluate the extent of contamination in each shell. Comparison of the 14C concentrations of raw (untreated) fractions and fractions treated with our routine protocol shows that the aragonite fraction can be up to 2 14C kyr older than the untreated sample, thus confirming the efficacy of CarDS and the importance of density separation to vermetids prior to AMS dating. We hope that this work demonstrates the need for a more efficient way of identifying and limiting the issue of secondary contamination of shells prior to AMS dating and special care with sample preparation prior to sea-level reconstructions.
ACKNOWLEDGMENTS
The authors would like to thank Brazilian financial agencies CNPq (Conselho Nacional de Desenvolvimento Científico e Tecnológico, 307771/2017-2 and INCT-FNA, 464898/2014-5) and FAPERJ (Fundação Carlos Chagas Filho de Amparo à Pesquisa do Estado do Rio de Janeiro, E-26/110.138/2014 and E26/203.019/2016) for financial support. This study was financed in part by the Coordenação de Aperfeiçoamento de Pessoal de Nível Superior - Brasil (CAPES) - Finance Code 001 and CLIMATE-PRINT-UFF (88887.310301/2018-00). We thank the editors and reviewers for comments and suggestions, which helped to improve the quality of the manuscript.


